
In 2012, the Journal of the American Medical Association (JAMA) published a study entitled Effects of Dietary Composition on Energy Expenditure During Weight-Loss Maintenance. While I’m guessing most readers have not read this study, I’m pretty sure most of you have heard about the results as it was all over the news this week.
I was fortunate enough to read an embargoed copy two weeks prior to publication with the caveat that I could not speak about it until it was released publicly. Furthermore, I’m friends with one of the reviewers who told me months prior that “a very interesting paper was going to hit a high–impact factor journal very soon.” Completing my disclosure, I had become acquainted with the senior investigator on this study, Dr. David Ludwig at Harvard.
This study sought to test an important question:
When an overweight or obese person loses weight, how does their choice of macronutrients impact their tendency to regain lost weight?
This is important, of course, because as most of us know that while losing weight is difficult, keeping it off is even more difficult. In fact, as the authors point out, only about 15% of people who lose 10% of their bodyweight can maintain the weight loss for up to one year. The obvious question is why?
You’ll recall from this post, that we must always obey the First Law of Thermodynamics. In other words, we accumulate stored energy (e.g., fat mass) when we are in a positive energy balance and we lose stored energy when we are in a negative energy balance.
Energy balance is a function of two variables:
- Energy input – what we eat
- Energy output – what we expend
Furthermore, energy output can be broken down into four sub-components:
- Resting energy expenditure (REE) – the amount of energy expended to stay alive at rest (e.g., energy required for basic cellular function like ion transport and respiration)
- Thermic effect of food (TEF) – the amount of energy required to process and digest food (I also include in this category the amount of energy lost as undigested material in stool)
- Activity energy expenditure (AEE) – the amount of energy expended by exercise and non-exercise movement (I consider these as two forms of expenditure)
The sum of REE, TEF, and AEE is called, appropriately, total energy expenditure (TEE).
Of these, REE is the dominant “sink” of energy output in most people, and it is generally proportional to bodyweight. I’ll cover the importance of this momentarily.
The traditional model of obesity, the so called “calories-in-calories-out” model, says that obesity is caused by the energy input terms exceeding the energy output terms. In the words of one prominent obesity researcher, “While it is mathematically true that someone who has gained weight has consumed more energy than they have expended, using the First Law to explain why someone gains weight is of little help. The First Law is descriptive but not explanative.”
I couldn’t have said that better myself. The mistake most folks make when using the First Law to explain weight gain (versus using the First Law to describe weight gain) is that they lose sight of the fact that these variables – input, REE, TEF, AEE – are linked. They are dependent on each other. They don’t exist in isolation.
Proponents of the Alternative Hypothesis argue that intake (i.e., food) plays a role on hormones and enzymes in the body that have a resulting impact on energy output, and even subsequent input. For example, eating one food over another can increase or decrease appetite, increase or decrease REE, increase or decrease AEE, and even impact TEF. While the effect on each of these may be modest in isolation, even small changes over the course of days can result in significant changes over months or years.
What does all of this have to do with this study?
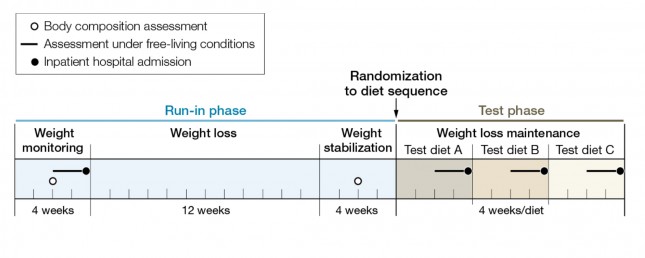
The figure below shows how the study was conducted. This was a prospective design 3-way crossover study of 21 overweight or obese subjects with an average BMI of 34.4. Each subject underwent a 20-week run-in phase, which is very common in weight-reduced studies. During the run-in phase all baseline measurements are collected, including body composition by DEXA, TEE by doubly-labeled water, substrate utilization by respiratory quotient, and plasma levels of various blood markers (e.g., lipids, blood chemistry, hormone levels). No, unfortunately, lipoprotein particles were not counted.
During the 12 week weight loss phase caloric intake was reduced until each subject lost 12.5% of their starting (stable) weight. For the final 4 weeks of the run-in phase energy intake was again calibrated to hold their now-reduced-weight stable.
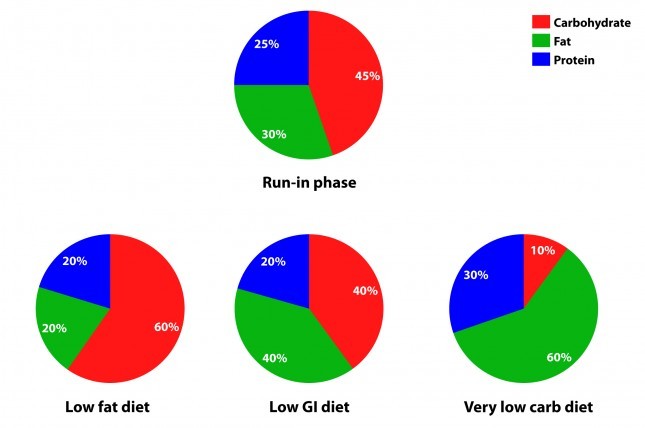
The figure below summarizes the data from Table 1 of the paper, showing the breakdown of macronutrients during the run-in phase and the subsequent 3 dietary interventions, each lasting 4 weeks. Again, each subject did each diet for 4 weeks due to the 3-way cross-over design. In other words, each subject spent a total of 32 weeks in the study (20 weeks of run-in and 3 x 4 weeks of each intervention diet).
How did the diets impact energy expenditure?
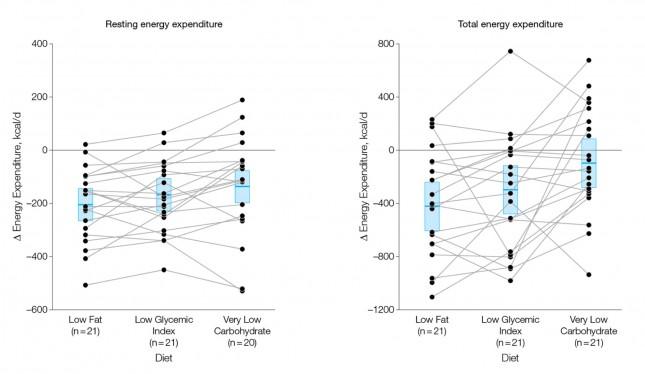
The figure below shows the change in REE and TEE measured for all groups. There was no difference in total physical activity or exercise, so presumably there was no appreciable change in AEE. I could not find a mention of TEF, suggesting it was not measured. These figures are a bit ugly, but they convey helpful information. Each dot represents an individual subject and the lines joining each dot allow you to see the change for each subject across the 3 diets. The blue box shows the mean change (middle of the box) with the 95% confidence interval above and below. The height of the box is therefore two standard deviations.
A few things stand out from these results:
- The group consuming a very low carbohydrate diet had a higher REE and TEE than the low GI group, which had a higher REE and TEE than the low fat group. In other words, the fewer carbohydrates in the diet, the higher the resting and overall expenditure. This is actually the sine qua non of the alternative hypothesis: something beyond the actual number of calories is playing a role in how the body expends energy.
- As expected, given that each subject was starting from a weight-reduced state, the REE was lower for each group, relative to their baseline. REE is highly (though clearly not entirely) dependent on body mass.
- There is enormous variation between subjects by diet type. For example, at least one subject saw a dramatic increase in TEE on the low GI diet versus the other two, while another saw the greatest TEE on the low fat diet. This speaks to a theme I iterate on this blog: be willing to self-experiment until you find what works for you.
How did the diets impact metabolic parameters?
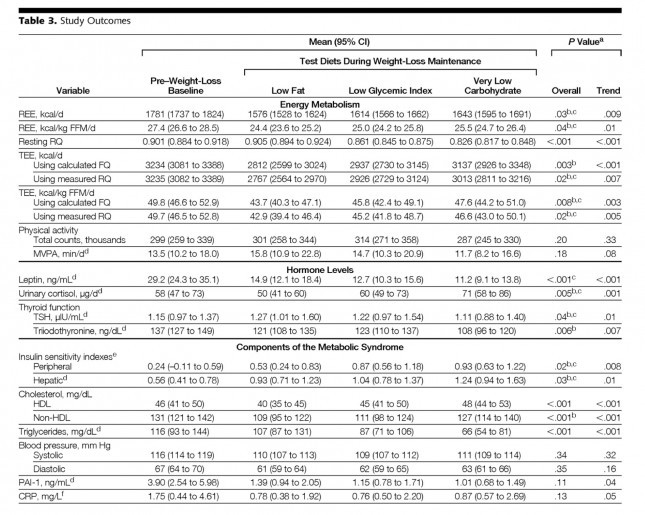
The table below shows the changes in hormone levels and metabolic syndrome biomarkers.
One thing that really jumped out at me was that it is quite likely that not one of the subjects in the study met the formal criteria for metabolic syndrome. MS requires at least 3 of the 5 parameters (blood pressure, waist girth, fasting glucose, HDL-C, and TG) exceed threshold. The thresholds are as follows:
- BP > 140/90 [No subject met this at baseline]
- Waist girth > 40 inches (men), >35 inches [Not reported, but let’s assume at least some subjects met this]
- Fasting glucose > 100 mg/dL [Not reported, but let’s assume at least some subjects met this]
- Fasting TG > 150 mg/dL [No subject met this at baseline]
- HDL-C < 40 mg/dL (men), < 50 mg/dL [No male subject met this, but it’s possible some female subjects did]
This may speak to the age of the subjects, which averaged 30.3 years, but I would have expected a worse set of baseline metabolic parameters. It also speaks to the point that just because someone is obese doesn’t mean they have metabolic syndrome and vice versa.
Tables are a bit cumbersome, so I took the liberty of graphing some of these results, mostly because I just can’t resist playing with think-cell (PowerPoint without think-cell is simply a tool for torturing people.)
I’ve explained p-values before, but let me explain the two types of p-values reported above and below.
P_overall is the p-value testing the hypothesis that the mean outcome of the three diets was equal. The smaller this value, the more likely the differences were not due to chance. As a general rule, if the p-value is greater than 0.05 we say the difference is “not significant.” Most use a more stringent requirement of 0.01 to hit the mark of statistical significance.
P_trend is the p-value testing the hypothesis that the mean outcome of the three diets showed a trend from low fat to low GI to low carbohydrate.
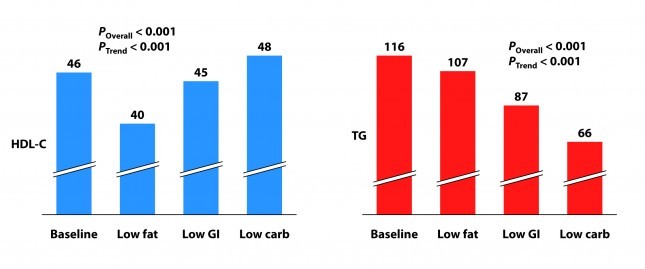
Not surprisingly, the low fat group experienced a significant reduction in HDL-C. It’s been documented many times that dietary fat raises HDL-C and dietary carbohydrates reduce HDL-C.
Each group also experienced a reduction in triglyceride (TG) level. Since we know carbohydrates, not fat, raise TG, you may wonder why this was even the case in the low fat group, which actually increased carbohydrate intake. I suspect it was a carbohydrate “quality” issue. I’m guessing the baseline levels reflect more sugar consumption than the low fat phase. Nevertheless, and again not surprisingly, the high fat-low carbohydrate group experienced the greatest improvement in plasma TG levels.
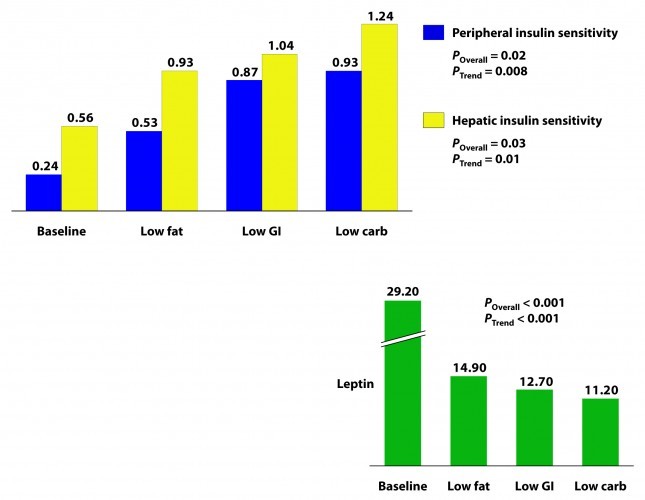
Insulin sensitivity was measured according to a protocol in this paper. The protocol uses time blood draws after an oral glucose challenge. The higher the index, the greater is the insulin sensitivity. Each diet improved both hepatic and peripheral insulin sensitivity and both the overall differences and the trends were significant.
If insulin is the most important hormone regulating fat metabolism and accumulation, leptin is certainly a close cousin. Leptin is a hormone secreted by fat cells that plays an important role in regulating appetite and some metabolic functions. High levels of circulating leptin can be suggestive of leptin resistance which, like insulin resistance, tends to be a marker for metabolic derangement. I’ll write a lot about leptin in subsequent posts. While leptin sensitivity was not directly measured as insulin sensitivity was, the significant reduction in circulating leptin levels suggested it was also improved in all groups, though greatest in the low carbohydrate group.
How did the diets impact inflammation?
Two markers for inflammation were evaluated in this study, C-reactive protein (CRP) and plasminogen activator inhibitor-1 (PAI-1). Neither is particularly sensitive in the way, say, Lp-PLA2 is (this was discussed in the cholesterol series). Nevertheless, they give us some indication of how much overall inflammation exists in the body.
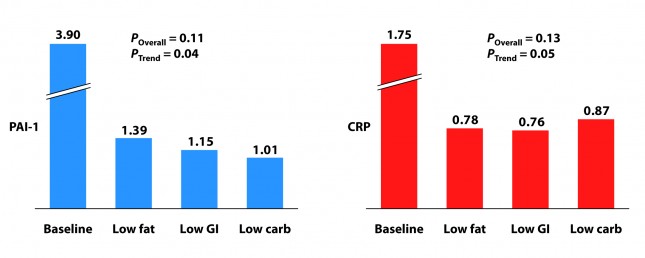
Each group experienced a significant decline in both PAI-1 and CRP, and there was no significant difference between the groups for either marker. However, the trend was (barely) significant favoring the low carbohydrate group for PAI-1 and favoring the low GI group for CRP. Sorry low fat, you didn’t win either.
I know what you’re thinking because it was the first thought that ran through my mind when I saw this table: What? Is this meaningful or is it an example of statistical chicanery? I’ll let you decide, but I’m pretty sure I know the answer.
Because I know some of you will ask, I will comment in a subsequent post on the changes seen in TSH, T3, and cortisol. These topics deserve a post of their own.
What should have been taken away from this study?
This study reproduced a number of results which have been noted for decades:
- Low carbohydrate, high fat diets reduce TG and raise HDL-C more than other diets.
- Low carbohydrate, high fat diets improve insulin sensitivity more than other diets.
It never hurts to hammer those findings home again, but the really dramatic finding of the study was the impact of macronutrient balance on REE and TEE. At previous count (circa 2011), 81 studies over the past 80 years involving 4,094 subjects for more than 1.2 million subject-days have attempted to ask this question – many of them attempting to “prove” that all calories are created equally. While none (i.e., not one) have refuted the alternative hypothesis, most of them had enough methodologic limitations that it was difficult to know for certain if the type of food – rather than the number of calories – was playing an important role.
This study, while still limited (e.g., short duration, small sample size), makes one of the more compelling cases that all calories are not created equally.
What was taken away from this study?
The embargo on this paper was lifted at 4:00 pm EDT on Tuesday, June 26, 2012. Within about 30 minutes I was being bombarded with news stories that, if you hadn’t read the study, as virtually no one actually does, would suggest that the low carbohydrate diet was the “worst” of the three diets tested. This was not universally true, in fairness to the media, but there was no shortage of this sort of commentary:
USA Today
…the authors note a downside to the low-carb diet: it appears to raise some risk factors for heart disease.
Marion Nestle, a nutrition professor at New York University, says longer studies conducted among people in their own environments, not with such controlled meals, have shown “little difference in weight loss and maintenance between one kind of diet and another.”
George Bray, an obesity researcher at Pennington Biomedical Research Center in Baton Rouge who has also studied this topic and who wrote the accompanying editorial in JAMA, says that other studies “show that you can do well on any diet as long as you stick to it. Adherence is the major key for weight loss and maintenance. There is no magic in any diet.”
The New York Times
…the low-carb diet “also had marked problems. It raised levels of CRP (c-reactive protein), which is a measure of chronic inflammation, and cortisol, a hormone that mediates stress.”
The Wall Street Journal
…the low-carb diet had the biggest boost in total energy expenditure, burning about 300 calories more per day than those on the low-fat diet — about the same as an hour of moderate exercise. But that bump came at a cost: increases in cortisol, a stress hormone, and a measure of inflammation called CRP, which can raise the risk of developing heart disease and diabetes.
Some of these comments were patently false (e.g., “the low carbohydrate diet raised levels of CRP” according to the New York Times), reflecting utter incompetence, but most of them commit a different journalistic sin: They miss the forest while machinating on one leaf.
Tragically, most people (unfortunately this includes physicians, dietitians, and politicians) have neither the time nor scientific discipline to wade through these studies and understand their implications. Instead, they rely on “reputable” journalists to translate for them.


Dr. Attia, do a post on the low-carb, high protein study listed above. I drive way to fast to worry about cholesterol. 🙂
Wow. Just wow. How is it that after all these years, and all these studies proving otherwise, low carb is STILL the media’s favourite whipping boy on just about every topic imaginable?
Back to cholesterol!!!
Pretty please?
With Xylitol on it!
Don’t get distracted on LCHF vs SAD and not finish cholesterol.
You’ll feel better once you put that one to bed.
Thank you for your site. I have been in Ketosis for 3 weeks, have lost 14lbs, and feel great. Just have 2 quick questions:
1. What are the effects of no-carb alcohol on Ketosis? (ex. Vodka)
2. What are the effects of caffeine on Ketosis?
1. Little impact on ketosis, but still leads to de novo lipogenesis in consumed beyond small/modest amounts.
2. Not clear, but probably not significant.
my vote is to stick with this topic
Thanks, Bill
Swedish study next, please!
Peter,
Nice post, Peter. Also, interesting comments (I think) on same study by Phinney and Rosedale at: https://www.meandmydiabetes.com/
Your observation of the lack of clinical symptoms in the ~30-years-old cohort is a good one, and important. Your colleague Tara Dall points out how long (years to decades, typically, after detectable lipid derangement) it takes before measurable hyperglycemia occurs. Having extensively studied the T2DM research myself, this delay is a well recognized and oft-demonstrated characteristic of the pathogenesis of hyperglycemia. The same goes for other chronic diseases, I speculate.
The apparent irreversibility of so-called metabolic derangement (whatever this actually is) is a common theme in chronic disease. I think that it is probably developing in some of the 30-year-old’s, in different tissues for each individual according to genetic susceptibility. I think that it is fundamentally bio-energetic (i.e. mitochondrial) in nature. Possibly it is also partly a product of genetic aging that is unavoidable (i.e. hard-wired). A fair amount of damage probably has to accumulate before detectable disregulation ensues — the body is endocrinologically fairly robust in design (i.e. evolution) but not indestructable; we all die eventually. One theory of the fundamental cause of insulin resistance itself is via mitochondrial dysfunction.
Possibly part of the problem with excess carb’s in the diet is a chronic overload of glucose metabolism, and that this is not evolved for and is relatively damaging over the long-term. Glucose metabolism seems to be more deleterious to mtDNA (and nuclear DNA) — hence, the difficulty or slowness of reversing damage in various tissues. These are prevalent ideas — not my own — but they seem to jibe with observations such as those in this study. They also jibe with the insulin/carb hypothesis, since these chronically increase glucose metabolism at the cellular level.
The insidiousness of the early damage in chronic (or Western) diseases is generally underappreciated — it could help a lot on a societal scale to somehow mitigate this problem. But it won’t necessarily enhance revenues in the medical and pharmaceutical industries, unfortunately. I wish I had access to today’s tools (e.g. internet) and science at age 30.
Ken, I think your hypothesis is quite sound. There is clearly a time-exposure issue that makes this problem worse.
Ron Rosedale’s perspectives are, as always, quite interesting.
One of his observations is that properly designed low-carb diets tend to *decrease* metabolism, not increase it, as evidenced by such changes as reduced basal body temperature and lower free T3. Rosedale considers this one of the most fundamental benefits of his dietary approach, since it retards aging. He speculated that the increased energy expenditure seen in this study resulted not from the carb restriction at all, but from the gross excess of protein in the low carb diet that had to be burned by the subjects, a highly inefficient and thermogenic process.
He also comments on the cortisol and CRP findings. He points out that cortisol, as an anti-inflammatory hormone, may be regarded as quite beneficial in many circumstances, as evidenced by its higher levels in centenarians and the animals on calorie-restricted diets who experience such prolonged lifespans. He clearly thinks it’s either cynical or ignorant to claim that the cortisol findings in his study somehow impugn low carb diets, even they are believable.
Hi Peter,
Thanks for another great writeup! I originally heard of this study from the NYT article, and had a thought in the back of my mind that you’d probably be writing an article about it at some point!
I wanted to ask a quick question about the types of fat consumed in each of the three diets + run-in phase. Specifically, I notice that each of the diets have a slightly different ratio of SF to MUFA to PUFA, and I’m wondering how this might have influenced the study results. (Run-in was 1:2:1, LF was 1:1:1, GI was 1:2:1 and LC was 2:2:1)
Thanks!
Not sure about rationale, though it may be have a function of feasibility (i.e., how to get folks to eat palatable food a the prescribed ratios). Will ask.
Peter,
Truly first class analysis of this much hyped study, however please ignore the Swedish one – it is not remotely worthy of your time – and instead continue with your invaluable cholesterol series.
The vote is so close!
I love the analysis of the studies, but have been anxiously awaiting the “payoff” on the cholesterol series.
However, some of your responses to some of the LCHF elevated LDL-P questions makes me wonder if there actually will be a payoff. Of course, if it were obvious, NuSI wouldn’t have anything to do, so please either complete cholesterol or skip to the last chapter on it and fill in more detail later. My heart can’t take the suspense…
(BTW, when you wrap up all of these posts into the inevitable bestselling book, make sure we grizzled old War on Insulin veterans don’t have to go to SD for a signed copy…)
Ha ha. I love it. Maybe the few who remember WoI will have special status…
I vote for the old name! TheWar on Insulin…and the defense of fat! It is passionate, intruguing, and counter-intuitive; I think it would make people so curious they would want to check it out. Yes, I guess you can tell who the original class members are…we’ll have to make t-shirts or buttons 🙂
I agree that the Swedish study isn’t worth your time. Those interested in reading more can look at the comments. They do a terrific job of exposing the multiple weaknesses of the study. The biggest mystery is why the BMJ chose to publish such a poor study.
Thanks for the very informative discussion on this study.
Remembering Gary Taubes’ NYTimes magazine piece of some ten years ago, which began with the image of nutritionists’ nightmare of realizing that all of their advice about a low fat diet was wrong, and remembering all of the scorn and derision heaped on Dr. Atkins by the medical community, it is understandable that people emphasized the high CRP results of the high fat / low carb diet and still cling to their previous advice about the low GI diet.
By the way, the bad interpretation may not rest with the NYTimes and others, but with Ludwig himself (unless misquoted even in quotes) as the following excerpt from Marc Bittman’s article shows.
[But not so fast; the “Atkins” diet also had marked problems. It raised levels of CRP (c-reactive protein), which is a measure of chronic inflammation, and cortisol, a hormone that mediates stress. “Both of these,” says Ludwig, “are tightly linked to long term-heart risk and mortality.”
His conclusion, then? “The ‘Atkins’ diet gives you the biggest metabolic benefit initially, but there are long-term downsides, and in practice, people have trouble sticking to low-carb diets. Over the long term, the low-glycemic diet appears to work the best, because you don’t have to eliminate an entire class of nutrients, which our research suggests is not only hard from a psychological perspective but may be wrong from a biological perspective.”]
The calories in / calories out restatement of the 1st law of thermodynamics seems to me do show just how bankrupt nutritional science has been on this subject of obesity. We despise economists, but none are so vapid as to tell us that the reason a government is running a deficit is because is spends more than it takes in.
Surely the epidemic of obesity in our society presents a “prima facia” case that there is something wrong with our modern diet. It seems a ridiculous notion that the problem is simply that somehow we suddenly are a people with no self control exposed to limitless amounts of food.
I wonder if the answer lies in human bacterial ecology, the microbiome. Researchers may find that our modern diet has evolved drastically in the recent past to include previously unknown foods like high fructose corn syrup, and that this diet has altered the microbiome in our gut, fundamentally changing our digestion. Some people more than others have suffered radical and harmful changes to their digestive system’s bacterial biome . Some changes are easily reversed to a more healthy state, others are not. Severe calorie restriction will always result in weight loss. But this idea of a changing biome in our digestive system suggests why some people have so much difficulty controlling their weight and why sometimes a corrected diet can restore health without the need for stringent calorie restrictions.
The human body can sustain homeostasis throughout its many systems, and in a healthy body maintaining a normal weight should take as much effort as maintaining normal blood pressure or body temperature.
Well said, Martin.
Thanks for this, as I have taken an interest in the role of microbes as well. I posted some links,and my thoughts in Dr. Jay Wortman’s blog. Here it is.
I have been reading quite a bit on the role of bacteria in the problem of obesity, and diabetes. A large study on bacteria was in the news, and how the bacteria adapted to their environment. Our diet can change in a short time the environment the bacteria live in. We will not need the same bacteria if our diet has little carbs.
Also related, is the problem of antibiotics. After such treatment, the bacteria may never come back completely, and thus making it harder for us to digest and handle carbs.
Have you looked into LC/HF in treatment of intense infections, and AIDS. You were in that field of AIDS management at one time. I have read that the reason AIDS is so rampant in Africa is because of lack of nourishment. Dr. Weston Price wrote that those people on their traditional diet, did not get Tuberculosis.
Here are some links I found on bacteria, diet, and obesity.
https://health.yahoo.net/experts/dayinhealth/are-antiobiotics-making-us-fat
https://www.ncbi.nlm.nih.gov/pmc/articles/PMC2586385/?tool=pubmed
https://www.ncbi.nlm.nih.gov/pubmed/20847294
https://journals.lww.com/jcge/pages/articleviewer.aspx?year=2010&issue=09001&article=00005&type=abstract
https://www.ncbi.nlm.nih.gov/pmc/articles/PMC2770164/?tool=pubmed#SD1
https://www.ploscollections.org/article/browseIssue.action?issue=info:doi/10.1371/issue.pcol.v01.i13
Thanks for all you do!
Thanks for your analysis.
If you’re counting votes, I’ll add mine for continuing your cholesterol series. I’m a practicing general internist, and have learned a lot, but still waiting to see how you approach treatment. One of my hardest decisions is when I’m faced with a patient, especially a woman, who is at low risk overall, but has moderately elevated cholesterol. I have a hard time committing to long term treatment with a statin when the absolute risk reduction is very small. I have started ordering the NMR lipoprofile, to better assess their true risk, but still look forward to your views on statins.
Thanks for all the good info!
Dear Dr. Nease:
You are the first doctor I have seen in my entire life who appears interested in middle-aged women. OMG. Please tell us you practice in Northern California so we can come see you. I haven’t been to a doctor in 15 years since the last one told me “Just go to Weight Watchers. You wouldn’t have any problems if you’d stop eating like a pig.” Exact quote. At that time, by the way, I wore a size 10 dress, so I was at most 20 pounds overweight. Many many of the women here would beat a path to your door.
Another vote for the cholesterol series here. I already know that a calorie is not a calorie. 😉
Dear Greensleeves,
I am located in Tennessee, so it would be a rather long drive. Sadly, I do see women who have had similar experiences, and physicians who make comments like the one made to you are an embarrassment to the profession. Part of the reason I am more empathetic is that I’ve struggled with my weight since about 9th grade ( I’m in my 50’s). One of the reasons I am interested in the alternative theory, as Gary taubes calls it, is seeing how extremely difficult long term weight loss really is. I know my patients are trying, but their long term success rate is really poor. Our traditional weight loss advice just doesn’t work for most patients, which to me means we need to keep looking for better solutions. Best wishes to you , and please don’t judge all doctors based on that jerk.
My vote is for the Cholesterol Series 🙂 But do whatever makes you happy, Peter! Thank you again for all of your hard work! maryann
And another question, Peter, if you will indulge me.
In spite of my comment above, thank you for your explanation of the variables in energy balance. Energy input, what we eat, seems to be easy to measure. Energy output is much more complex. While REE is said to be the biggest factor, and AEE seems measurable, I often wonder about TEF, especially “the amount of energy lost as undigested material”. This seems to be glossed over as unimportant. Does the ick factor prevent researchers from collecting and analyzing the caloric content of all excretions? And if so how do we know that they are insignificant, especially cumulatively over a long period of time? How do we know that excretion of unneeded calories is not a factor in maintaining normal weight in healthy individuals?
I don’t think the ick factor plays a role. Historically, this “sink” of energy has not accounted for much variation. It is very possible, however, that such observations were made across a less dramatic swing of macronutrients. In other words, perhaps under the conditions of this study a greater change in TEF would have been noted.
Finally! Someone takes into consideration energy in stool. It’s got to be significant.
My vote is for cholesterol series.
Now, take 16 ounces heavy whipping cream (Trader Joe’s organic is good) with 2 ounces of Mascarpone cheese (a sweet cream cheese), add about a teaspoon of vanilla and a bit of cinnamon and whip till very stiff.
I eat a couple scoops at a time with 1/4 of a banana, thinly sliced, or a few blueberries, or just alone.
Nothing better. Ice cream can’t touch it.
Just wanted to clarify: Mascarpone has no sweeteners. It is sweet in the sense of not being tangy or savory like cream cheese.
Hi Peter, great article. Energy intake was constant for the weight-loss maintenance phase and the low carbers were burning more calories; do you have a theory as to why they didn’t lose more weight? 300 kcal/d should’ve made a noticeable impact after a month.
I’m trying to figure out if diet was titrated to TEF. In other words, they could have been matching intake to TEF to hold the reduced-weight constant. I haven’t scrubbed the supplemental methods to see if this happened.
I am not a huge fan of testing for the trend either, especially for what is essentially a mixture experiment. I would like to hear your thoughts on this before continuing with cholesterol.
Another delightful post. I’d love to hear about swedish women soon. 🙂
I’m enjoying many opportunities to pass on the link to your blog. The starting point I give to a lot of people is your ” not pregnant” picture. But I”m pretty sure they’ll read more after that. 😉
I was looking for something on my computer yesterday and I found a picture of my from 2009, about 4 weeks after swimming from LA to Catalina Island. I was about 40 pounds heavier than I am now. I don’t even look like the same person.
According to table 3 mean TEE was 3137kcal. 30% protein=235g and 10% carbs=78g.
I’m not an expert but from everything I have read this macro split is good for gluconeogenesis = extra energy needed. Add high protein thermogenic effect to this and extra 300 calories doesnt sound strange any more.
It would be interesting to see TEE with typical keto set up – max 30g net carbs and 1g protein/lean LBS.
Yes, just responded to another question with this point.
Oddly, the quote for the day I get out of this great article…
PowerPoint without think-cell is simply a tool for torturing people.
Oh yeah, the rest of the article about the whole sciencey bit is also good too. 😉
Think-cell is the greatest PP plug-in ever…
HaHa! Travis, me too! I went right to Think-cell before reading the rest of Peter’s post.
Peter, when you see Ludwig, can you ask him whether the low-fat diet contained refined grains? It isn’t clear, and Don Matesz has argued from the fibre content* that it must have. This is very important in view of the possibility that the lower energy expenditure on this diet was due to oxidative stress in hypothalamic POMC neurons. White flour has had most of its (antioxidant) manganese removed and replaced with (pro-oxidant) iron. I realise all subjects were given a vitamin/mineral pill, but white flour + pill may not be the same thing as whole grains.
*Matesz says ‘…This means that a 2000 kcal low-fat diet composed of whole grains, legumes, vegetables, and fruits could supply about 80 grams of fiber. Yet theirs supplies only 30 g of fiber…’
Will do.