
In 2012, the Journal of the American Medical Association (JAMA) published a study entitled Effects of Dietary Composition on Energy Expenditure During Weight-Loss Maintenance. While I’m guessing most readers have not read this study, I’m pretty sure most of you have heard about the results as it was all over the news this week.
I was fortunate enough to read an embargoed copy two weeks prior to publication with the caveat that I could not speak about it until it was released publicly. Furthermore, I’m friends with one of the reviewers who told me months prior that “a very interesting paper was going to hit a high–impact factor journal very soon.” Completing my disclosure, I had become acquainted with the senior investigator on this study, Dr. David Ludwig at Harvard.
This study sought to test an important question:
When an overweight or obese person loses weight, how does their choice of macronutrients impact their tendency to regain lost weight?
This is important, of course, because as most of us know that while losing weight is difficult, keeping it off is even more difficult. In fact, as the authors point out, only about 15% of people who lose 10% of their bodyweight can maintain the weight loss for up to one year. The obvious question is why?
You’ll recall from this post, that we must always obey the First Law of Thermodynamics. In other words, we accumulate stored energy (e.g., fat mass) when we are in a positive energy balance and we lose stored energy when we are in a negative energy balance.
Energy balance is a function of two variables:
- Energy input – what we eat
- Energy output – what we expend
Furthermore, energy output can be broken down into four sub-components:
- Resting energy expenditure (REE) – the amount of energy expended to stay alive at rest (e.g., energy required for basic cellular function like ion transport and respiration)
- Thermic effect of food (TEF) – the amount of energy required to process and digest food (I also include in this category the amount of energy lost as undigested material in stool)
- Activity energy expenditure (AEE) – the amount of energy expended by exercise and non-exercise movement (I consider these as two forms of expenditure)
The sum of REE, TEF, and AEE is called, appropriately, total energy expenditure (TEE).
Of these, REE is the dominant “sink” of energy output in most people, and it is generally proportional to bodyweight. I’ll cover the importance of this momentarily.
The traditional model of obesity, the so called “calories-in-calories-out” model, says that obesity is caused by the energy input terms exceeding the energy output terms. In the words of one prominent obesity researcher, “While it is mathematically true that someone who has gained weight has consumed more energy than they have expended, using the First Law to explain why someone gains weight is of little help. The First Law is descriptive but not explanative.”
I couldn’t have said that better myself. The mistake most folks make when using the First Law to explain weight gain (versus using the First Law to describe weight gain) is that they lose sight of the fact that these variables – input, REE, TEF, AEE – are linked. They are dependent on each other. They don’t exist in isolation.
Proponents of the Alternative Hypothesis argue that intake (i.e., food) plays a role on hormones and enzymes in the body that have a resulting impact on energy output, and even subsequent input. For example, eating one food over another can increase or decrease appetite, increase or decrease REE, increase or decrease AEE, and even impact TEF. While the effect on each of these may be modest in isolation, even small changes over the course of days can result in significant changes over months or years.
What does all of this have to do with this study?
The figure below shows how the study was conducted. This was a prospective design 3-way crossover study of 21 overweight or obese subjects with an average BMI of 34.4. Each subject underwent a 20-week run-in phase, which is very common in weight-reduced studies. During the run-in phase all baseline measurements are collected, including body composition by DEXA, TEE by doubly-labeled water, substrate utilization by respiratory quotient, and plasma levels of various blood markers (e.g., lipids, blood chemistry, hormone levels). No, unfortunately, lipoprotein particles were not counted.
During the 12 week weight loss phase caloric intake was reduced until each subject lost 12.5% of their starting (stable) weight. For the final 4 weeks of the run-in phase energy intake was again calibrated to hold their now-reduced-weight stable.
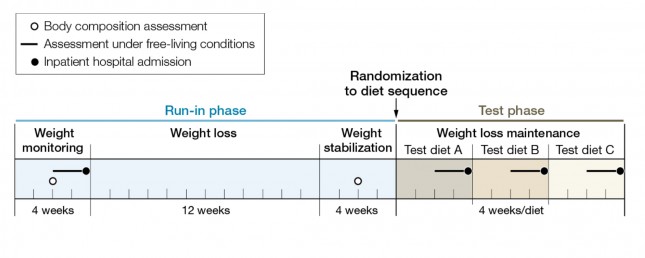
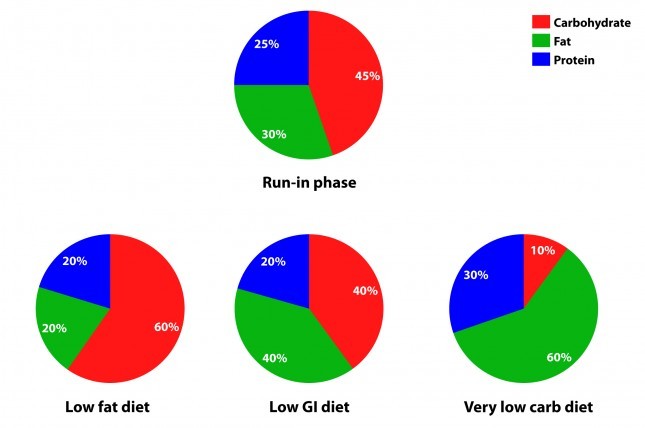
The figure below summarizes the data from Table 1 of the paper, showing the breakdown of macronutrients during the run-in phase and the subsequent 3 dietary interventions, each lasting 4 weeks. Again, each subject did each diet for 4 weeks due to the 3-way cross-over design. In other words, each subject spent a total of 32 weeks in the study (20 weeks of run-in and 3 x 4 weeks of each intervention diet).
How did the diets impact energy expenditure?
The figure below shows the change in REE and TEE measured for all groups. There was no difference in total physical activity or exercise, so presumably there was no appreciable change in AEE. I could not find a mention of TEF, suggesting it was not measured. These figures are a bit ugly, but they convey helpful information. Each dot represents an individual subject and the lines joining each dot allow you to see the change for each subject across the 3 diets. The blue box shows the mean change (middle of the box) with the 95% confidence interval above and below. The height of the box is therefore two standard deviations.
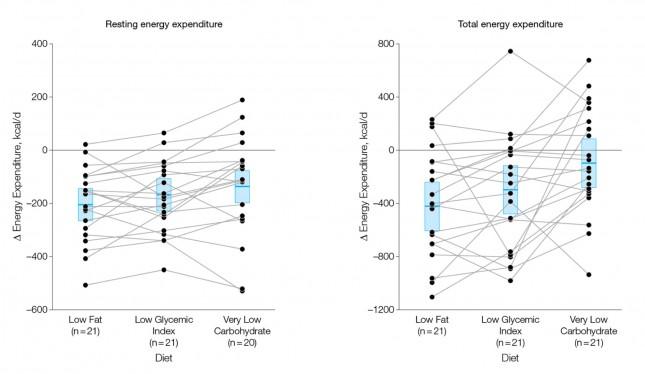
A few things stand out from these results:
- The group consuming a very low carbohydrate diet had a higher REE and TEE than the low GI group, which had a higher REE and TEE than the low fat group. In other words, the fewer carbohydrates in the diet, the higher the resting and overall expenditure. This is actually the sine qua non of the alternative hypothesis: something beyond the actual number of calories is playing a role in how the body expends energy.
- As expected, given that each subject was starting from a weight-reduced state, the REE was lower for each group, relative to their baseline. REE is highly (though clearly not entirely) dependent on body mass.
- There is enormous variation between subjects by diet type. For example, at least one subject saw a dramatic increase in TEE on the low GI diet versus the other two, while another saw the greatest TEE on the low fat diet. This speaks to a theme I iterate on this blog: be willing to self-experiment until you find what works for you.
How did the diets impact metabolic parameters?
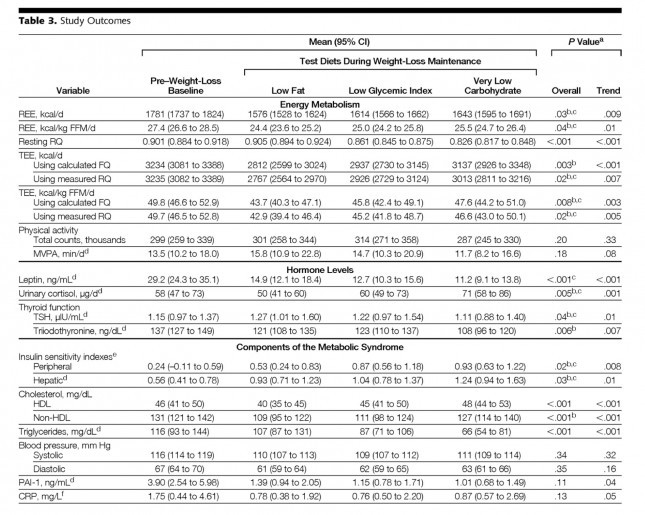
The table below shows the changes in hormone levels and metabolic syndrome biomarkers.
One thing that really jumped out at me was that it is quite likely that not one of the subjects in the study met the formal criteria for metabolic syndrome. MS requires at least 3 of the 5 parameters (blood pressure, waist girth, fasting glucose, HDL-C, and TG) exceed threshold. The thresholds are as follows:
- BP > 140/90 [No subject met this at baseline]
- Waist girth > 40 inches (men), >35 inches [Not reported, but let’s assume at least some subjects met this]
- Fasting glucose > 100 mg/dL [Not reported, but let’s assume at least some subjects met this]
- Fasting TG > 150 mg/dL [No subject met this at baseline]
- HDL-C < 40 mg/dL (men), < 50 mg/dL [No male subject met this, but it’s possible some female subjects did]
This may speak to the age of the subjects, which averaged 30.3 years, but I would have expected a worse set of baseline metabolic parameters. It also speaks to the point that just because someone is obese doesn’t mean they have metabolic syndrome and vice versa.
Tables are a bit cumbersome, so I took the liberty of graphing some of these results, mostly because I just can’t resist playing with think-cell (PowerPoint without think-cell is simply a tool for torturing people.)
I’ve explained p-values before, but let me explain the two types of p-values reported above and below.
P_overall is the p-value testing the hypothesis that the mean outcome of the three diets was equal. The smaller this value, the more likely the differences were not due to chance. As a general rule, if the p-value is greater than 0.05 we say the difference is “not significant.” Most use a more stringent requirement of 0.01 to hit the mark of statistical significance.
P_trend is the p-value testing the hypothesis that the mean outcome of the three diets showed a trend from low fat to low GI to low carbohydrate.
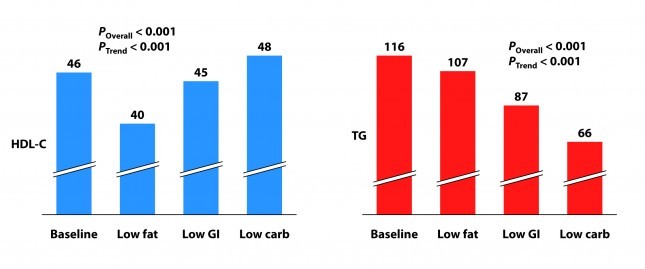
Not surprisingly, the low fat group experienced a significant reduction in HDL-C. It’s been documented many times that dietary fat raises HDL-C and dietary carbohydrates reduce HDL-C.
Each group also experienced a reduction in triglyceride (TG) level. Since we know carbohydrates, not fat, raise TG, you may wonder why this was even the case in the low fat group, which actually increased carbohydrate intake. I suspect it was a carbohydrate “quality” issue. I’m guessing the baseline levels reflect more sugar consumption than the low fat phase. Nevertheless, and again not surprisingly, the high fat-low carbohydrate group experienced the greatest improvement in plasma TG levels.
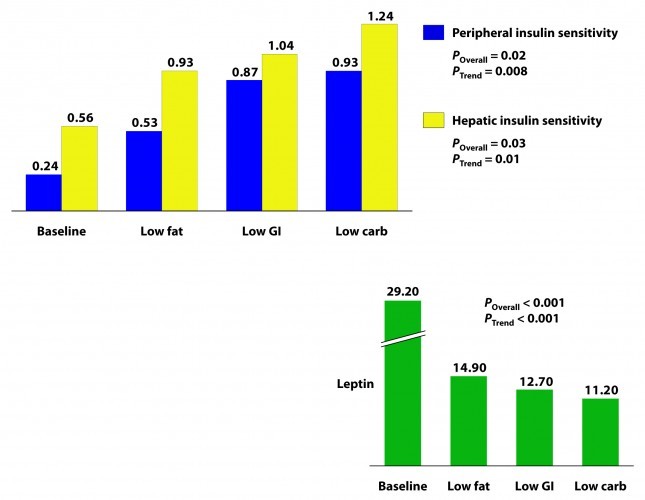
Insulin sensitivity was measured according to a protocol in this paper. The protocol uses time blood draws after an oral glucose challenge. The higher the index, the greater is the insulin sensitivity. Each diet improved both hepatic and peripheral insulin sensitivity and both the overall differences and the trends were significant.
If insulin is the most important hormone regulating fat metabolism and accumulation, leptin is certainly a close cousin. Leptin is a hormone secreted by fat cells that plays an important role in regulating appetite and some metabolic functions. High levels of circulating leptin can be suggestive of leptin resistance which, like insulin resistance, tends to be a marker for metabolic derangement. I’ll write a lot about leptin in subsequent posts. While leptin sensitivity was not directly measured as insulin sensitivity was, the significant reduction in circulating leptin levels suggested it was also improved in all groups, though greatest in the low carbohydrate group.
How did the diets impact inflammation?
Two markers for inflammation were evaluated in this study, C-reactive protein (CRP) and plasminogen activator inhibitor-1 (PAI-1). Neither is particularly sensitive in the way, say, Lp-PLA2 is (this was discussed in the cholesterol series). Nevertheless, they give us some indication of how much overall inflammation exists in the body.
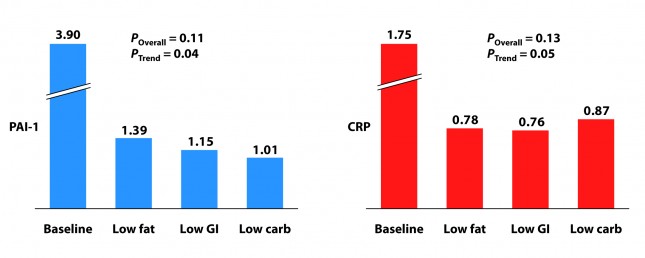
Each group experienced a significant decline in both PAI-1 and CRP, and there was no significant difference between the groups for either marker. However, the trend was (barely) significant favoring the low carbohydrate group for PAI-1 and favoring the low GI group for CRP. Sorry low fat, you didn’t win either.
I know what you’re thinking because it was the first thought that ran through my mind when I saw this table: What? Is this meaningful or is it an example of statistical chicanery? I’ll let you decide, but I’m pretty sure I know the answer.
Because I know some of you will ask, I will comment in a subsequent post on the changes seen in TSH, T3, and cortisol. These topics deserve a post of their own.
What should have been taken away from this study?
This study reproduced a number of results which have been noted for decades:
- Low carbohydrate, high fat diets reduce TG and raise HDL-C more than other diets.
- Low carbohydrate, high fat diets improve insulin sensitivity more than other diets.
It never hurts to hammer those findings home again, but the really dramatic finding of the study was the impact of macronutrient balance on REE and TEE. At previous count (circa 2011), 81 studies over the past 80 years involving 4,094 subjects for more than 1.2 million subject-days have attempted to ask this question – many of them attempting to “prove” that all calories are created equally. While none (i.e., not one) have refuted the alternative hypothesis, most of them had enough methodologic limitations that it was difficult to know for certain if the type of food – rather than the number of calories – was playing an important role.
This study, while still limited (e.g., short duration, small sample size), makes one of the more compelling cases that all calories are not created equally.
What was taken away from this study?
The embargo on this paper was lifted at 4:00 pm EDT on Tuesday, June 26, 2012. Within about 30 minutes I was being bombarded with news stories that, if you hadn’t read the study, as virtually no one actually does, would suggest that the low carbohydrate diet was the “worst” of the three diets tested. This was not universally true, in fairness to the media, but there was no shortage of this sort of commentary:
USA Today
…the authors note a downside to the low-carb diet: it appears to raise some risk factors for heart disease.
Marion Nestle, a nutrition professor at New York University, says longer studies conducted among people in their own environments, not with such controlled meals, have shown “little difference in weight loss and maintenance between one kind of diet and another.”
George Bray, an obesity researcher at Pennington Biomedical Research Center in Baton Rouge who has also studied this topic and who wrote the accompanying editorial in JAMA, says that other studies “show that you can do well on any diet as long as you stick to it. Adherence is the major key for weight loss and maintenance. There is no magic in any diet.”
The New York Times
…the low-carb diet “also had marked problems. It raised levels of CRP (c-reactive protein), which is a measure of chronic inflammation, and cortisol, a hormone that mediates stress.”
The Wall Street Journal
…the low-carb diet had the biggest boost in total energy expenditure, burning about 300 calories more per day than those on the low-fat diet — about the same as an hour of moderate exercise. But that bump came at a cost: increases in cortisol, a stress hormone, and a measure of inflammation called CRP, which can raise the risk of developing heart disease and diabetes.
Some of these comments were patently false (e.g., “the low carbohydrate diet raised levels of CRP” according to the New York Times), reflecting utter incompetence, but most of them commit a different journalistic sin: They miss the forest while machinating on one leaf.
Tragically, most people (unfortunately this includes physicians, dietitians, and politicians) have neither the time nor scientific discipline to wade through these studies and understand their implications. Instead, they rely on “reputable” journalists to translate for them.


I vote for BMJ low-carb study too!
Hello Peter
Great work!!
Where do you find the time?
When will you update your blood work numbers? Your last update was July 2011.
thanks
Paul
Responded to your earlier question.
Thank you, Thank you, Thank you.
The real take-home points are the scatter plots showing individual differences (humans are not identical bomb calorimeters), and the reluctance of conventional wisdom to consider that a low carb, high fat diet just might be good for health. And thanks for the Think-cell tip, I’ll give it a try
“…Enter NuSI…”
how about doing an overeating experiment, i.e. is it possible not to gain a significant amount of weight/fat by eating a ton of fat when there’s little or no carbs? It would be interesting to take for example a couple of Sumo wrestlers and turn their diets upside down, high fat / very low carb
We’re all over it. I like how you’re thinking.
“is it possible not to gain a significant amount of weight/fat by eating a ton of fat when there’s little or no carbs”
Why do we need to do an experiment on this? We know the answer: Yes. Absolutely. If you eat 12,000 calories a day and aren’t a Lance Armstrong, you will gain a lot of weight no matter what.
The more interesting question is: if those 12,000 calories a day were comprised of 75% fat, how many could you actually bear to eat? If you go to Dr. Eenfeldt’s site, you’ll read about the butter experiment, where a couple of people tried to eat sticks of butter with a spoon. It doesn’t seem as if anyone can actually eat more than 4 or 5 tablespoons of butter at a sitting without making themselves feel kinda bad. They just naturally seem to stop.
It’s very very very difficult to overeat fat. That’s the message, not that you can’t gain weight on it. Because of course you could. But if there’s enough fat in the diet, you’d naturally stop eating before you actually overate. And there have been studies on this, Taubes cites 1 of them in his books.
greensleeves: “It’s very very very difficult to overeat fat. That’s the message, not that you can’t gain weight on it. Because of course you could. ”
If you haven’t seen the Horizon/BBC documentary entitled “Why are thin people not fat” it’s available on Youtube and elsewhere. It’s an experiment in which young college students eat twice as much calories as before and some of them don’t get fatter. And they’re not on a ketogenic diet either. So getting fatter because one eats more energy/calories than their bodies’ energy needs, that’s not what happens 100% of the time.
The energy balance model makes two predictions: 1. creating an energy deficit will make you lose body fat, 2. creating an energy surplus will make you gain body fat. The 2nd prediction hasn’t been tested like it should have been. That’s why it would be interesting to take a group of people and make them eat a big surplus of calories within a low-carb or ketogenic diet context and see what happens.
I second the recommendation to watch this series on BBC. Very interesting and highly suggestive of the individual variations that may explain why some LC eaters eat more total calories while others do not.
I was hoping you would do a post on this! I first saw it in USA Today and then I went and read the actual study. Since then I too have seen constant media write ups twisting what the study found. I actually saw one article with the headline “Low-Carb diet may not be what the doctor ordered” and the sub-headline “Researchers discovered a low-carb diet may cause insulin resistance and cardiovascular disease”. The article then references this study! Unreal.
As someone who works in a medical lab and runs CRPs, I find the barely higher low-carb CRP results to be insignificant…still within normal range. I’ll be interested to hear what you have to say on the urine cortisol and T3 results.
They do mention TEF briefly under the COMMENT section (second paragraph down), they basically dismiss it as having little or no effect on the study.
Great post!
I did a huge self-experiment 2 weeks ago and checked my CRP level 9 times in 3 days. Guess what the standard deviation was? 28%!!! Average value was 0.76 +/- 0.21. So, yes, lab error is a huge issue with any assay. Thanks for making the point.
“So, yes, lab error is a huge issue with any assay.”
Plus, isn’t it the case that CRP, and everything else doctors measure in labs, has some natural variation over time in each individual, as physiological circumstances and demands change? So snapshot measurements provide information, but certainly not complete information, even apart from lab error.
And isn’t it also the case that while we’ve been trained to think of certain things like CRP and LDL as “bad,” in fact they are physiological and necessary? Apart from gross extremes, couldn’t a slightly higher CRP be quite healthy for a particular individual at a particular time?
As I think I’ve mentioned here, my endocrinologist has concluded after many years that he has no idea what any particular person’s thyroid lab values should be, apart from obvious extremes. For one person a TSH of 1.5 may be too high, and for another too low. Couldn’t the same be true of CRP? Perhaps the very assumption that higher CRP is necessarily “bad” is mistaken, again holding aside gross elevation reflecting chronic inflammation.
Absolutely. This is especially true in the case of hormones like cortisol, which is why urine collection is preferred (assuming urine collection is representative of plasmas/tissue levels, which it may or may not be).
A personal story for the CRP discussion….
I used to eat the same popular whole grain cereal every morning for breakfast until I started noticing that I would get this horrible bloating abdominal pain about the same time everyday around midmorning. This went on for quite some time and, after I read Mark Sisson’s book, I started to suspect the whole grain cereal as the cause. During one particularly bad episode my CRP went from a baseline of 0.69 two weeks before, up to 19.85 the day of the terrible pain, to 6.38 the day after, and then back to normal not long after. Since I quit eating the cereal and switched to eggs or smoothies for breakfast I’ve not had the pain once in four years.
My point is that what you don’t want is a drastically elevated CRP (means something acute is going on) or a chronically slightly elevated CRP like 3 or 5 mg/L, etc. (means you have chronic inflammation going on). Peter is the doctor, but to me the 0.09 difference between low-fat and low-carb diets is clinically insignificant and falls under “who cares”. We’re dealing with such small numbers, I could probably run a CRP 10 times on the same tube of blood and gets results that vary by that much. The results are still normal, indicating no inflammation, indicating no problem. Thats my take anyway.
P.S. Being a cyclist and cycling fan, I liked the Zoncolan reference. I love it when the Giro climbs it!
Thank you so much for this timely post. Best and most rigorous interpretación of the JAMA metabolic study by far. I have been telling that to anybody that would care to listen and a to a few that would not… As for my vote for future posts? Do not ask me I want both! 🙂 And I cannot wait to hear your take on thyroid hormone and cortisol… Incidentally, I was just reading this study on dietary macronutrients content and it’s effect on metabolism:
https://jcem.endojournals.org/content/92/11/4480.full
which Colpo mentions as proof that LC diets do indeed have negative effects on cortisol, and unless I am mistaken, the authors conclusion is the rather the opposite. Yes, LC diets do seem to increase cortisol, or rather counteract the dis regulation of cortisol common in obesity, but that seems to be a good thing. This is how the authors frame the study:
“IIn obesity, the metabolic clearance rate of cortisol is increased in the liver (3), secondary to enhanced inactivation by 5?- and 5?-reductases (4) and impaired regeneration of cortisol from cortisone by 11?-hydroxysteroid dehydrogenase type 1 (11?-HSD1) (5, 6). Enhanced cortisol clearance putatively leads to compensatory activation of the hypothalamic-pituitary-adrenal axis (7) to maintain normal plasma cortisol concentrations. In addition, intra-adipose cortisol generation by 11?-HSD1 is increased in obesity (6, 8, 9). However, the basis for dysregulation of cortisol metabolism in obesity is unknown.”
Well, according to the results of this study, a very low carb diet seems to counteract the effects of this regulation of cortisol|:
“These data show for the first time that chronic manipulation of dietary macronutrient composition influences glucocorticoid metabolism in humans. In obese men, an HF-LC diet increased whole-body regeneration of cortisol by 11?-HSD1 and reduced the rate of inactivation of cortisol by 5?- and 5?-reductases. As in previous studies, discrepancy between cortisol regeneration measured during dynamic testing and the more conventional index of 24-h urinary endogenous cortisol/cortisone metabolite ratios (Table 2?) reflects the confounding effects of 5?- and 5?-reductase activities on ratios of steroids excreted in urine. The increased 11?-HSD1 activity on the HF-LC vs. MF-MC diet was independent of differences in energy consumption and weight loss: the same effect was observed under fixed feeding (approximately isocaloric) conditions; and the MF-MC diet induced substantial weight loss without altering 11?-HSD1 activity. Moreover, the effect of HF-LC was already apparent after 1 wk of the diet when weight loss was minimal.”
Ok, maybe I am totally mistaken here (I am an English/ Spanish major after all) and this study is not relevant at all, but it seems to me that ther maybe much more it the cortisol story that meets the eye.
Thanks again for your blog. It is very much appreciated.
Thanks for sending over this study. Like you, I don’t find myself often persuaded by Colpo’s analyses (pleural) or interpretations.
My vote is to continue the cholesterol series. I’m teaching a class on chronic disease prevention (low carb style) in August, and want to have the most up-to-date information to share with the audience. I’m on the edge of my seat waiting for the factors that influence LDL particle number.
Again and again, simply awesome!
Great many thanks Attia for taking the trouble to educate lay people like me on these confusing issues.
I second that; the Swedes aren’t worthy of your time, given what Zoe Harcombe and Denise Minger have already said.
I’m gobsmacked that some bloggers – notably Colpo – are in denial about resting energy differentials. Whether or not this study proved it for once and for all, why wouldn’t they exist?
Surely it is the more unlikely claim to make that all calorie sources are metabolized with equal efficiency at all times.
just like all cars run with equal fuel efficiency, whether they run on diesel, petrol, or ethanol, I’m sure.
Regardless of the type of sparkplug or whether timing is by distributor or computer.
Because a calorie is a calorie, and a gallon is a gallon…
We need to know whether the low-fat diet included refined grains. It isn’t clear, and according to Don Matesz its fibre content is lower than it would be if it contained only whole grains and no refined ones.
This is very important in view of the possibility that the lower energy expenditure on this diet was due to oxidative stress in hypothalamic POMC neurons, which produce high levels of reactive oxygen species and were found recently to be damaged in obesity.
White flour has had most of its (antioxidant) manganese removed and replaced with (pro-oxidant) iron.
Absolutely fabulous summary of this article! I would just add one thought regarding the trend test and the over-hyped CRP result. The authors state that they “constructed a test for linear trend across diets, proceeding from highest to lowest glycemic load … assuming equal spacing.” It is straightforward to show that such a trend test boils down to a straight up pairwise comparison between the lowest glycemic load diet (i.e., LC) and highest glycemic load diet (i.e., LF). That is, the test does not include the LGI diet at all. This is counter to the analysis plan specified by the authors in which they said they wouldn’t even look at such pairwise comparisons unless the overall null could be rejected. It wasn’t for CRP, so this pariwise result should have never even seen the light of day. Saying this another way, the data presented in this manuscript provide NO EVIDENCE of any effect across diets on CRP.
This is a great point, Mark. I think the term “statistical chicanery” becomes that much more telling.
https://circoutcomes.ahajournals.org/content/4/3/337.long
The study above gives some ideas on the apob test –
Asked my Doctor for an NMR – he has me come see him in his office and he explains to me why my insurance (medicare and medicaid) will not pay for non-standard tests – visit was free of charge –
My Doctor is an interesting impressive guy – he rides is mountain bike up this steep – mile long hill every morning on his way to work –
So a week later – I call his office and ask for an apob test – he orders an apob and an apoa1 – they cost 34.00 each – will see if insurance pays for it –
Anyhow – I would like help convert ing the pending apob and apoa1 test numbers into particle numbers –
Dr. Davis said mulitply times 10 – the few examples I could find to look at – would suggest timing the apob mumber by 20 or even 23 to get an NMR number equivalent
I want something (a coversion method) that’s reasonably accurate – as there is a big difference between timing by 10 or timeing by 20-23 ?
Such formula are decent approximations, but not entirely accurate. If your doc is willing to check apoB and apoA-I, that’s good enough. Don’t worry about trying to convert to LDL-P.
It has been my understanding that measuring cortisol levels can be quite inaccurate and the the best method to do so is salivary, not urinary which this study did. If correct, then the cortisol results are somewhat meaningless.
Depends what you’re looking for. Multiple cheek swab measurements throughout the day (say, every 2 hours) provides much more meaningful information about variation. Urine cortisol is sort of like taking the integral of the curve.
Peter I have been monitoring my ketone level with a NOVA Blood ketone test kit. So far I have registered .2, .9, .6, and .2 tonight. this is over the course of 5 days. Is this enough to consider myself in ketosis…meaning if I continue to see numbers jumping around like this for the next few weeks.
Thank you
You’re flirting with it. You’ll ideally want to consistently be above 0.5 mM.
Hi Pierre:
Dr. Volek identifies the ketone sweet spot at 1.25 to 2.5. You can get there in just about 5 days. Try keeping your carbs to 10% and your protein to 18%. That worked for me. Jimmy Moore got to 2.5 easily by eating 12% protein and 3% carb, but he’s very insulin resistant; most folks probably don’t have to go so low.
I’m too, one of the unlucky ones… My body just refuse to go into full nutritional ketosis.
I decided to track them for few days close to 5 time a day. Check if anything I’m eating is not helping.
Even after dropping ALL dairy products and nuts, weighing my food, making sure I’m on the right ratio of macro-nutrients things are hard for me.
I checked upon waking up, an hour after eating, 2 hours after eating and during the afternoon and evening. If I eat high fat meal (as I now always do) ketone level will rise a bit – I guess an indication I’m oxidizing the fat from the meal. Unfortunately the levels will fall down almost always during the day. When I’m feeling out of energy/sluggish I already know, it’s somewhere in the 0.3 -0.4… It’s almost as if I have a blockage to burn my own body fat, and during the day it will level out somewhere in the 0.4 range.
I have some bad days and some good days, all depending on me Ketones level. Starting to really annoy me. I’m trying for 3 months now to be in a FULL nutritional ketosis, and I won’t give up until I’m there.
One day I got so frustrated, I decided to do the following – check upon wakening and my usual 2 check up in the rest of the morning – 8am, 9:30am and 10:30am. Only this time I did not eat or even had coffee. Started with 0.7 and gradually went down to 0.4. Yet again.
I am rereading Peter’s posts and comments again and again to see where is my mistakes, but can’t find it.
Any advise or support will be highly appreciated.
In looking at the media responses to this study, I’ll try to refrain from attributing their commentary to villainy, as it simply may be the result of stupidity, but sometimes you gotta wonder if there’s an agenda…
Btw, my vote is to finally say how/if a low-carb diet can lower your LDL-P. Bonus points if you give general eating advice for those with 1 APOE4 and 2 APOE4s.
We’ll get there soon. Do you mean 1 apoE2 and 1 apoE4? If so, you’re probably about the same as the “wildtype” with 2 apoE3 copies.
Hi Peter:
“Do you mean 1 apoE2 and 1 apoE4?”
No, sorry I was unclear – actually I mean 1 APOE4 (heterozygous) or a double APOE4 (homozygous). 2 people at my job recently got their gene test results back and were shocked to learn that they have the APOE4. One woman is 45 and learned she was an APOE 3/4; the supervisor is actually rather scared to learn he is 4/4.
They both now believe they are hopelessly doomed to Alzheimers no matter what they do, so naturally they do nothing. Kurt Harris would tell them to go to 85% fat; but I think the conventional wisdom is that they have to go vegan ASAP. More and more people get these tests, learn bad news and really don’t know what to do. They end up paralyzed.
If you could offer general advice for people like this, I think it would help many. Is low-carb part of the general answer or not? Ty!
All things equal, two copies of the E4 allele carries about a 20x higher risk of CVD and a higher risk of Alzheimer’s disease, though off hand I don’t know the risk multiplier. E3/E4 carries about a 5x increased risk of CVD. Again, I don’t know off hand what the risk increase is for Alzheimer’s disease. The E2/E4 is probably a wash, as the increased risk of the E4 is roughly offset by the presence of the E2 allele. Of course, the (very rare) homozygotes for E2 seems especially immune to CVD.
I do not believe that even the case of homozygosity for E4 (about 1% of the population) ensures CVD or Alzheimer’s disease. I would agree with Kurt Harris. When I work with people who are homozygous for E4 I have a very special “plan” for reducing their risk of these diseases. And, yes, low carb is a BIG part of it.
Great post doc! Anthony Colpo should read it. Not that anyone should care what he writes, but he is fond of insulting Dr. Eades and making mince meat of the issues: https://anthonycolpo.com/?p=3680. And real men allow comments on their blogs. You’ll see what I mean by that if you read his blog.
Question: You pointed out some outliers in the study – one that increased TEE on a low fat diet. You said to this “be willing to self-experiment until you find what works for you.” Are you suggesting that, for that individual outlier and thus for millions of others like him (or her), that a low fat, high carb diet is more healthful? I’m not talking likes or dislikes here. I love bagels and pizza but they turn my knees into grapefruits. I’m talking physiological health.
Again, great post!
Fred, it’s all about how you define the experiment. When I experiment with my diet — keep in mind, a few years ago I went vegan for 6 months long before experimenting with low carb — I do my best to fully define the outcomes (e.g., body composition, disease risk markers, performance, mental acuity).
Interested to know how you defined the outcome of mental acuity?
I read a few posts on Colpo’s site and he comes across as some sort of Internet tough guy/blowhard. I didn’t necessarily disagree with everything he has posted, but he seems to be cut from the Jim Rome school of journalism. It seems he has a book or two to sell and just doesn’t come off as a serious man of science to me. Especially so when you compare his posts to those of Dr. Attia or Denise Minger as an example. Denise uses humor but in the right way IMHO.
I read one of his posts a few months ago which really intrigued me. I started to write an email to him, but as I read more of his site I realized this would likely generate a nasty interaction, especially as I was writing to question his interpretation.
Dr. Attia,
I’m on my 4th week of eating <20g of carbs a day and I love it. I do have a question though.
I understand that the whole thermodynamics argument should be applied as the physical explanation or definition of how fat accumulates, and that the reason for fat accumulation is "carbohydrates are driving insulin driving fat". I understand that when our body decides to accumulate fat, we eat more BECAUSE we are accumulating fat. However, we still have the ability to feed ourselves more than our body might need, just as we have the ability to (at least try) starve ourselves regardless of what our body is asking of us.
So if I'm eating barely any carbs (<20g), and very little protein (<150g) and I eat as much fat as I can possibly eat without getting sick, and then I sit on the couch all day, regardless of how much energy I feel like I have, what happens to the fat? Will it be store? Is there another fat regulator in our body in the absence of insulin? Or at a certain point will enough fat even cause high levels of insulin to be secreted and therefore store it. This is obviously a exaggeration. It may have been easier to just ask, "Can/do you still store fat on a ketogenic diet and how would this process work?"
If you are in ketosis, but still consuming more energy than your body can dispose of through the 3 (or 4) means by which we dispose of energy you will gain weight! At some point — and it will differ for different people — your body will not be able to “dispose” of the extra energy (albeit from fat intake, not protein or carb) through increased REE or TEF. At this point, you will start to accumulate fat.
Differential weightgain on isocaloric diets with identical macronutrient ratios:
https://www.ncbi.nlm.nih.gov/pubmed/22593546
FASEB J. 2012 May 25. [Epub ahead of print]
Timed high-fat diet resets circadian metabolism and prevents obesity.
Sherman H, Genzer Y, Cohen R, Chapnik N, Madar Z, Froy O.
Although timed HF-diet-fed mice consumed the same amount of calories as ad libitum low-fat diet-fed mice, they showed 12% reduced body weight, 21% reduced cholesterol levels, and 1.4-fold increased insulin sensitivity. Compared with the HF diet ad libitum, the timed HF diet led to 18% lower body weight, 30% decreased cholesterol levels, 10% reduced TNF-alpha levels, and 3.7-fold improved insulin sensitivity. Timed HF-diet-fed mice exhibited a better satiated and less stressed phenotype of 25% lower ghrelin and 53% lower corticosterone levels compared with mice fed the timed low-fat diet.
A 12% advantage over low-fat mice and an 18% advantage over ad lib high-fat mice…
See page 1352 here:
https://groups.molbiosci.northwestern.edu/bass/publications/Bass.Science.Dec2010_PRINT.pdf