
This video clip is from episode #176 – AMA #27: The importance of muscle mass, strength, and cardiorespiratory fitness for longevity, originally released on September 20, 2021.
If you’re a subscriber, you can listen to this full episode on your private RSS feed or on our website at the AMA #27 show notes page. If you are not a subscriber, you can learn more about the subscriber benefits here.
Show Notes
Changing mortality risk based on VO2 max and cardiorespiratory fitness [7:45]
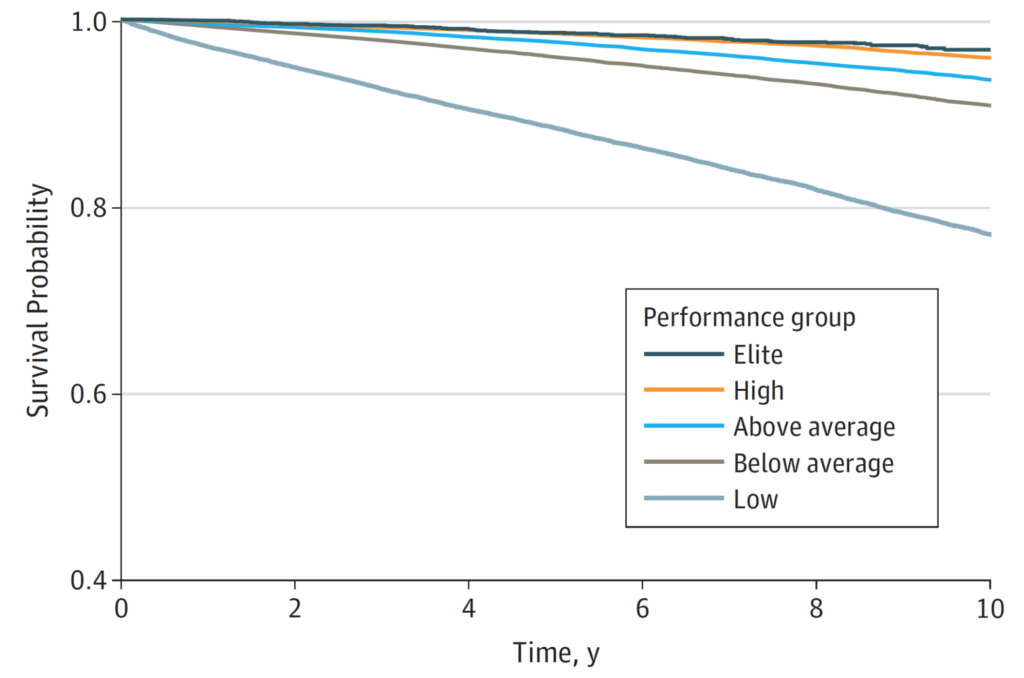
Figure 1. Patient survival by performance group. (Mandsager et al., 2018)
Overview of the experiment:
- A group of people that were 53 years old on average
- Ran them through a VO2 max test and then it ranked them
- Low were people who scored in the bottom 25th percentile
- Below average was the 25th to 50 percentile
- 50 to 75th percentile was above average
- High was 75th to maybe 95th
- Elite was just that top 5%.
- NOTE: Each of these levels do NOT represents 20% of the population
- A total of 122,000 patients
- The low, below average, above average, and high have about 30,000 participants in each one of those groups
- And then the elite group has a little over 3,500
Results:
- Looking at all-cause mortality there’s a pretty clear trend
- The two things that stand out are,
- i) there’s kind of a monotonic relationship between fitness and mortality
- ii) By far the biggest gap is between the people in the bottom 25%. Which are categorized as low fitness, and basically everyone above them.
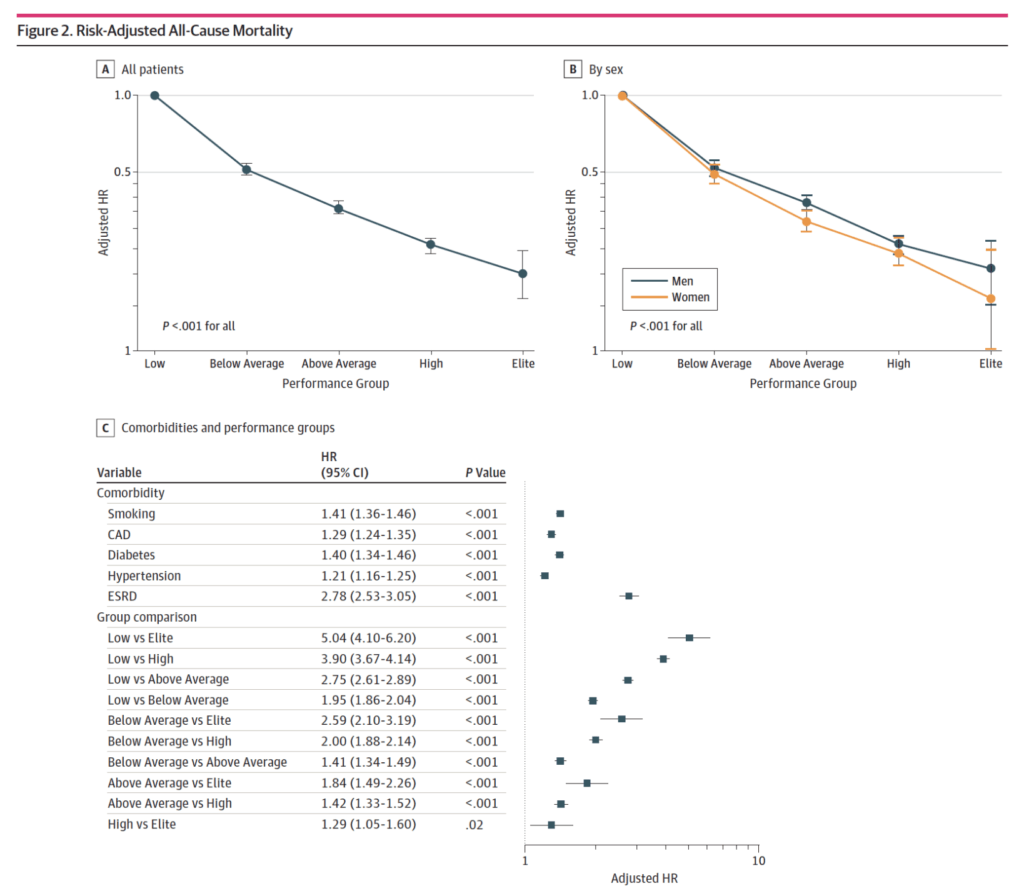
Figure 2. Risk-adjusted all-cause mortality. (Mandsager et al., 2018).
When sort of lumping everyone in together, male and female, if you have low fitness and then comparing it to everybody else, what’s the risk reduction?
If you go from low to below average, to above average, to high to elite, you can see what is the hazard ratio
Important stats
- Going from just being low to being below average is a 50% reduction in mortality over a decade
- If you then go from low to above average, it’s about a 60% or 70% reduction in mortality
- Then it just continues monotonically to increase
- The lowest improvement is going from high to elite—”That doesn’t buy you a whole heck of a lot. It is still statistically significant.”
- To see that you have to look at Table C
- remember, the hazard ratio for mortality is the reciprocal of the hazard ratio of risk reduction
- Tables A and C are basically showing you similar things in the group comparison
Here’s what’s interesting…
- If you compare someone of low fitness to elite, it is a five fold difference in mortality over a decade
- They put this in the context of other things that we commonly understand as being problematic for mortality… Namely, smoking, coronary artery disease, Type 2 diabetes, hypertension, and end-stage renal disease
- That’s a 41% increase in mortality over the decade
- Coronary artery disease, 29%.
- Diabetes, 40%.
- High blood pressure, 21%.
- End-stage renal disease, about 180% increase in mortality
- But now when you compare that to the differences in these fitness levels, it gives you a greater appreciation for how much improvement in mortality comes from improving your fitness
- If you look at the biggest driver of mortality, which would be end-stage renal disease in this cohort, it’s the same as going from low cardiorespiratory fitness to above average cardiorespiratory fitness
- So going from the bottom 25th percentile to being in the 50th to 75th percentile… “which is a totally achievable feat”
Female athlete with mask running on treadmill to analyze her fitness performance. Runner testing her performance in sports science lab.