
This week an article titled Primary Prevention of Cardiovascular Disease with a Mediterranean Diet was featured in the New England Journal of Medicine. The study received a considerable amount of attention, including an article in the NY Times.
Study design
The objective of this study, as its name suggests, was to study the impact of a Mediterranean Diet on the primary prevention of CVD. Primary prevention of X implies looking at patients (ideally those susceptible to X) who have not yet had X to see if your intervention prevents X. Such trials are more difficult (i.e., larger and more expensive) than secondary prevention trials because in secondary prevention trials you start with patients who have already had X and are therefore at much greater risk of having X again.
Let’s use a relevant example. A primary prevention trial for CVD would study subjects who have never had a heart attack or stroke, and look for which treatment (e.g., a drug like a statin) reduces the number of such events (sometimes called MACE – Major Adverse Cardiac Events). A secondary prevention trial would study subjects who have already suffered some MACE and look at interventions to prevent a recurrence.
This study, a primary prevention trial, enrolled about 7,500 patients who were at high risk for CVD, but who had not suffered any MACE, and randomized them to one of three diets – two variants of a Mediterranean Diet, and a low fat diet. Table 1 shows the dietary targets. The two variants of the Mediterranean Diet were (i) one that emphasized extra virgin olive oil (EVOO) and (ii) another that emphasized nuts.
(As an aside, my 40th birthday is coming up soon and my wife suggested to my daughter that they make me a cake for my birthday. My daughter – who loves cake, of course – objected immediately by saying, “Mommy, we can’t do that…Daddy hates sugar!” A few minutes later she came back to my wife and said, “Mommy, wait, I have a great idea…we can make Daddy a nut cake!” Those of you who read this post may recall the last point I made. Suffice it to say, if I were in this study, I would have done really well on the nuts arm, though I think I eat closer to 5 or 6x the amount they were recommended per day.)
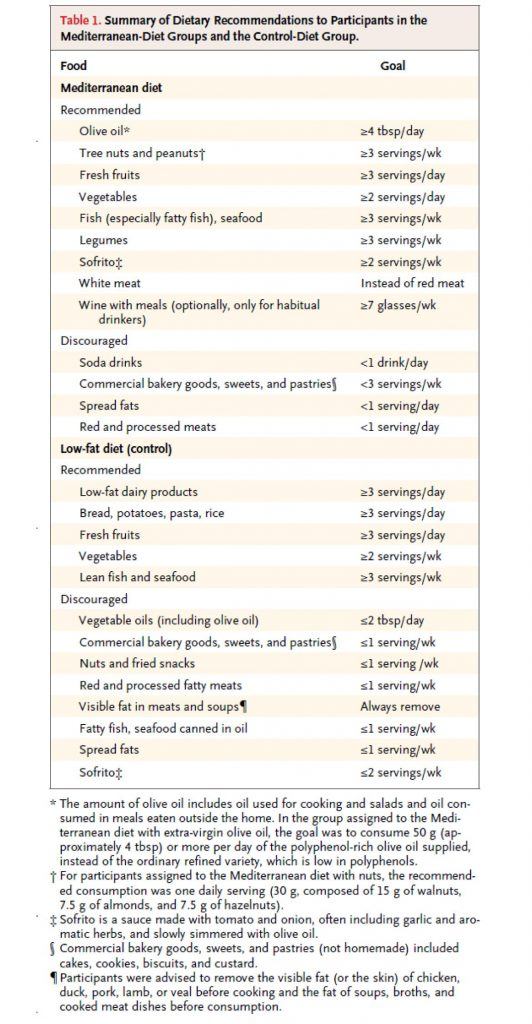
As you can see all three arms were discouraged from consuming bakery goods, sweets, pastries, red meat, processed meats, and spread fats. The authors report compliance data, but not biomarkers (if I wasn’t so short on time, I’d go back and read the other publications of this study which likely show biomarkers – e.g., insulin, glucose, HDL-C, and triglycerides – which are pretty good for confirming compliance, especially HDL-C).
So, macro point #1 is this:
Everyone in this study, almost by necessity, was consuming a very healthy diet relative to their baseline diet (if you believe most folks were on a “standard” diet, or worse yet, a poor diet, prior to enrollment, which I do). I’ll come back to this point later, but it’s worth remembering this as you read on.
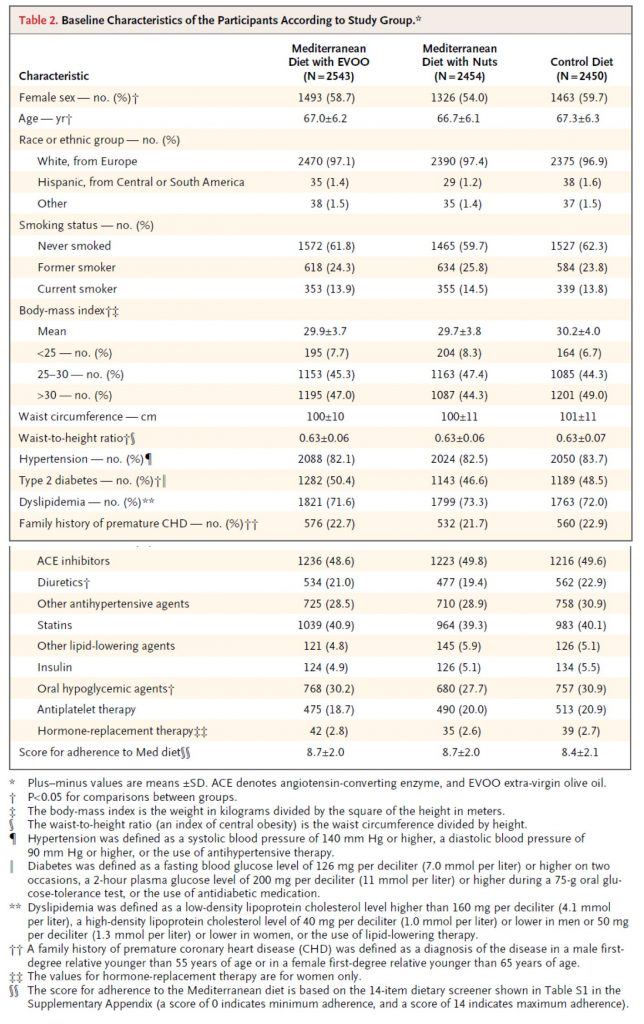
Table 2, below, shows you the baseline characteristics of the subjects in each arm. I must admit, before I saw the results of trial, but knew it was going on, I was a bit surprised at how audacious the investigators were. Primary prevention trials are really challenging! However, as soon as I read the inclusion criteria and saw this table I realized this wasn’t really a garden variety primary prevention trial, per se. Why do I say that? Less than 10% of the subjects were of normal weight. Less than 20% did not have high blood pressure. 50% had type 2 diabetes. Less than 30% had normal lipid profiles (presumably defined by LDL-C and HDL-C cutoffs). Over 40% were taking statins. You get the point. Virtually everyone enrolled in this study had metabolic syndrome.
This is not a criticism of the study, to be clear. It’s merely a statement of why this study, I believe (and hopefully will make a case for), showed a treatment effect in the setting of primary prevention with a dietary intervention. In fact, this is exactly what the authors sought in the enrollment. They specifically looked for high risk patients who had not yet suffered a MACE. In my humble opinion, this was a very good choice for two reasons:
- If they selected healthy subjects, they would have needed 5-10x the number of subjects, and
- This patient population is in desperate need of dietary intervention.
So, my only minor critique of this is the semantics of calling this a primary prevention trial. It would be more accurate to call it a primary prevention trial of patients with diagnosed metabolic syndrome.
One thing I always look for in dietary trials (and trust by now you’re also looking for) is something called performance bias, which is very common in dietary intervention trials. In fact, you’ll recall it was the main flaw of the meta-analysis I wrote about a while ago. The authors of this particular study (you can read about this in the methods section) did a good job avoiding this.
This brings me to macro point #2. This study would have been better if the “control” arm (in this study, the low fat arm), was actually a true control relative to the “standard” patient diet. For example, this might look like the following 3 arms: standard fare diet vs. low-fat diet vs. Mediterranean diet (pick one of the 2 from this study). The drawback of this approach is that patients in the “standard fare” would almost certainly have a performance bias working against them. The other two groups would have a sizable intervention effect, while this (true) control arm would be left on their own.
The final point I want to make is more of a so-called teaching point. Broadly speaking, there are two (and an emerging third) types of studies in human nutrition:
- Efficacy studies – studies that elucidate (under the strictest most controlled conditions ever used to study humans) the mechanism of action of food. In other words, these studies ask, “How does factor X or factor Y actually work at the mechanistic level in the body?”
- Effectiveness studies – studies that elucidate to what extent free-living people will adhere to a dietary change, and determine the long-term safety and effectiveness of that change. In other words, these studies ask, “Does this dietary intervention work over time, and what are the risks and benefits?”
- Econometric studies – studies that elucidate (under free-living conditions) how to change people’s behavior, by changing the defaults, the economic forces, and the cues. In other words, these studies ask, “How do we induce people to change behavior – to eat healthy — once the science provides definitive answers about what that behavior should be?”
Obviously, this study is in the second category, as virtually all “diet studies” are. I mention this for the reason that while it’s tempting to speculate on a mechanism of action in this study, there was not a single design element in this study to elucidate such things. So, at best, we are really looking at the difference between two dietary interventions.
What happened in this study?
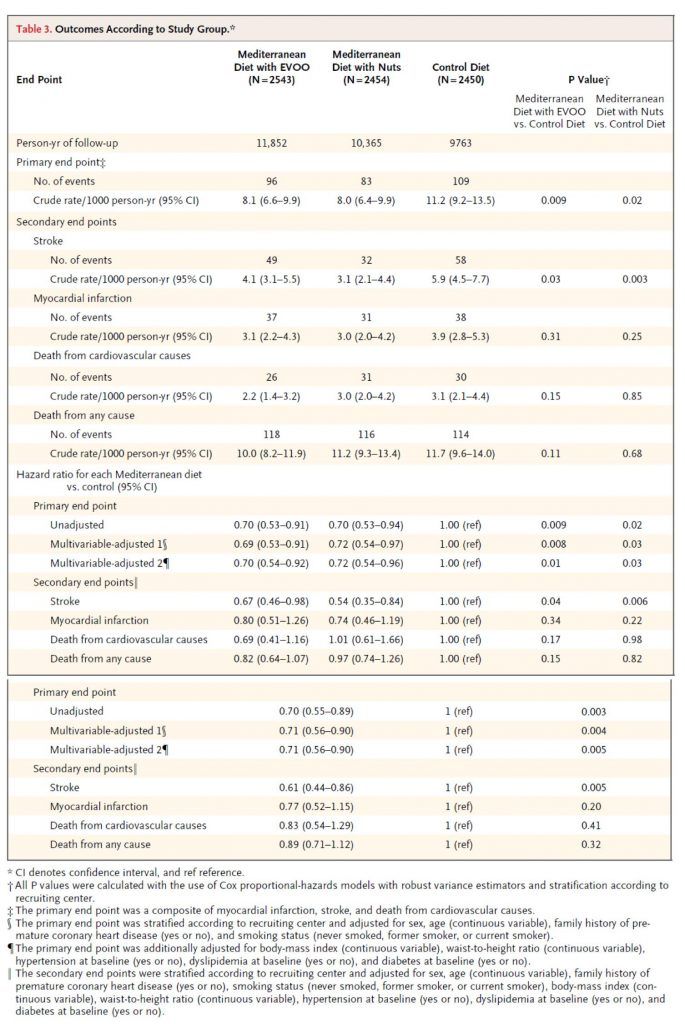
Table 3 shows the outcome of the study and commensurate hazard ratios. I won’t walk you through this table in its entirety, but I’ll show you how to read one row of each.
Consider the first row, the primary end point (recall: this was defined as a composite of myocardial infarction (MI, “heart attack”), stroke, and death from cardiovascular cause). The first row shows the number of crude events. Of course, to see this in an apples-to-apples fashion the number needs to be normalized to a common denominator, in this case events per 1,000 person-years. So, the row that’s particularly important is the one that shows 8.1, 8.0, and 11.2 per 1,000 person-years. (Note, one uses person-years to also normalize for and remove any impact of time in study.) Next to each number I’ve listed above are two numbers in parentheses. These are the 95% confidence intervals. So, even though the first is listed as 8.1, you can be “95% sure” the actual number is between 6.6 and 9.9.
How can you tell if this is “statistically significant?” Most of us don’t possess the ability to do this in our heads. So, the authors do it for us in the last two columns. The right-most column compares the control (low-fat) to the Med Diet (nuts), while the column to the left of that compares the control group to the Med Diet (EVOO). The number shown, called a p-value, is defined as the probability the difference you’re seeing is due to chance. The smaller the better, and generally a number below 0.05 is considered to earn the moniker “statistically significant.” (Not to be confused with “clinically significant,” which I’ll discuss below).
Before we go back to the other endpoints, let me comment quickly on the hazard ratio for this endpoint. A hazard ratio is essentially the probability of an event in the treatment group divided by the probability the same event occurs in the control group (hence, control groups have a hazard ratio of 1.0).
So, the hazard ratio of 0.70 means there was relative risk reduction of 30% for the Med Diet relative to the control diet. This should not be confused with absolute risk reduction, which I’ll get to shortly. For the sake of time and space, I will not go into the details of unadjusted and multivariate adjusted analyses.
But there was no difference in MI or death?
As you can see from Table 3, there was no statistically significant difference in death (CVD or otherwise) or MI across the three groups. It’s very tempting to make the following mistake:
“Hey, none of this matters, because you won’t live longer.”
Remember that pesky little statistical thing called power. This study was powered (at 80%) to detect a difference in the primary outcome, which it showed. In fact, the intention-to-treat was greater than 7,500 because the authors expected no more than a 20% relative risk reduction. But they saw a 30% difference, and the study was halted early.
So, we don’t actually know which of the following statements is correct:
- This dietary intervention does not result in a difference in MI or death; or
- It does, but this study was not large or long enough to detect it.
Very important distinction. I can’t emphasize this enough.
Back to absolute versus relative risk
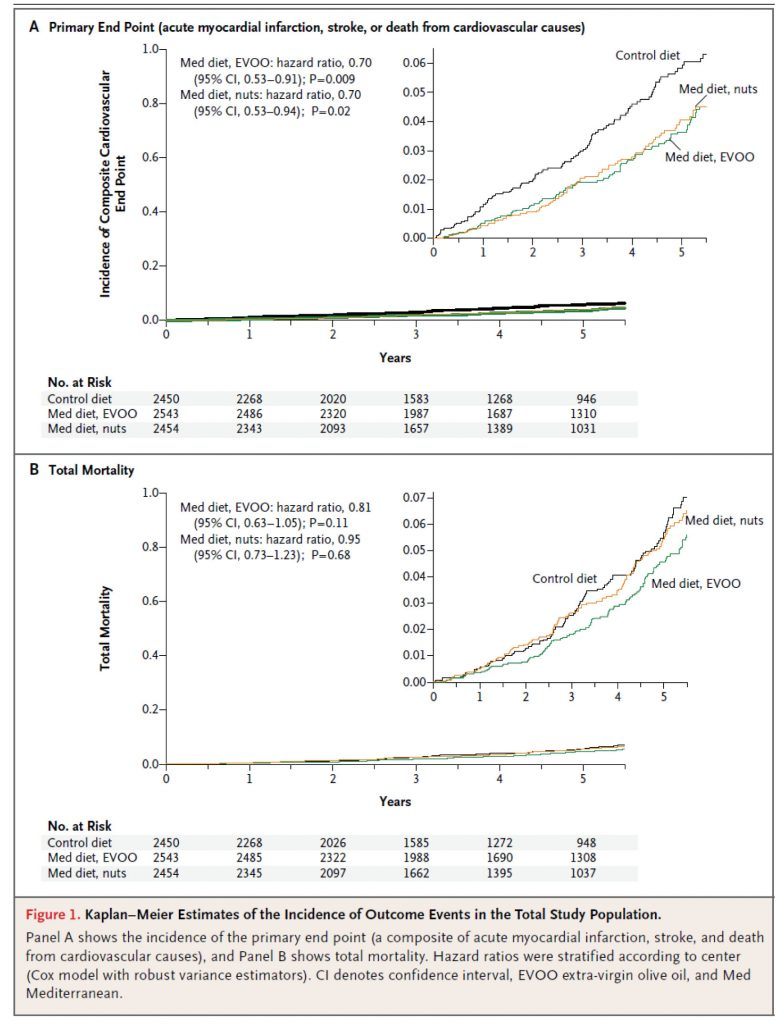
Figure 1, below, shows the Kaplan-Meier estimates for the primary end point (A) and total mortality (B). Each figure shows both the full y-axis (which always varies from 0 to 1) and, in the upper right corner, a zoomed view to show the difference. The fact that the zoom view is necessary tells you something about the absolute risk reduction. It’s small.
Here’s a quick calculator to determine the absolute risk reduction (ARR). When you plug the numbers in from this study (I’ll just do it for the low-fat vs. EVOO group), you’ll see the ARR is 0.3065%. The reciprocal of this number is 1/0.003065 = 326. This is called the number needed to treat (NNT). This means that 326 people would need to undergo this dietary intervention for about 4 or 5 years to prevent one “count” of the primary outcome.
Is this important? Or, to be more specific, is this “clinically significant” as I asked earlier? Well, it depends on the intervention. If this study were testing a drug with a 1% major toxicity rate, the answer would be emphatically, no. Obviously, we could not justify treating 326 people to save 1, if 3.26 people (on average) will experience a major toxicity!
Conversely, if this study were testing a drug with a 1% minor toxicity rate (e.g., headache) and a 0.001% major toxicity rate (e.g., kidney failure), the answer is not so clear. For perspective, most drugs fall into this second category (e.g., statins, aspirin).
I could go through the exact same argument using Quality-Adjusted Life Year (QALY) instead of toxicity. While this approach is not used in the United States (perhaps it should be), it is certainly the cornerstone of other healthcare systems, such as the NHS in the United Kingdom.
While it’s beyond the scope of what I wanted to write about today, the key to sorting through this grey zone is better defining patient susceptibility and outcomes in large clinical trials. For example, I would argue that the data on statins could be much better if the treatment target was LDL-P or apoB instead of LDL-C, especially in high risk patients with metabolic syndrome, at least half of whom have discordant LDL-P and LDL-C.
So, what to make of the modest ARR in this study? Well, question 1 should be: what is the toxicity of a Mediterranean Diet? Question 2 should be: what is the QALY impact of a Mediterranean Diet?
I can’t really answer either of these questions. The former is objective but has not been quantified to my knowledge. The latter is subjective, and each person needs to answer it for themselves.
My conclusions
Overall, I think this is a good study, and a better study than the study prompting it, the famous Lyon Heart Study. That said, I would have much preferred to see only one Mediterranean arm (in retrospect this is obvious, of course, given the lack of difference between them), in favor of a true control or another arm such as Very Low Carb.
It’s impossible to guess what the ARR would have been for the Med Diet if the control was a standard fare diet (complete with 138 gm per day of sugar!), rather than a much improved low fat diet. If I had to guess, I’d ballpark the ARR at 1-5%, for a NNT of 20 to 100 people, but this is nothing more than speculation. Remember, I think the Low Fat arm in this study experienced an enormous benefit over their baseline.
In the coming months and years, as NuSI begins funding remarkable clinical trials, we’ll have plenty more to discuss…
Photo by Carlos Santiago on Unsplash


125 Comments