
I’m often asked how I keep up with a deluge of information on a relatively wide variety of fields in medicine. One thing I do is skim the headlines of the latest news on a particular topic sent to my email from ScienceDaily, a press-release aggregator. One of those topics I’m always scanning for is Alzheimer’s disease (AD).
As a rough estimate, of the 20 headlines that wind up in my inbox every week, I click on three of them. Of these 150 stories per year, I open and skim the related-study on approximately 25 occasions. Most of the studies I open are observational studies. This may come as a surprise given how much of an emphasis I put on the importance of randomized trials and how limited observational studies are. But the unfortunate reality is that there is a dearth of positive AD trials on treatment or prevention and these are the ones most often reported (which is also unfortunate).
Of the observational studies I open, the first thing I do is look at the strength of the association. If it’s less than 2, I ditch it (with very rare exceptions). Most studies meet this ditchable (i.e., < 2) criteria.
The paper I’m about to discuss is one of the few exceptions where I spend a little more time looking at it. “Living near major roads linked to risk of dementia, Parkinson’s, Alzheimer’s and MS” is the headline from ScienceDaily. The story reported that for non-Alzheimer’s dementia and Parkinson’s disease (PD), living near major roads or a highway was associated with a 14% and 7% risk of these conditions, respectively.
Now, you may be asking, why would I spend more time on this paper if the strength of these associations were way less than 2? Represented as hazard ratios, the aforementioned associations were 1.14 and 1.07, respectively.1After looking at the study, it turns out that the associated 1.07 (7%) increase in PD risk was not statistically significant since the confidence interval crossed 1 (95% CI, 0.96-1.18).
A couple of reasons. First, it was curious that the press release didn’t report the associated risk in 2 of the 4 outcomes from the headline (AD and MS). Second, when I was looking for the associations in the release, I read they estimated exposures to not only road proximity, but to air pollution, noise, and “greenness” as well. Together, this led me to believe there is a serious problem with the reported results from this study, beyond the usual suspects (e.g., small associations, confounding variables, information bias). It’s called the multiplicity problem. This is also referred to as the multiple-testing or multiple-comparisons problem.
When a study reports results of multiple outcomes and multiple exposures, it increases the probability that at least some of those results may be statistically significant even though there is no underlying effect. (An analogy may help. If you have one chance to flip a fair coin, you have a 50% of it landing on heads. If you get 2 chances to flip the coin, the probability rises to 75%. If you get 3 flips, it’s up to 87.5%. For N flips, it’s 1-(0.5)^N, which gets awfully close to 100% very fast!) The press release mentioned at least 5 exposures (major roadway, highway, air pollution, noise, and greenness) and 4 outcomes (non-AD dementia, PD, AD, and MS). I wanted to see how many different associations the investigators reported. If they did report many associations, I wanted to know if they addressed the issue.
In other words, I spent some time going over this study, not because it seemed promising, but instead because it seemed like a great case study in everything that is wrong with this type of low-bar, hype-generating, misleading junk science. So if you’re willing to stick with me on this thread I hope to save you a lot of time in the future by giving you more confidence to ignore this type of noise which, sadly, makes up a large share of science reporting and headline-grabbing.
How many different associations were reported in the study?
One of the tables from the paper (below) provides all of the associations between exposures and outcomes.
Table. Reported associations from Yuchi et al., 2020.
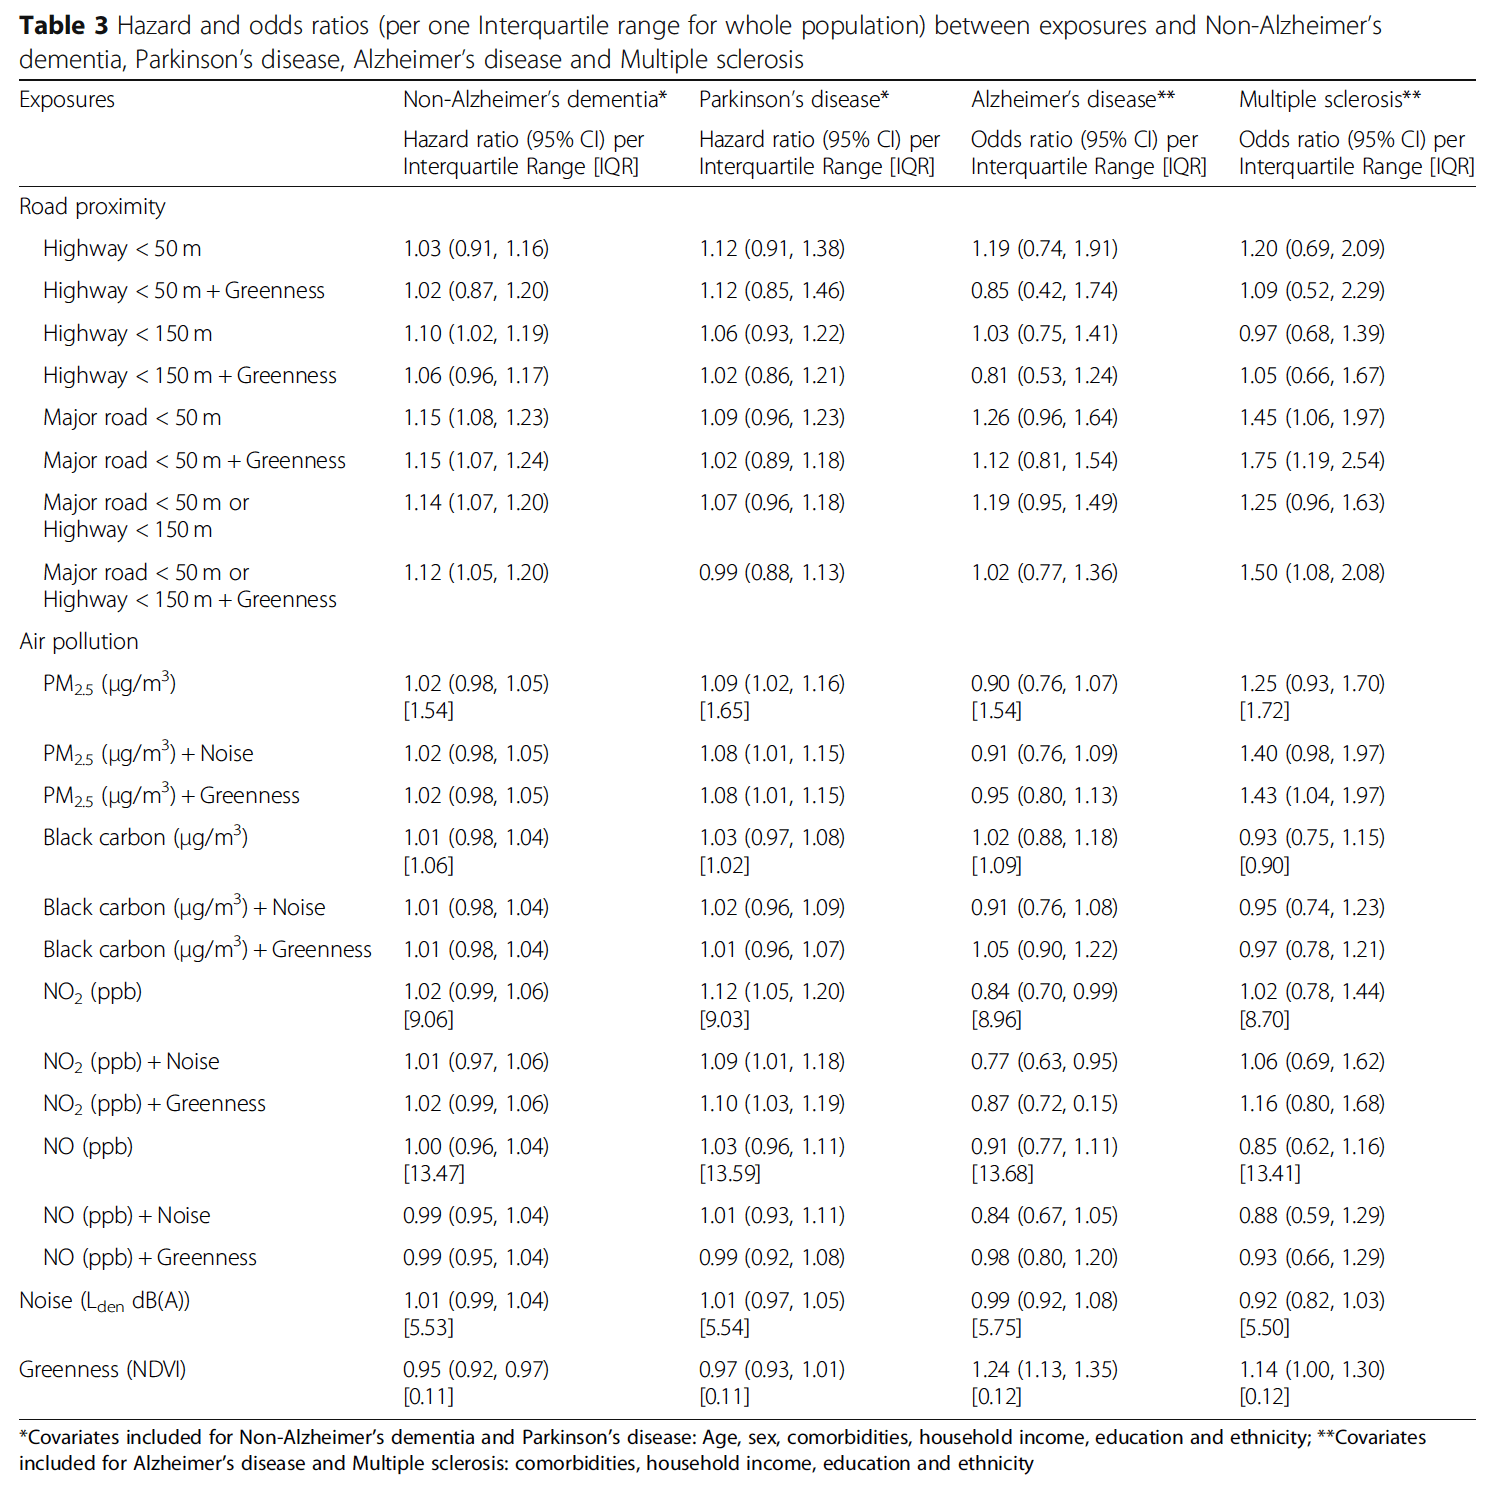
In total, they reported 88 different associations. How big of a problem is it when there are 88 tests? This requires a brief explanation and a little bit of math. (If you read and digested Part V of our series on studying studies, this should be familiar to you. If anything below is unclear, please give the first section of it a read.)
Prior to a study, investigators select a significance level, also referred to as alpha, or α, where α is the probability of a false positive (i.e., detecting something that isn’t really there). The most common level set is 0.05, or 5%. This is also referred to as the p-value. If the p-value is less than 0.05, the results are deemed “statistically significant,” a term you are no doubt familiar with. When investigators select a 5% significance level, they’re accepting anything less than a 5% risk of concluding that a difference exists when there is no actual difference. The flipside of the significance level is called the confidence level. It’s 1 – α, so if the significance level is 0.05, the corresponding confidence level is 0.95 or 95%.
In science, the default position in an experiment is that there is no relationship between an exposure and an outcome. This is called the null hypothesis. What if the experiment tested two hypotheses at the same time? And what if they test each hypothesis separately, each with an α of 0.05? The probability that one of our two tests is a false positive rises from 5% (if we only ran one test at an α of 0.05) to ~10%.2= 1 – (1 – 0.05)^2
= 1 – 0.9025
= 0.0975
Here’s how this was calculated. If “N” represents the number of independent tests examined for statistical significance, and all of the individual null hypotheses are in fact true (i.e., no relationship), the probability of at least one false positive is equal to 1 – (1 – α)^N.
In the study we’re discussing, they are, in effect, testing 88 null hypotheses simultaneously. In this case, the probability that one of those tests turns out to be a false positive rises to ~99%.3= 1 – (1 – 0.05)^88
= 1 – 0.01096
= 0.989
Did they address the multiplicity problem?
A common way of dealing with the issue of multiple testing is adjusting the α in some way to account for the number of tests being run on the data. One way to do this is by using the “Bonferroni correction.” It is simply α/N. Divide 0.05 by 88 and the new α, or p-value, is 0.0006. In other words, you raise the bar on what you deem to be statistically significant to account for the number of shots on goal you get.
If we were to plug in this new α into the previous calculation to quantify the false positive rate for multiple testing, now the probability that one of our 88 tests is a false positive drops back down to ~5%.4= 1 – (1 – 0.0006)^88
= 1 – 0.9486
= 0.0514
If the investigators set an α of 0.0006, would any of the results still be statistically significant? The paper did not provide any p-values of the associations, so we can’t simply look at them and see if any of them fell below 0.0006. The only way to determine they set an α of 0.05 in the paper is by looking at the table and finding they used a 95% confidence interval. This also suggests the investigators did nothing to address the issue of multiplicity from a statistical perspective. They also did not discuss the multiplicity problem anywhere in the paper.
§
Often in observational studies, the goal is to rank or identify associations for further pursuit. Look at all of the available data and run a lot of different tests on it to see if there’s something that really stands out. You might say that this is hypotheses-generating, which may sound redundant since it is often said that observational studies generate hypotheses. (Although I think it’s the other way around: the investigators were testing the hypothesis that increased exposure to roads, air pollution, ‘non-greenness,’ and noise increased the risk of neurological diseases. In this study, the hypotheses generated the observational study to test them, but the tests, and results, are so weak that it appears as though no such tests occurred.)
Is it fair to hold a study like this one to the standard of real science? Some may argue it’s too stringent and the chances of a false negative are very high. (For any test, there is usually a tradeoff between avoiding false positives and false negatives.) However, you have to remember that a study like this includes a large number of confounding variables that can’t be fully adjusted for. In fact, they were unable to account for physical activity and smoking. Also bear in mind the small reported associations and the even smaller associated absolute risks. There was also information bias (e.g., no physician diagnosis of the neurological diseases) and additional limitations disclosed in the discussion section. Now, add on top of this the high risk of false positives. This should only make you even more skeptical of the results highlighted by the press release and the investigators.
Multiplicity is a problem. Investigators are gathering more and more data and so too are the number of analyses conducted on them. This creates a massive potential for false positives. Just one more thing to be mindful of when evaluating the results of studies like this.
– Peter


Your review of multiple comparisons could serve as a primer for quant analysts doing statistical arbitrage….in fact limiting degrees of freedom and avoiding “hallucinating” that one has found an anolomy when building a financial model is a common problem (for hedge funds). If I recall a tool called the bonferroni test could be used to mitigate this risk.
Wonderful article. One peccadillo: I think using the 2-tailed 95% CI is equivalent to using a p-value or alpha of 0.025, not 0.05. Because the p is usually applied only to the one tail of interest. (I am occasionally wrong about things.)
The causation might even be the other way round. If somebody has a neurological disease, whether diagnosed or not, then their income may be low, which increases the chance that they will live in a less-desirable area near a busy road.
There’s somewhat of an inconsistency here. The multiplicity problem exists in science as a whole. With 5% p-values, 1 in every 20 tests where the null hypothesis is true will be a false positive. The same multiple testing problem occurs both within a single paper and across papers.
And yet, if the same authors were to publish 88 papers, one for each test, we wouldn’t see it as a multiplicity problem, but once they are all packed into the same paper we do?
Perhaps the distinction is that in this paper all 88 tests support a similar conclusion, but I think we should be just as cautious when considering papers in general and require further evidence for any single positive result found in the literature.
Nice information.