
Want to catch up with other articles from this series?
- The straight dope on cholesterol – Part I
- The straight dope on cholesterol – Part II
- The straight dope on cholesterol – Part III
- The straight dope on cholesterol – Part IV
- The straight dope on cholesterol – Part V
- The straight dope on cholesterol – Part VI
- The straight dope on cholesterol – Part VII
- The straight dope on cholesterol – Part VIII
- The straight dope on cholesterol – Part IX
Previously, across 8 parts of this series we’ve laid the groundwork to ask perhaps the most important question of all:
What should you eat to have the greatest chance of delaying the arrival of cardiovascular disease?
Before we get there, since this series has been longer and more detailed than any of us may have wanted, it is probably worth reviewing the summary points from the previous posts in this series (or you can just skip this and jump to the meat of this post).
What we’ve learned so far
- Cholesterol is “just” another fancy organic molecule in our body but with an interesting distinction: we eat it, we make it, we store it, and we excrete it – all in different amounts.
- The pool of cholesterol in our body is essential for life. No cholesterol = no life.
- Cholesterol exists in 2 forms – unesterified or “free” (UC) and esterified (CE) – and the form determines if we can absorb it or not, or store it or not (among other things).
- Much of the cholesterol we eat is in the form of CE. It is not absorbed and is excreted by our gut (i.e., leaves our body in stool). The reason this occurs is that CE not only has to be de-esterified, but it competes for absorption with the vastly larger amounts of UC supplied by the biliary route.
- Re-absorption of the cholesterol we synthesize in our body (i.e., endogenous produced cholesterol) is the dominant source of the cholesterol in our body. That is, most of the cholesterol in our body was made by our body.
- The process of regulating cholesterol is very complex and multifaceted with multiple layers of control. I’ve only touched on the absorption side, but the synthesis side is also complex and highly regulated. You will discover that synthesis and absorption are very interrelated.
- Eating cholesterol has very little impact on the cholesterol levels in your body. This is a fact, not my opinion. Anyone who tells you different is, at best, ignorant of this topic. At worst, they are a deliberate charlatan. Years ago the Canadian Guidelines removed the limitation of dietary cholesterol. The rest of the world, especially the United States, needs to catch up. To see an important reference on this topic, please look here.
- Cholesterol and triglycerides are not soluble in plasma (i.e., they can’t dissolve in water) and are therefore said to be hydrophobic.
- To be carried anywhere in our body, say from your liver to your coronary artery, they need to be carried by a special protein-wrapped transport vessel called a lipoprotein.
- As these “ships” called lipoproteins leave the liver they undergo a process of maturation where they shed much of their triglyceride “cargo” in the form of free fatty acid, and doing so makes them smaller and richer in cholesterol.
- Special proteins, apoproteins, play an important role in moving lipoproteins around the body and facilitating their interactions with other cells. The most important of these are the apoB class, residing on VLDL, IDL, and LDL particles, and the apoA-I class, residing for the most part on the HDL particles.
- Cholesterol transport in plasma occurs in both directions, from the liver and small intestine towards the periphery and back to the liver and small intestine (the “gut”).
- The major function of the apoB-containing particles is to traffic energy (triglycerides) to muscles and phospholipids to all cells. Their cholesterol is trafficked back to the liver. The apoA-I containing particles traffic cholesterol to steroidogenic tissues, adipocytes (a storage organ for cholesterol ester) and ultimately back to the liver, gut, or steroidogenic tissue.
- All lipoproteins are part of the human lipid transportation system and work harmoniously together to efficiently traffic lipids. As you are probably starting to appreciate, the trafficking pattern is highly complex and the lipoproteins constantly exchange their core and surface lipids.
- The measurement of cholesterol has undergone a dramatic evolution over the past 70 years with technology at the heart of the advance.
- Currently, most people in the United States (and the world for that matter) undergo a “standard” lipid panel, which only directly measures TC, TG, and HDL-C. LDL-C is measured or most often estimated.
- More advanced cholesterol measuring tests do exist to directly measure LDL-C (though none are standardized), along with the cholesterol content of other lipoproteins (e.g., VLDL, IDL) or lipoprotein subparticles.
- The most frequently used and guideline-recommended test that can count the number of LDL particles is either apolipoprotein B or LDL-P NMR, which is part of the NMR LipoProfile. NMR can also measure the size of LDL and other lipoprotein particles, which is valuable for predicting insulin resistance in drug naïve patients, before changes are noted in glucose or insulin levels.
- The progression from a completely normal artery to a “clogged” or atherosclerotic one follows a very clear path: an apoB containing particle gets past the endothelial layer into the subendothelial space, the particle and its cholesterol content is retained, immune cells arrive, an inflammatory response ensues “fixing” the apoB containing particles in place AND making more space for more of them.
- While inflammation plays a key role in this process, it’s the penetration of the endothelium and retention within the endothelium that drive the process.
- The most common apoB containing lipoprotein in this process is certainly the LDL particle. However, Lp(a) and apoB containing lipoproteins play a role also, especially in the insulin resistant person.
- If you want to stop atherosclerosis, you must lower the LDL particle number. Period.
- At first glance it would seem that patients with smaller LDL particles are at greater risk for atherosclerosis than patients with large LDL particles, all things equal.
- “A particle is a particle is a particle.” If you don’t know the number, you don’t know the risk.
- With respect to laboratory medicine, two markers that have a high correlation with a given outcome are concordant – they equally predict the same outcome. However, when the two tests do not correlate with each other they are said to be discordant.
- LDL-P (or apoB) is the best predictor of adverse cardiac events, which has been documented repeatedly in every major cardiovascular risk study.
- LDL-C is only a good predictor of adverse cardiac events when it is concordant with LDL-P; otherwise it is a poor predictor of risk.
- There is no way of determining which individual patient may have discordant LDL-C and LDL-P without measuring both markers.
- Discordance between LDL-C and LDL-P is even greater in populations with metabolic syndrome, including patients with diabetes. Given the ubiquity of these conditions in the U.S. population, and the special risk such patients carry for cardiovascular disease, it is difficult to justify use of LDL-C, HDL-C, and TG alone for risk stratification in all but the most select patients.
- To address this question, however, one must look at changes in cardiovascular events or direct markers of atherosclerosis (e.g., IMT) while holding LDL-P constant and then again holding LDL size constant. Only when you do this can you see that the relationship between size and event vanishes. The only thing that matters is the number of LDL particles – large, small, or mixed.
- HDL-C and HDL-P are not measuring the same thing, just as LDL-C and LDL-P are not.
- Secondary to the total HDL-P, all things equal it seems smaller HDL particles are more protective than large ones.
- As HDL-C levels rise, most often it is driven by a disproportionate rise in HDL size, not HDL-P.
- In the trials which were designed to prove that a drug that raised HDL-C would provide a reduction in cardiovascular events, no benefit occurred: estrogen studies (HERS, WHI), fibrate studies (FIELD, ACCORD), niacin studies, and CETP inhibition studies (dalcetrapib and torcetrapib). But, this says nothing of what happens when you raise HDL-P.
- Don’t believe the hype: HDL is important, and more HDL particles are better than few. But, raising HDL-C with a drug isn’t going to fix the problem. Making this even more complex is that HDL functionality is likely as important, or even more important, than HDL-P, but no such tests exist to “measure” this.
Did you say “delay?”
That’s right. The question posed above did not ask how one could “prevent” or eliminate the risk cardiovascular disease, it asked how one could “delay” it. There is a difference. To appreciate this distinction, it’s worth reading this recent publication by Allan Sniderman and colleagues. Allan sent me a copy of this paper ahead of publication a few months ago in response to a question I had posed to him over lunch one day. I asked,
“Allan, who has a greater 5-year risk for cardiovascular disease, a 25 year-old with a LDL-P/apoB in the 99th percentile or a 75-year-old with a LDL-P/apoB in the 5th percentile?”
The paper Allan wrote is noteworthy for at least 2 reasons:
- It’s an excellent reminder that age is a paramount risk factor for cardiovascular disease.
- It provides a much better (causal) model for atherosclerosis than the typical age-driven models, and explains why age is an important risk factor.
What do I mean by this? Most risk calculators (e.g., Framingham) take their inputs (e.g., age, gender, LDL-C, HDL-C, smoking, diabetes, blood pressure) and calculate a 10-year risk score. If you’ve ever played with these models you’ll quickly see that age drives risk more than any other input. But why? Is there something inherently “risky” about being older?
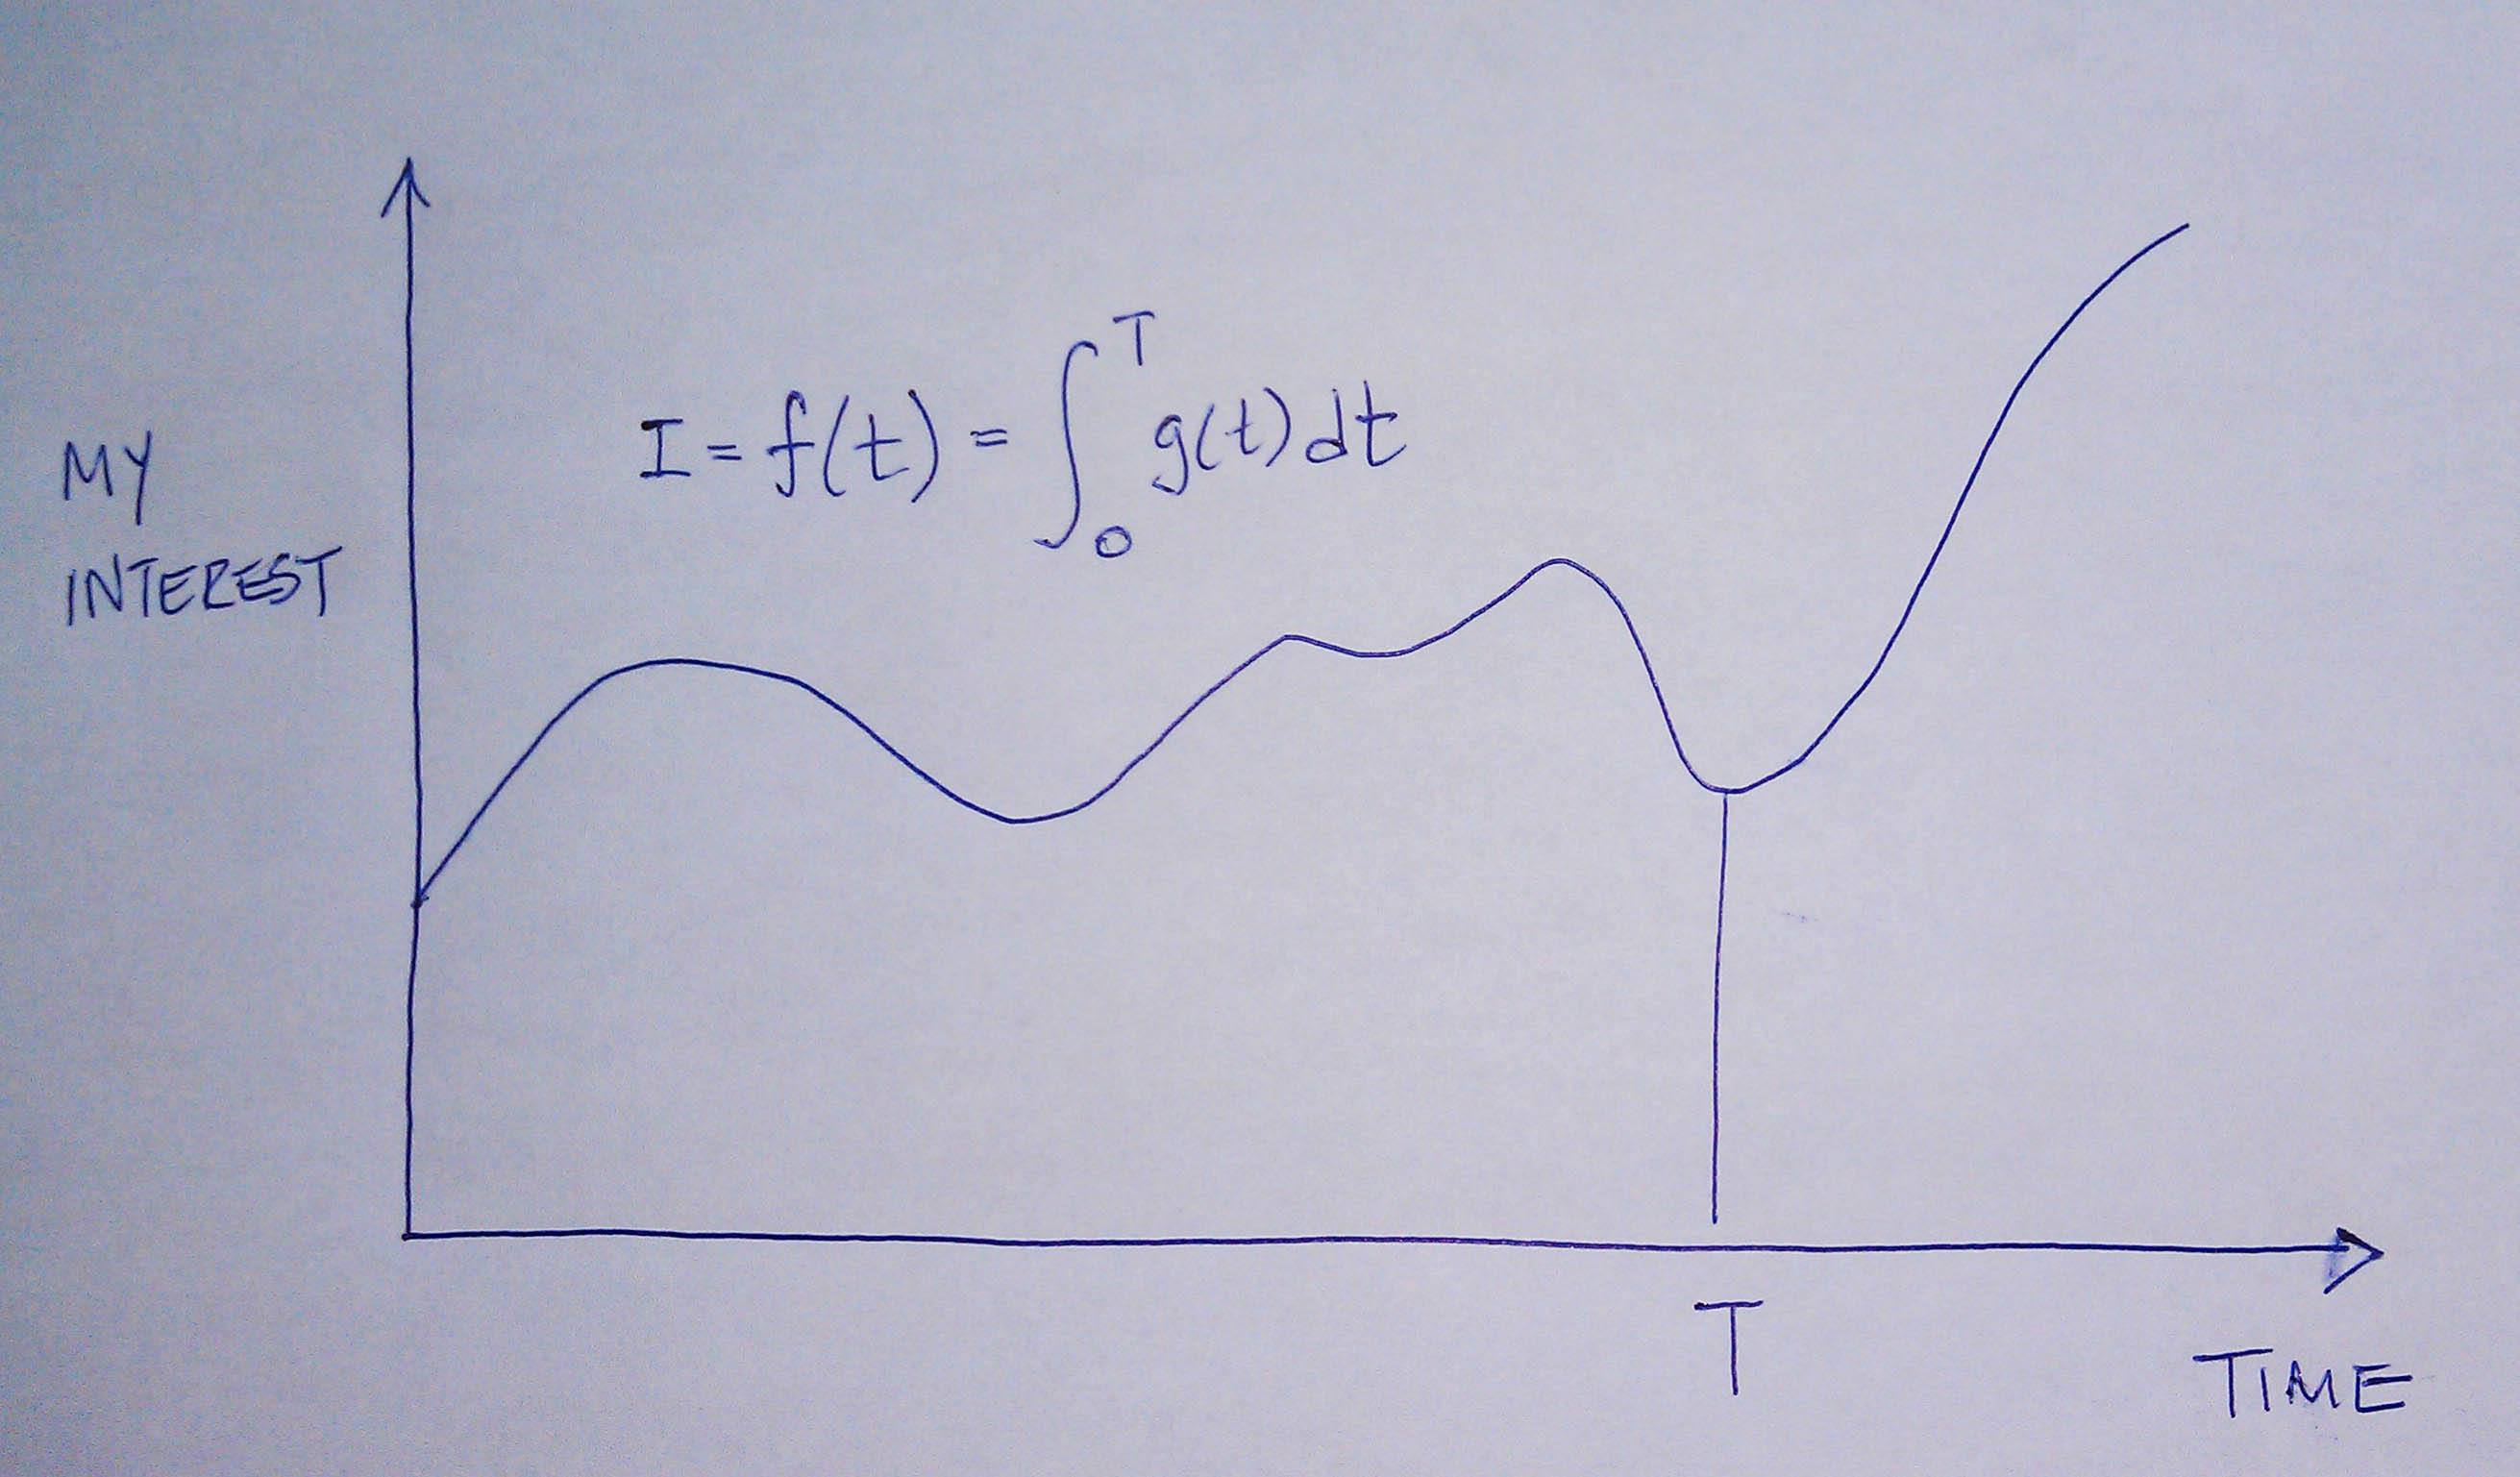
Sniderman and many others would argue (and I agree) that the reason age is a strong predictor of risk has to do with exposure to apoB particles — LDL, Lp(a), and apoB-carrying remnants. Maybe it’s because I’m a math geek, but such models just seem intuitive to me because I think of most things in life in terms of calculus, especially integrals, the “area under a curve.”
[I once tried to explain to a girlfriend who thought I wasn’t spending enough time with her that my interest in her should be thought of in terms of the area under the curve, rather than any single point in time. That is, think in terms of the integral function, not the point-in-time function. Needless to say, she broke up with me on the spot (in the middle of a parking lot!), despite me drawing a very cool picture illustrating the difference, which I’ve re-created, below.]
The reason age is such a big driver of risk is that the longer your artery walls are exposed to the insult of apoB particles, the more likely they are to be damaged, for all the reasons we covered in Part IV of this series. [This paper also reviews the clinical situation of PCSK9 mutations which builds a very compelling case for the causal model of apoB particles in the development of atherosclerosis].
What does eating have to do with cardiovascular risk?
So now that everyone is on the edge of their seat in anticipation of this punch-line, let me provide two important caveats.
First, there are no long-term studies – either in primary or secondary prevention – examining the exact question we all want to know the answer to with respect to the role of dietary intervention on cardiovascular disease. There are short-term studies, some of which I will highlight, which look at proxies for cardiovascular disease, but all of the long-term studies (looking at secondary prevention), are either drug studies or multiple intervention studies (e.g., cholesterol-lowering drug(s) + blood pressure reducing drug(s) + dietary intervention + exercise + …).
In other words, the “dream” study has not been done and won’t be done for a long time. The “dream” study would follow 2 randomized groups for many years and only make one change between the groups. Group 1 would consume a standard American diet and group 2 would consume a very-low carbohydrate diet. Furthermore, compliance within each group would be excellent (many ways to ensure this, but none of them are inexpensive – part of why this has not been done) and the study would be powered to detect “hard outcomes” (e.g., death), instead of just “soft outcomes” (e.g., changes in apoB, LDL-C, LDL-P, TG).
Second, everything we have learned to date on the risk relationship between cardiovascular disease and risk markers is predicated on the assumption that a risk maker of level X in a person on diet A is the same as it would be for a person on diet B.
Since virtually all of the thousands of subjects who have made up the dozens of studies that form the basis for our understanding on this topic were consuming some variant of the “standard American diet” (i.e., high-carb), it is quite possible that what we know about risk stratification is that this population is not entirely fit for extrapolation to a population on a radically different diet (e.g., a very-low carbohydrate diet or a ketogenic diet). Many of you have asked about this, and my comments have always been the same. It is entirely plausible that an elevated level of LDL-P or apoB in someone consuming a high-carb diet portends a greater risk than someone on a ketogenic or low-carb diet. There are many reasons why this might be the case, and there are many folks who have made compelling arguments for this hypothesis.
But we can’t forget the words of Thomas Henry Huxley, who said, “The great tragedy of science is the slaying of a beautiful hypothesis by an ugly fact.” Science is full of beautiful hypothesis slayed by ugly facts. Only time will tell if this hypothesis ends up in that same graveyard, or changes the way we think about lipoproteins and atherosclerosis.
The role of sugar in cardiovascular disease
Let’s start with what we know, then fill in the connections, with the goal of creating an eating strategy for those most interested in delaying the onset of cardiovascular disease.
There are several short-term studies that have carefully examined the impact of sugar, specifically, on cardiovascular risk markers. Let’s examine one of them closely. In 2011 Peter Havel and colleagues published a study titled Consumption of fructose and HFCS increases postprandial triglycerides, LDL-C, and apoB in young men and women. If you don’t have access to this journal, you can read the study here in pre-publication form. This was a randomized trial with 3 parallel arms (no cross-over). The 3 groups consumed an isocaloric diet (to individual baseline characteristics) consisting of 55% carbohydrate, 15% protein, and 30% fat. The difference between the 3 groups was in the form of their carbohydrates.
Group 1: received 25% of their total energy in the form of glucose
Group 2: received 25% of their total energy in the form of fructose
Group 3: received 25% of their total energy in the form of high fructose corn syrup (55% fructose, 45% glucose)
The intervention was relatively short, consisting of both an inpatient and outpatient period, and is described in the methodology section.
Keep in mind, 25% of total energy in the form of sugar is not as extreme as you might think. For a person consuming 2,400 kcal/day this amounts to about 120 pounds/year of sugar, which is slightly below the average consumption of annual sugar in the United States. In that sense, the subjects in Group 3 can be viewed as the “control” for the U.S. population, and Group 1 can be viewed as an intervention group for what happens when you do nothing more in your diet than remove sugar, which was the first dietary intervention I made in 2009.
Despite the short duration of this study and the relatively small number of subjects (16 per group), the differences brought on by the interventions were significant. The figure below shows the changes in serum triglycerides via 3 different ways of measuring them. Figure A shows the difference in 24-hour total levels (i.e., the area under the curve for serial measurements – hey, there’s our integral function again!). Figure B shows late evening (post-prandial) differences. Figure C shows the overall change in fasting triglyceride level from baseline (where sugar intake was limited for 2 weeks and carbohydrate consumption consisted only of complex carbohydrates).
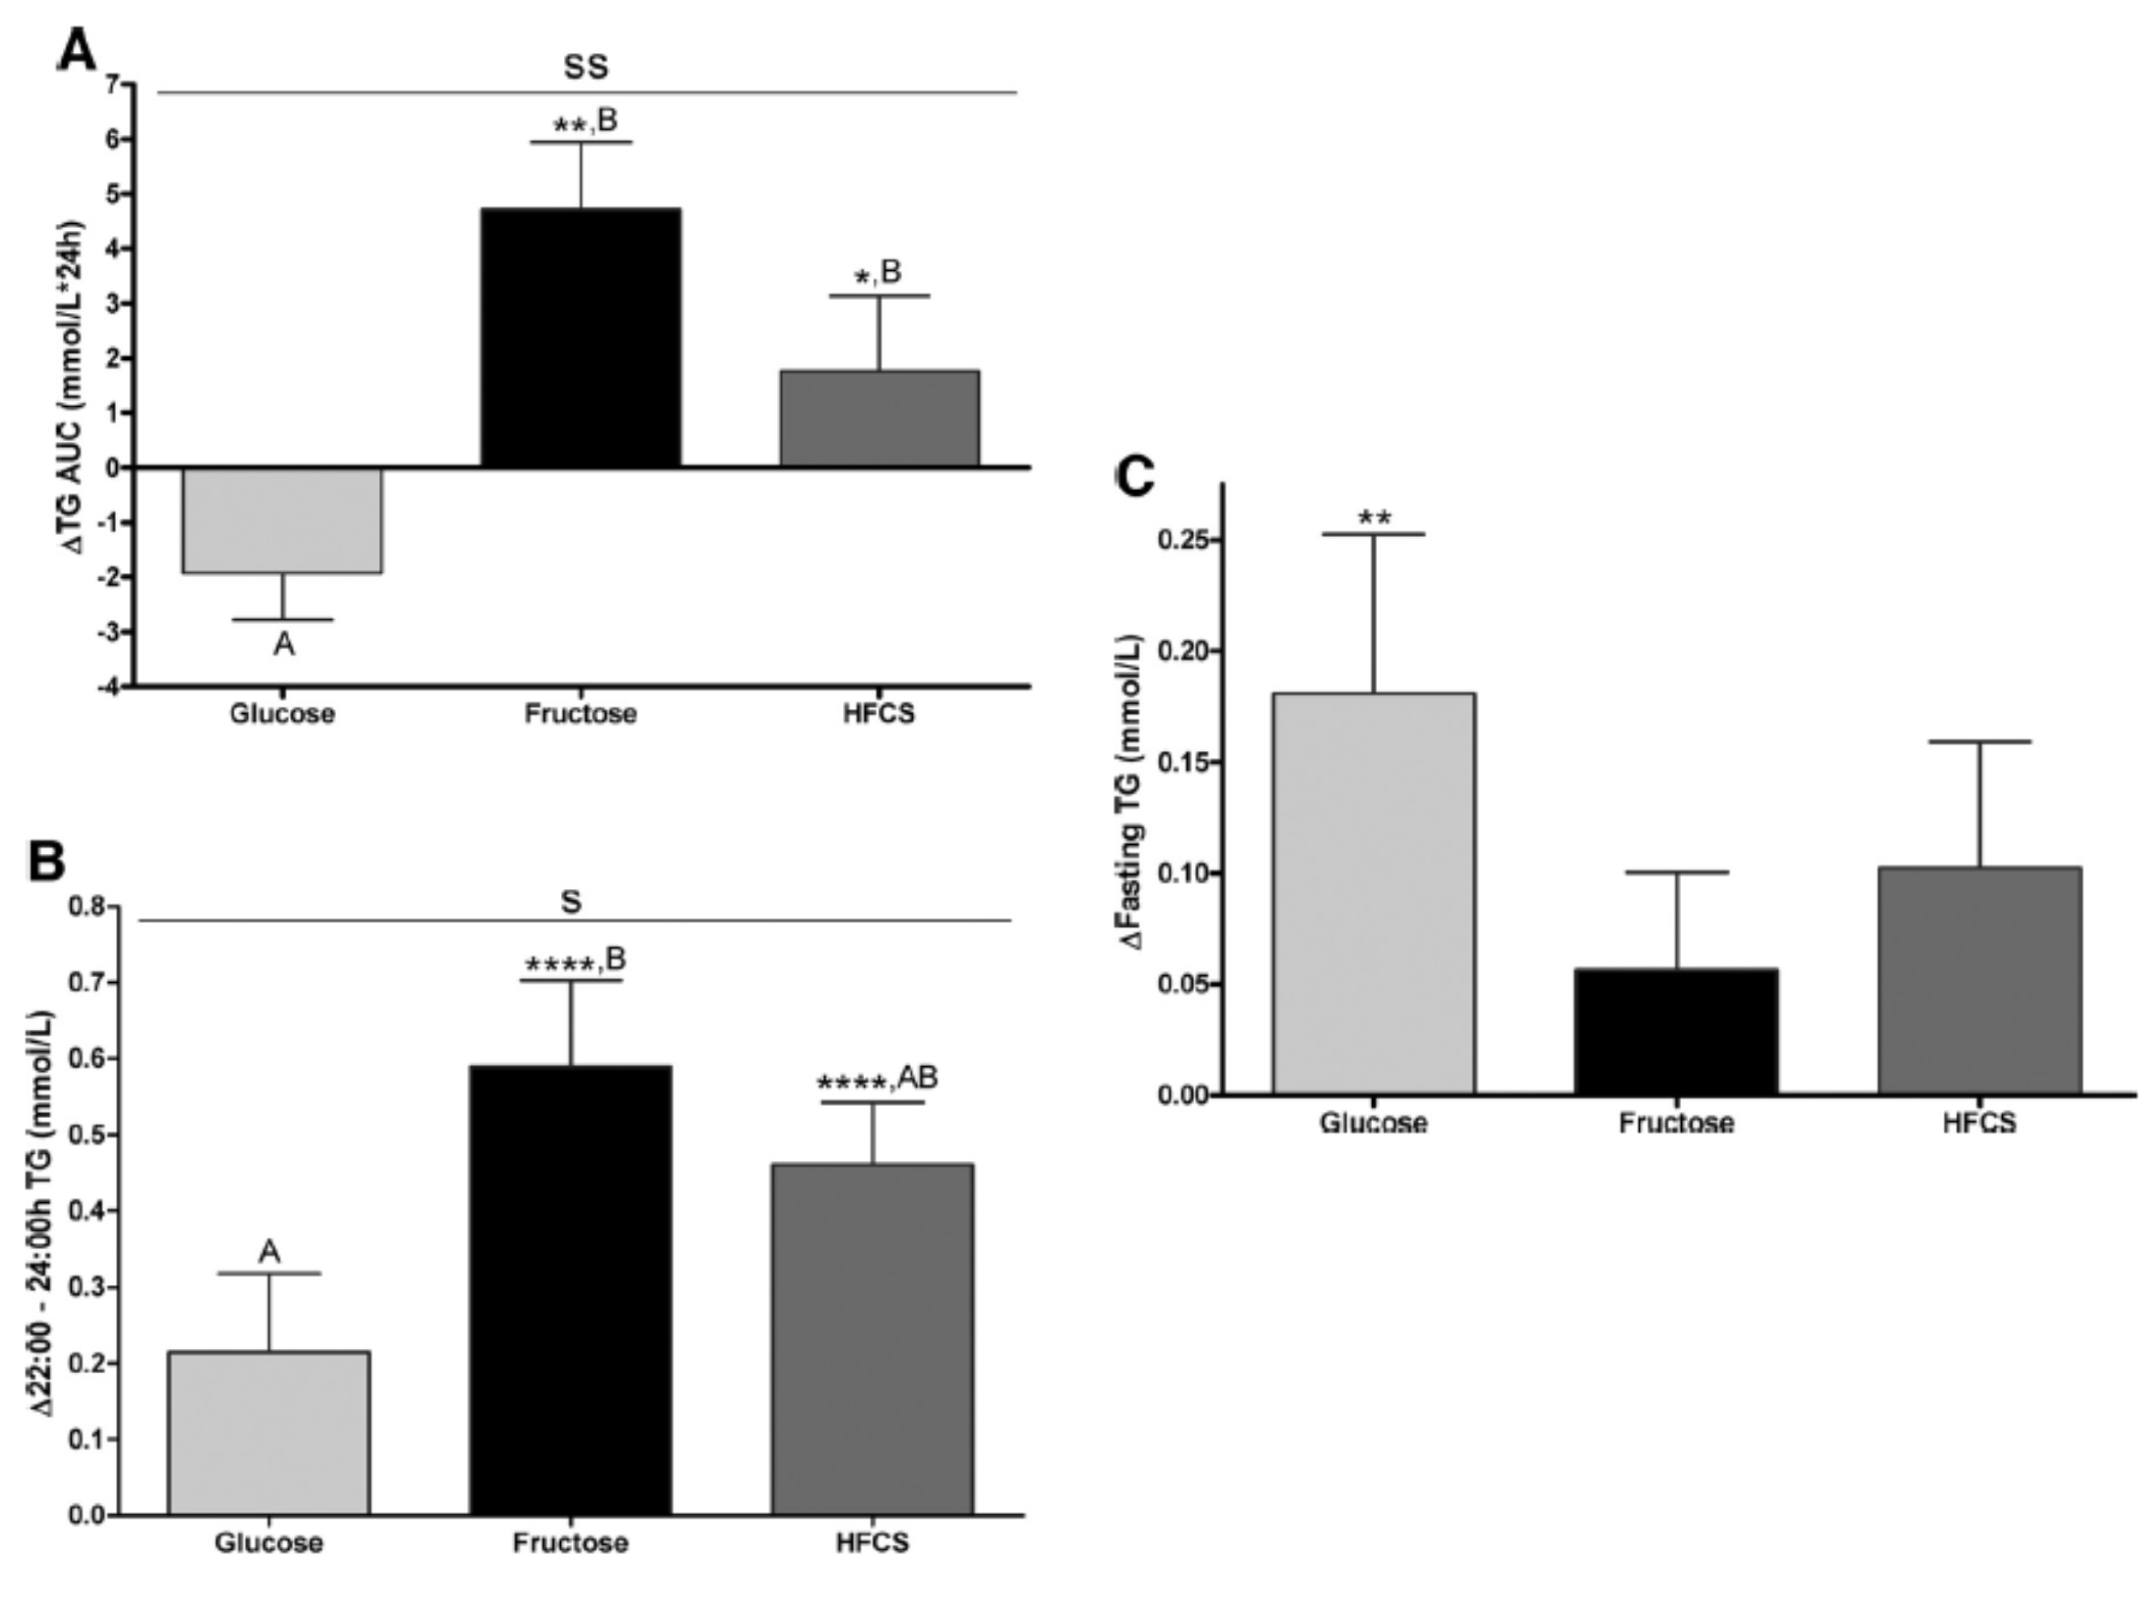
The differences were striking. The group that had all fructose and HFCS removed from their diet, despite still ingesting 55% of their total intake in the form of non-sugar carbohydrates, experienced a decline in total TG (Figure A, which represents the daily integral of plasma TG levels, or AUC). However, that same group experienced the greatest increase in fasting TG levels (Figure C). Post-prandial TG levels were elevated in all groups, but significantly higher in the fructose and HFCS groups (Figure B). The question this begs, of course, is which of these measurements is most predictive of risk?
Historically, fasting levels of TG are used as the basis of risk profiling (Figure C), and according to this metric glucose consumption appears even worse than fructose or HFCS. However, recent evidence suggests that post-prandial levels of TG (Figure B) are a more accurate way to assess atherosclerotic risk, as seen here, here, and here. One question I have is why did the AUC calculations in Figure A show a reduction in plasma TG level for the glucose group?
The figure below summarizes the differences in LDL-C, non-HDL-C, apoB, and apoB/apoA-I.
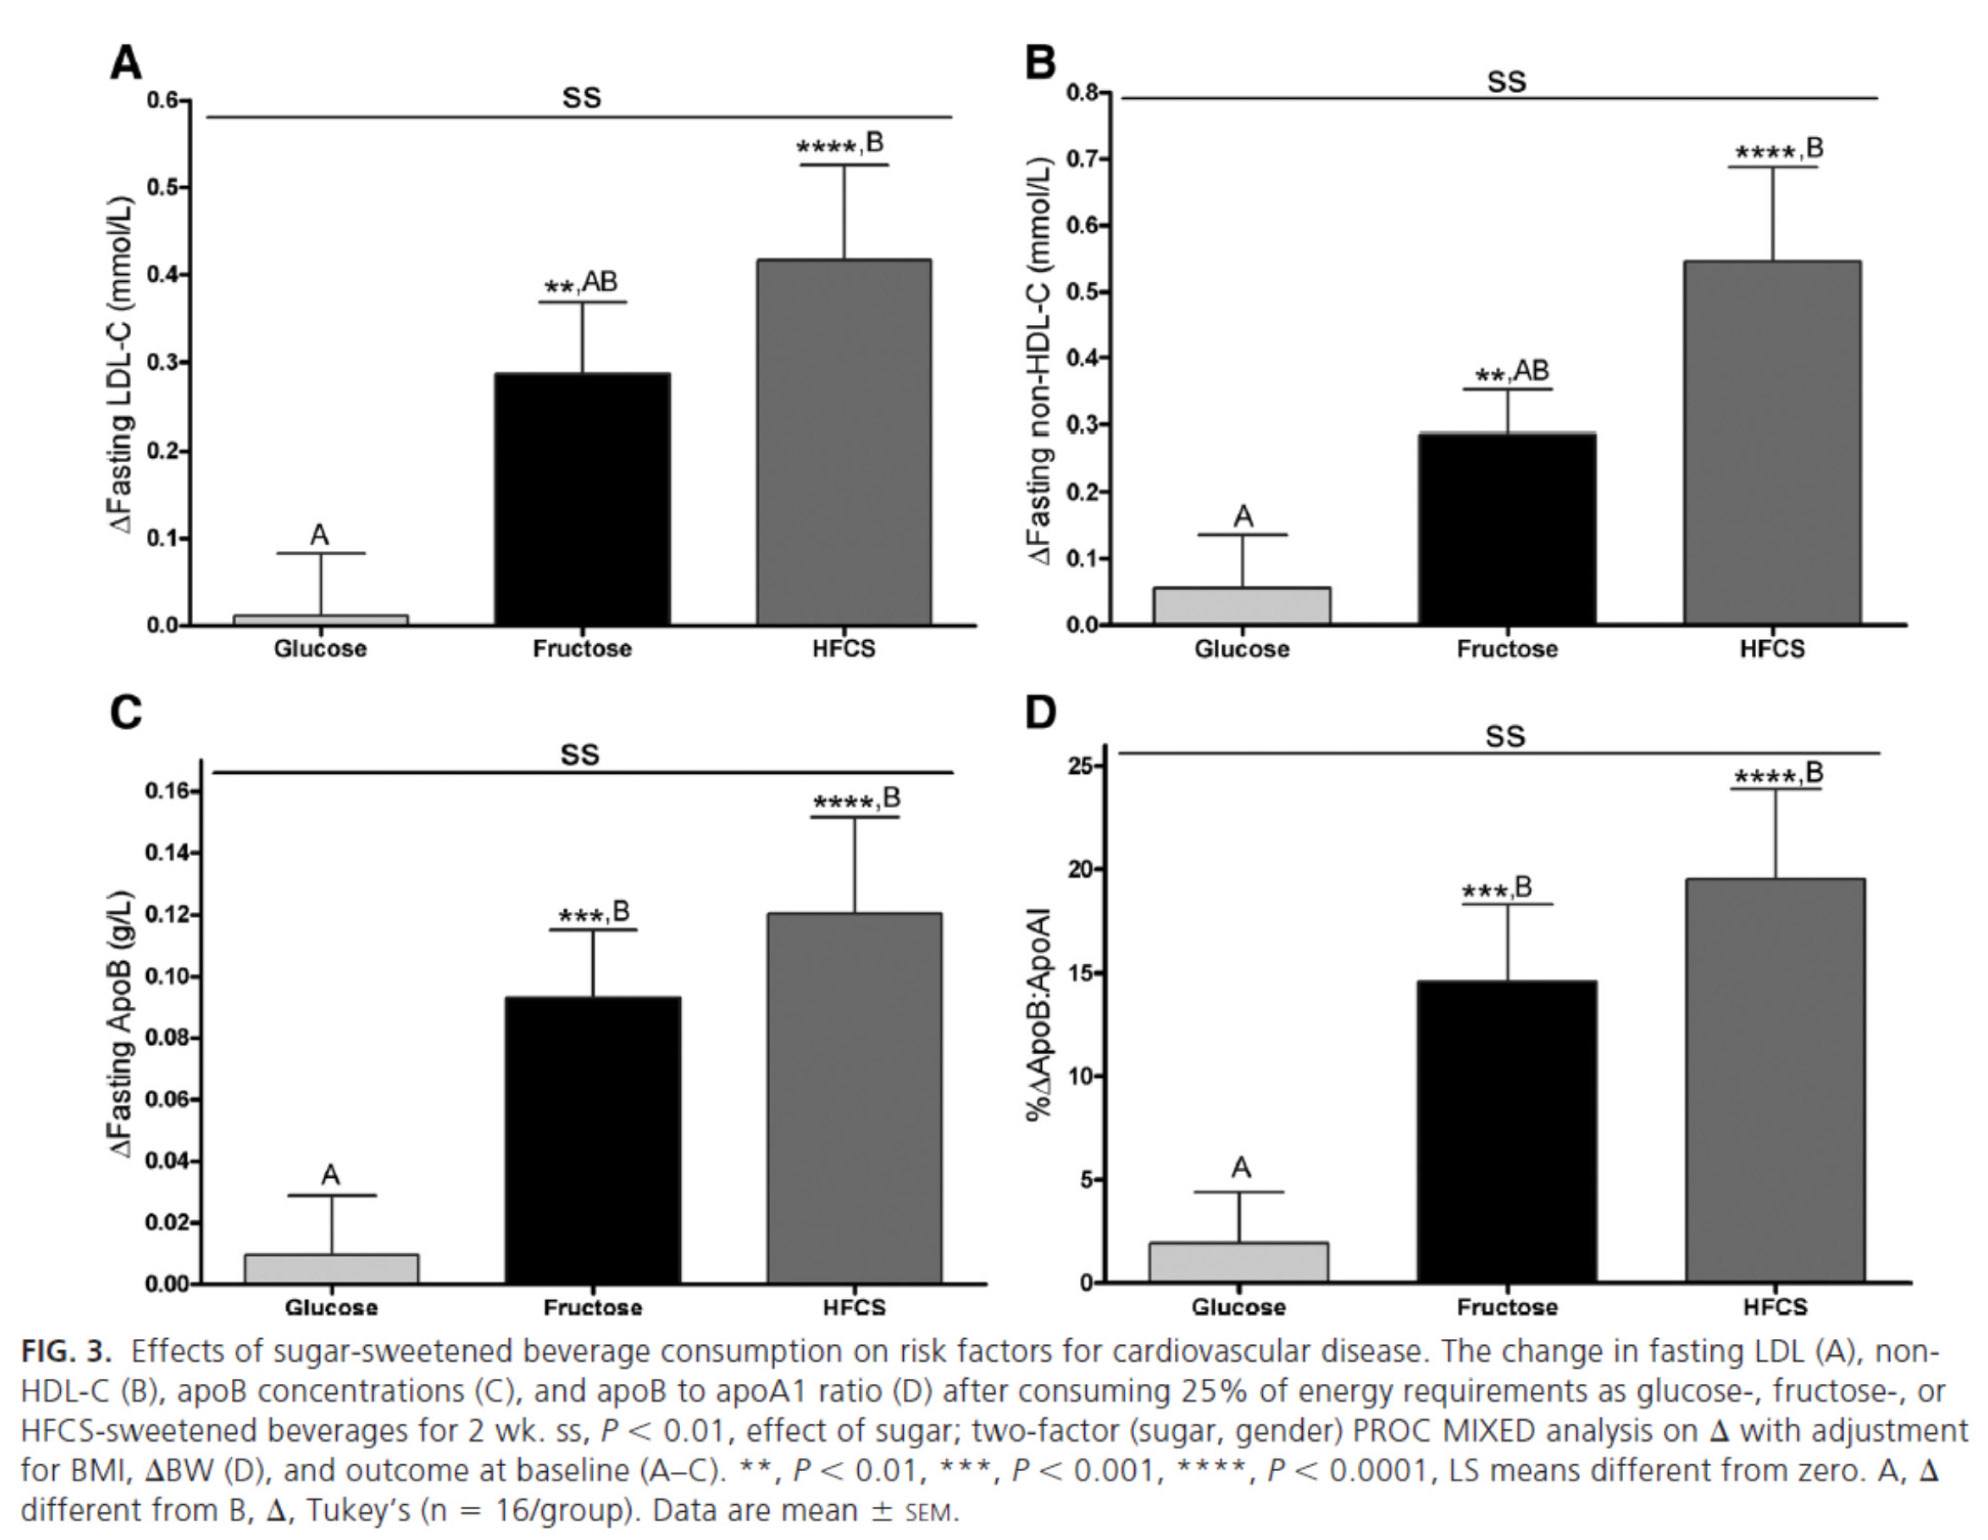
Again, the results were unmistakable with respect to the impact of fructose and HFCS on lipoproteins, and by extension, the relative lack of harm brought on by glucose in isolation. [Of course, removal of glucose and fructose/HFCS would have been a very interesting control group.]
One of the simultaneous strengths and weaknesses of this study was the heterogeneity of its subjects, who ranged in BMI from 18 to 35, in age from18 to 40, and in gender. While this provided at least one interesting example of age-related differences in carbohydrate metabolism (older subjects had a greater increase in triglycerides in response to glucose than younger subjects), it may have actually diluted the results. There were also significant differences between genders in the glucose group.
What was most interesting about this study was the clear difference between the 3 groups that was not solely a function of fructose load. In other words, the best outcome from a disease risk standpoint was in the glucose group, while the worst outcome was not in the all-fructose group, but in the 50/50 (technically 55/45) mixed group. This is a very powerful indication that while glucose and fructose alone can be deleterious in excess, their combination seems synergistically bad.
The role of saturated fat in cardiovascular disease
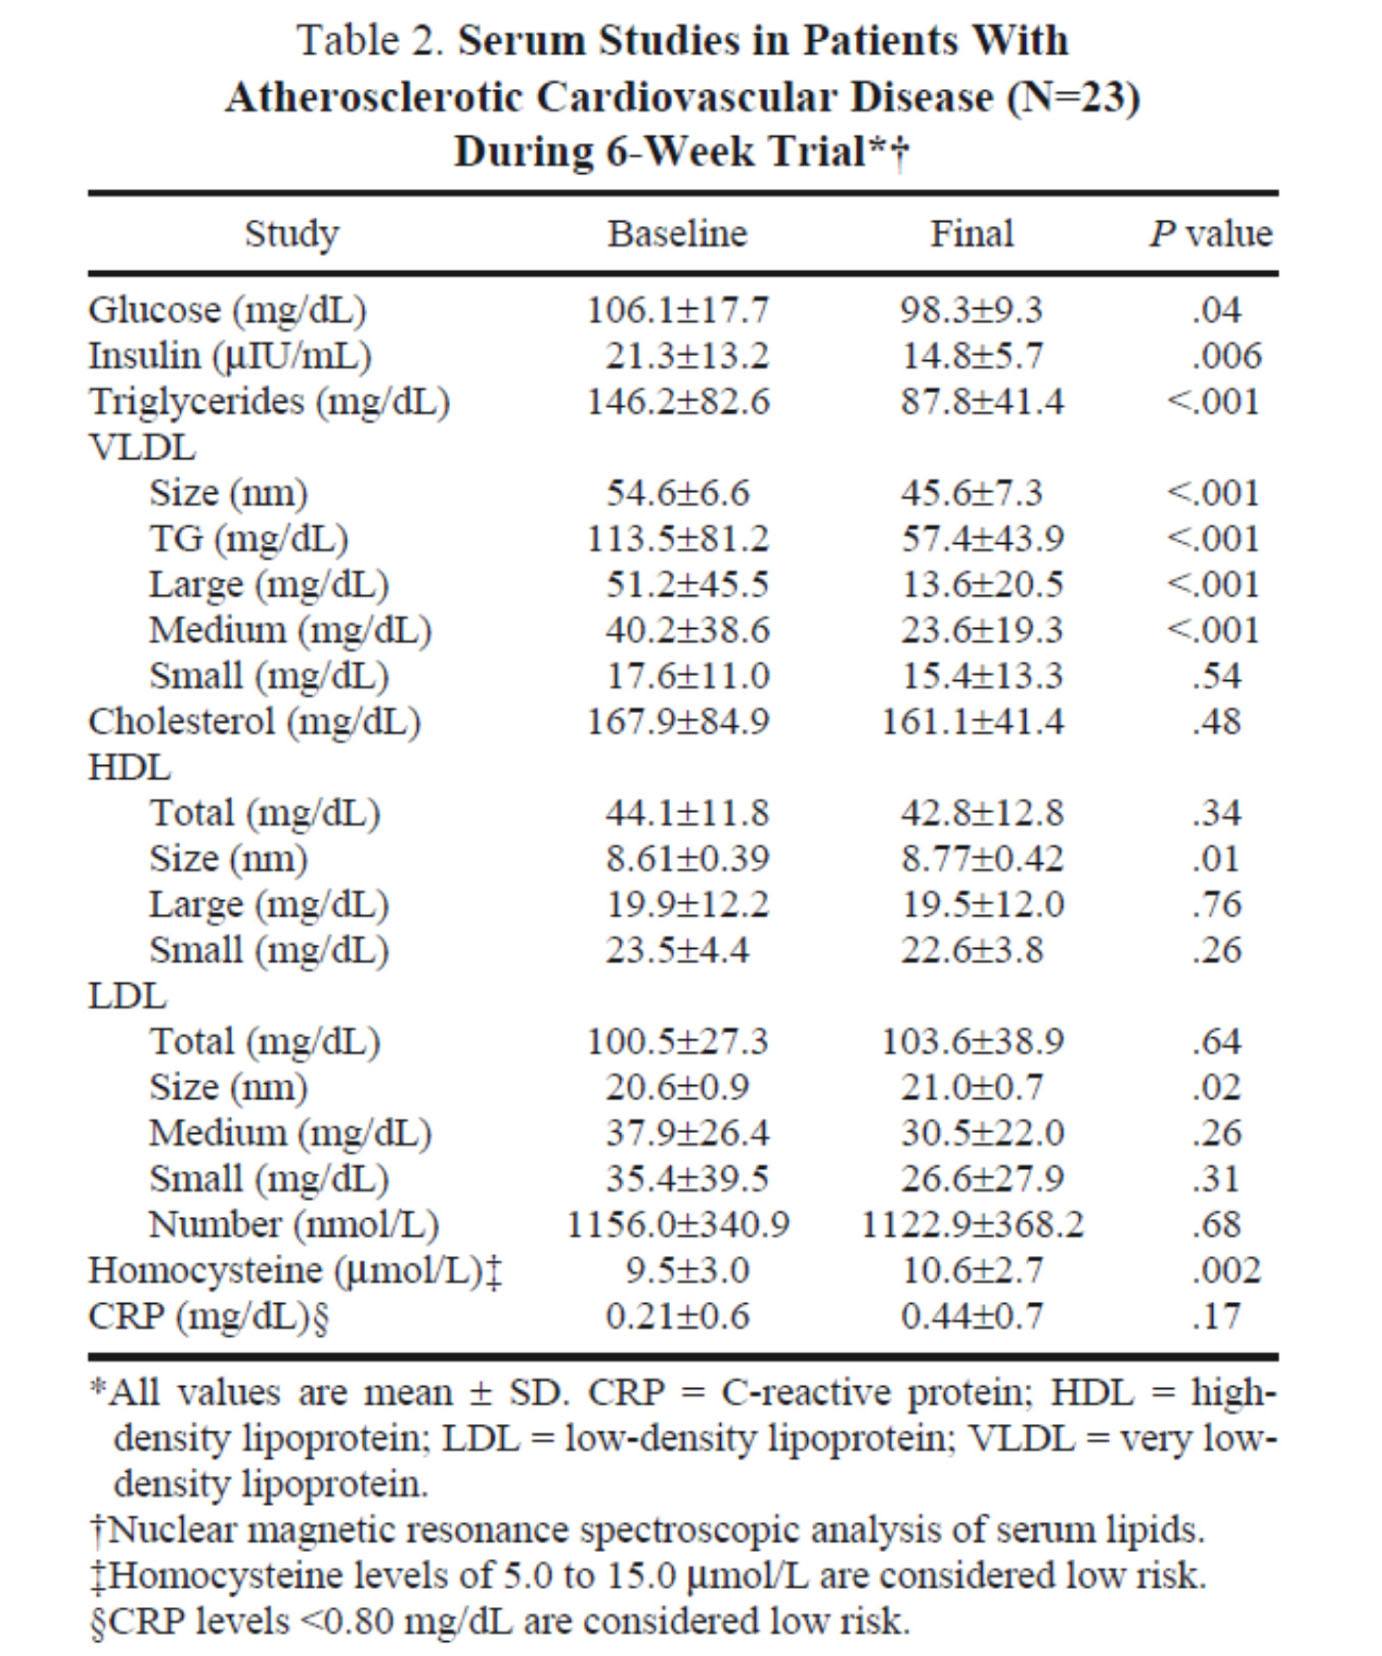
In the next week or two I’ll be posting an hour-long comprehensive lecture I gave at UCSD a few weeks ago on this exact topic. Rather than repeat any of it here, I’ll highlight one study that I did not include in that lecture. The study, Effect of a high saturated fat and no-starch diet on serum lipid subfractions in patients with documented atherosclerotic cardiovascular disease, published in 2003, treated 23 obese patients (average BMI 39) with known cardiovascular disease (status post coronary artery bypass surgery and/or stent placement) with a high-fat ketogenic diet. Because the study was free-living and relied on self-reporting, not all subjects had documented levels of elevated serum B-OHB. However, the subjects were instructed to avoid starch and consume 50% of their caloric intake via saturated fat, primarily in the form of red meat and cheese. There were no restrictions on fruits and vegetables, which may have accounted for the observation that not all subjects were ketotic during the 6-week intervention. In total, only 5 of the 23 patients achieved documented ketosis.
All of the subjects were on statins and entered the study at a goal LDL-C level target of 100 mg/dL, which may have been the only way the authors could get the IRB to approve such a study.
The table below shows the changes in lipoprotein fractions following the intervention (there was no control group):
This study was conducted during the height of the “outcry” over the Atkins diet. While most doctors reluctantly agreed that Dr. Atkins’ diet could reduce body fat, most believed it was still very dangerous. In the words of Dean Ornish, “Sure you can lose weight on a low-carb diet, but you can also lose weight on heroin and no one would recommend that!”
Fair point. In fact, the authors of this study acknowledged that they “strongly expected” this dietary intervention to increase risk for cardiovascular disease, which is why they only included subjects on statins with low LDL-C. However, as you can see from the table above, the authors were startled by the results. The subjects experienced a significant reduction in plasma triglycerides and VLDL triglycerides, without an increase in LDL-C or LDL-P. In fact, LDL size and HDL size increased and VLDL size decreased – all signs of improved insulin resistance. Furthermore, fasting glucose and insulin levels also decreased significantly. The mean HOMA-IR was reduced from 5.6 to 3.6 (normal is 1.0) and TG/HDL-C from 3.3 to 2.0 (normal is considered below 3, but “ideal” is probably below 1.0) in just 6 weeks. Taken together, these changes, combined with the dramatic change in VLDL size, suggest insulin resistance was dramatically improved while consuming a diet of 50% saturated fat!
As all of these patients were taking statins, we’re really robbed of seeing the impact of this diet on LDL-P, which did not change. Also, CRP levels rose (though not clinically or statistically significantly).
Putting it all together
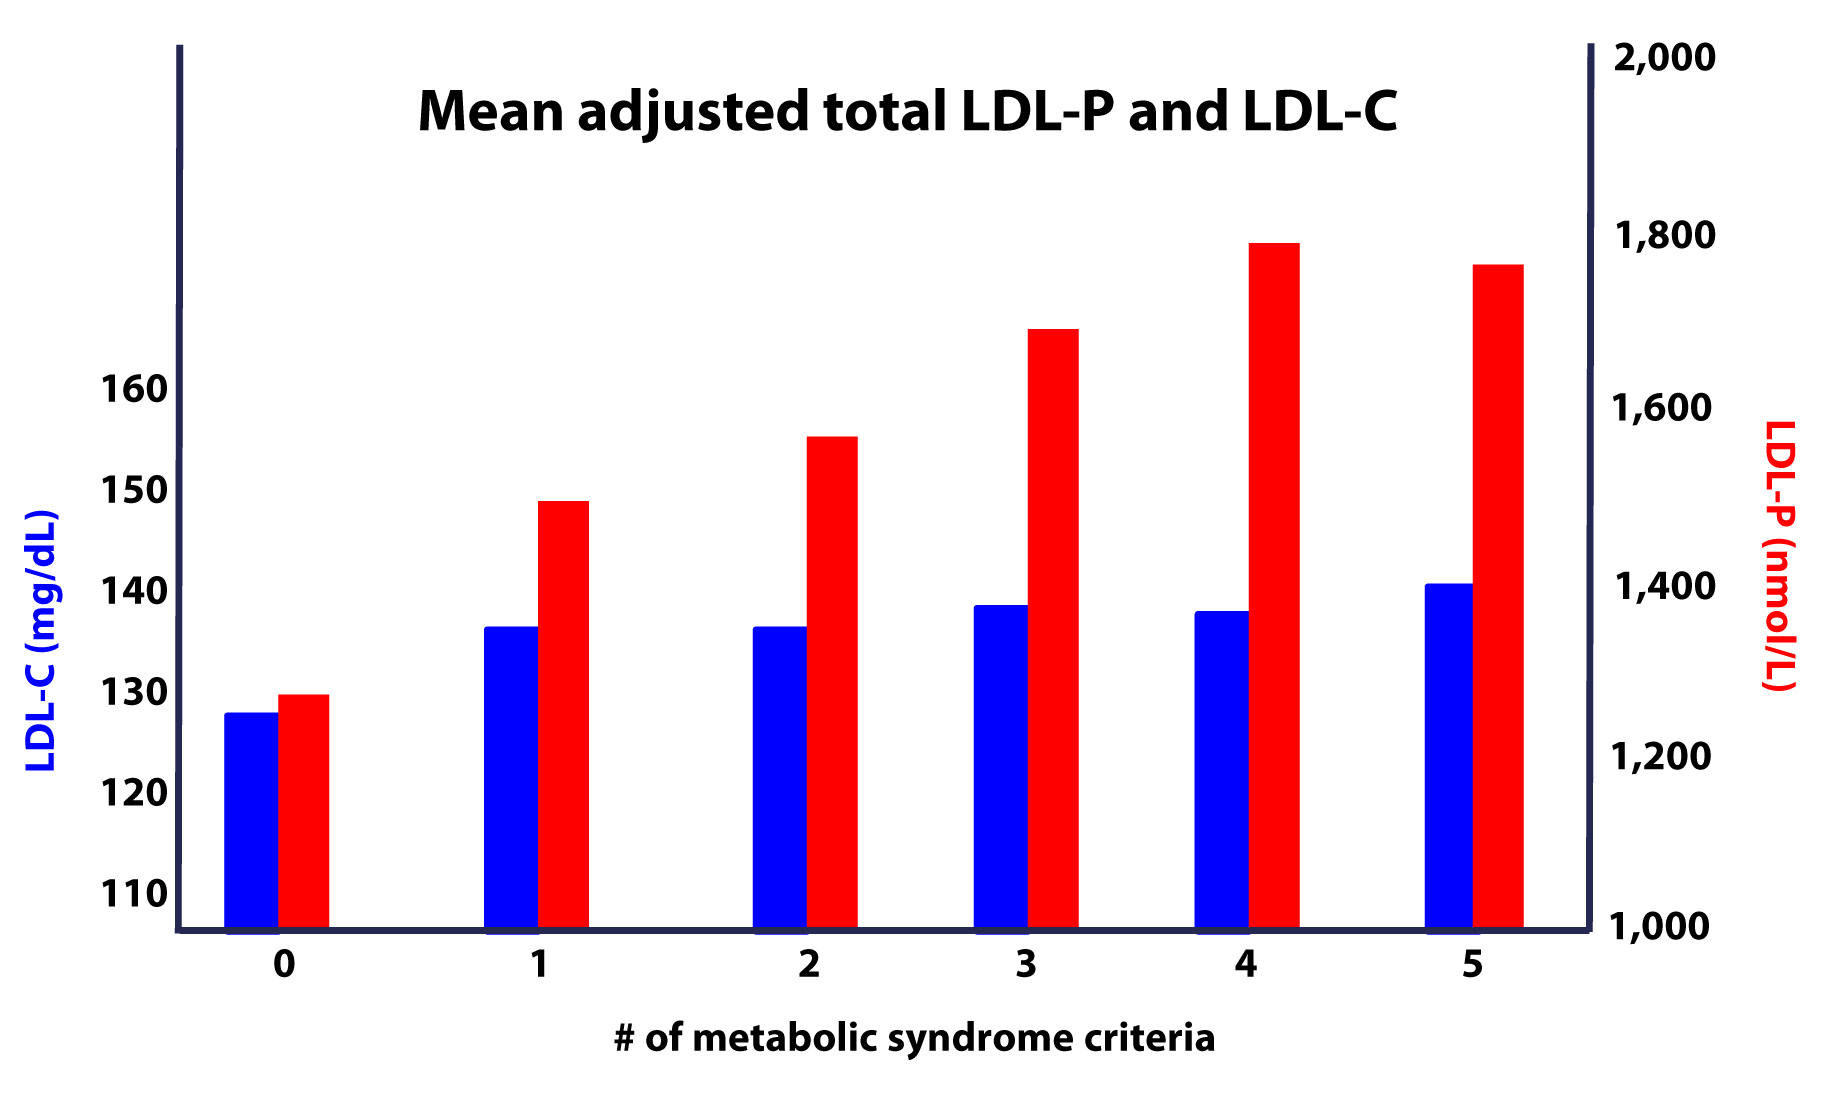
It is very difficult to make the case that when carbohydrates in general, and sugars in particular, are removed or greatly reduced in the diet, insulin resistance is not improved, even in the presence of high amounts of saturated fats. When insulin resistance improves (i.e., as we become more insulin sensitive), we are less likely to have the signs and symptoms of metabolic syndrome. As we meet fewer criteria of metabolic syndrome, our risk of not only heart disease, but also stroke, cancer, diabetes, and Alzheimer’s disease goes down.
Furthermore, as this study on the Framingham cohort showed us, the more criteria you have along the spectrum of metabolic syndrome, the more difficult it becomes to predict your risk, due to a widening gap in discordant risk markers, as shown in this figure.
As I noted at the outset, the “dream” trial has not yet been done, though we (NuSI) plan to change that. Until then each of us has to make a decision several times every day about what we will and won’t put in our mouths. Much of this blog is dedicated to underscoring the impact of carbohydrate reduction on insulin resistance and metabolic syndrome.
The results of the trials to date, combined with a nuanced understanding of the lipoprotein physiology and their role on the atherosclerotic disease process, bring us to the following conclusions:
- The consumption of sugar (sucrose, high fructose corn syrup) increases plasma levels of triglycerides, VLDL and apoB, and reduces plasma levels of HDL-C and apoA-I.
- The removal of sugar reverses each of these.
- The consumption of fructose alone, though likely in dose-dependent fashion, has a similar, though perhaps less harmful, impact as that of fructose and glucose combined (i.e., sugar).
- The addition of fat, in the absence of sugar and starch, does not raise serum triglycerides or other biomarkers of cardiovascular disease.
- The higher the level of serum triglycerides, the greater the likelihood of discordance between LDL-C and LDL-P (and apoB).
- The greater the number (from 0 to 5) of inclusion criteria for metabolic syndrome, the greater the likelihood of discordance between LDL-C and LDL-P (and apoB).
I would like to address one additional topic in this series before wrapping it up – the role of pharmacologic intervention in the treatment and prevention of atherosclerotic disease, so please hold off on questions pertaining to this topic for now.


How long after first attaining a ketotic state and maintaining it (say 30g or so of carbs a day) should it take for blood numbers to noticeably improve? Is there a transition time where the blood numbers will temporarily get worse? Blood numbers being taken from a standard lipid test. For example, LDL up, HDL down, triglycerides above 200?
Different for different folks, and highly dependent on the ketotic state and lots of other variables. Some people experience changes in 3 months, other 3 years.
Chris Masterjohn, a lipid research and advocate of ancestral eating, advises waiting 6 months *after* your weight stabilizes (if you are, in fact, losing weight) before you get a lipid panel done. There are just too many factors that make lipid readings go out of the normal range during weight loss for a lab test to be considered useful, except in extreme cases. For example, during weight loss, it’s normal for LDL readings to go up for a number of months as your body increases the transport of fatty acids liberated from adipocytes to be used as fuel. While this goes on, urine-based ketone detection strips will likely show a decrease in the concentration of ketones, because they don’t detect the form of ketones (hydroxybutarate) that are most likely circulating in the bloodstream (and are well used by the brain). If you’re being pressured to get a lab test, push back and insist on at least a 90-day wating period, and preferably 6 months.
Correct. Many folks have suggested this. Typically, an improvement in TG and HDL-C will be seen before weight stabilization, though. This is possibly more the case for LDL.
Thanks! This info is exactly what I was looking for. I have been pretty much in a constant ketotic state for a month or so. I just had a free blood test (simple lipid panel) at work. My LDL was up noticeably, my HDL was down noticeably (low 20s, it has been consistently about 40 or just under for years), and my triglycerides weren’t near as low as I thought they would be. I think they were low to mid 200s. I was expecting under 100. I thought triglycerides were pretty fast to respond to low-carb. Total cholesterol was over 300 for the first time ever. I am NOT worried, just trying to make sense of it. I’ll try and get checked again at my doctor’s office in 2-3 month and hopefully at least see some improvement in each of those even if it isn’t as improved as it will be. I workout pretty hard lifting heavy weights 4-5 times a week and I am 44 yrs old and male.
Hi Peter
I love your blog. It makes very complex subjects so much more accessible to the layperson such as myself. I have read through this series on cholesterol with great interest as I have recently had a lipid panel test and I was trying to interoperate the results. Convention states that the results are disastrous and my doctor will freak when I see him again. However, I’m not conventional and am not ready to panic yet, until I read the summary quote in part IV: “If you want to stop atherosclerosis, you must lower the LDL particle number: ” –
Looking at my lipid panel my LDL is very high. Naturally I was concerned, even though I have no faith in the lipid hypothesis. Question I need to answer is should I worry or not about the figures? I have had a very low carb diet for the last 8 months and followed it with religious zeal thinking that it the best path to good health. I follow advice from this site and Mark’s Daily Apple. However, I was stunned when I got the results:
GLUCOSE: 5.4mmol/dl (not sure of the conversion)
TRIGLYCERIDES: 1.2 mmol/l (46mg/dl)
CHOLESTEROL: 7.1 mmol/l (274mg/dl)
HLD: 1.5 mmol/l (58mg/dl)
LDL: 5.1 mmol/l (196mg/dl)
Having followed a low carb diet with regular intense exercise, I cannot account for such a large LDL number. Reading these articles though has made me wonder if the numbers are worthless, but still feel I need to look into this further.
I’m not Peter, but if you’ve been paying attention you would know that he recommends getting the NMR Lipid profile from Liposcience. It’s all about the particles, so get the test done so you’ll know where your LDL-P is at. Since you’re reporting all your values in mmol/dl you may not be in the US so that test could be problematic.
Wayne,
Refer to my post above about odd LDL readings during weight loss. Another possibility to explain your results is one discussed at length by Paul Jaminet, author of the Perfect Health Diet. You might be in the population that needs more starch than a very low-carb diet, where carbs come only from vegetables, provides. He’s written a multi-part series of blog posts titled “Dangers of low-carb diets x” where x is a roman numeral, that is worth reading. If your lipid panel is still showing these types of results 6 months *after* your weight stabilizes (if you are, in fact losing weight), consider adding starches like sweet potatoes and white rice, to your diet, and see what happens.
Wayne. You´re right. Total cholesterol and LDL-cholesterol levels are relatively high. I suppose you know this may be genetically determined. In such cases it may be very hard to lower total and LDL-cholesterol through diet. However, there are other things you should look at. TG/HDL ratio is low which is a positive thing. You will also have to look at other risk factors such as smoking, high blood pressure etc. If the elevated total and LDL cholesterol are your only risk factors I would not worry to much about it.
Just to be philosophical for a moment, regarding age: If the number one cause of death is CVD, do *I* really want to be the one proselytizing “the truth” to relatives or friends, since the probabilty is good they will eventually die of CVD either way? (The truth being Statins / NNT dubious reality for most and HFLC is probably positive)
As a scientist, you are in a totally different situation as you have an audience comprised of appreciative open individuals that are seeking the truth (and responsible for changing their own course if/when warranted)
People need to realize the dynamics of trying too hard to convince family members of health decisions unless you want to be blamed when Uncle Billy kicks the bucket.
Much gratitude for the Cliff Notes! ….sure helps me
Peter,
I find myself on all these blogs (including MDA) reading medical papers, reading books, watching documentaries on what we should be feeding our bodies. I have personally been Paleo/Primal for 3 months (wasn’t over weight to start, but in amazing shape now) in a bid to show my parents (one pre-diabetic, another type-2 diabetic) that it all starts and ends with food. I send them articles…give them cook books….lead those horses to water, but their doctors and nutritionists tell them opposing information like: “don’t eat eggs, and no oils”. I’m going crazy cause my parents think I’m the wacko. Why do these doctors continue to perpetuate nonsense?
I share your frustration. This is why we’re putting NuSI together to tackle this problem structurally and scientifically.
Peter, the more I research on cholesterol and atherosclerosis, the more different theories and variables I collect.
I think it would be very useful and pertinent to gear the NuSI trial with as many measurements as possible, to avoid those bias pitfalls so common in the studies we criticize. I know it all comes down to having enough money, and usually this is the stopping point, but a study that collects enough information from individuals to compare the various disease theories (and not just confirm/unconfirm one of them) would do a lot more for the science than the usual single-minded design…
For example, it should probably take into account all the measurable factors related to cholesterol both in synthesis, transport, and assimilation at the cells, as well as the oxidation factors. For example, by measuring Vitamin E, oxidized LDL, and a few genetic markers for LDL receptors, the trial would be able to prove/disprove Chris Masterjohn’s theories of arterial disease. I wish there was a study that encompassed enough measurements to cover ALL the main disease theories so that we could actually find the true correlation.
Along with “hard” outcomes, of course.
Death, yes, definitely a hard outcome. As a 50-something reader who’s well aware that age accounts for more and more of the variance of risk as we…well, age, I find myself reading studies and discussions of risk reduction with the following thought background: I wonder how the risk works in people (like moi) who have decades of consistent, multi-factorial risk reduction behaviors on their side. Concurrent to reading this post, I also viewed last night, Dr. Davis’ presentation at Lecturepad on RBC fatty acid status and CVD. I went to sleep thinking, a little bit of this, a little bit of that. So, while you can have great biomarkers within a year of implementing risk reduction behaviors, and you can have those same great biomarkers 20 years after implementing and maintaining those behaviors, it’s hard to tell from the biomarkers how much that risk has actually been reduced in you by implementing risk reduction over a long period of time as you age. By consistent behaviors I mean 15+ years of carb restriction (I was all over Protein Power and The Zone when they first came out), fish oil for a decade, 30 years of sane and consistent training effect after a very active childhood and athletic teens and 20’s, a good history of refreshing sleep, active stress management, meditation, high pleasure, and a little BHRT thrown in more recently for good measure. Is there a synergy that over time confers something that we will never be able to determine from examining discreteness? And maybe that even impacts what amount of the variance is accounted for by age?
Well, that would be cool, but I think many of us may be here (in the field, looking at our family histories, reading research and blogs) because of that very personal awareness of the hard outcome. I know I sure am. The two families that make up my genetic heritage have fascinated me as they’ve aged; partly because they’re each so huge that I got to see what killed people and what didn’t. I’ve mentioned here before that my father had a beautiful lipid panel and ECG three months before he dropped dead of the big one at the age of 64 on the living room floor after an early spring round of golf and a bagel. My dad was the oldest son of an impoverished Irish immigrant family of 8 siblings. My grandfather died of a massive MI at 55; following multiple “smaller” heart attacks which he dealt with by cracking open a cold one and sitting it out in his rocking chair. Believe me, my father’s young death following his father’s younger death got the attention of two generations of *everybody* as it related to all of our family history risk. But, they were also both bad smokers with high stress and type A -reactive personalities. In spite of how truly awful this family’s diet was (your basic highly refined carb poverty diet which none of them ever really changed after leaving the family home), in the almost 20 years since my father’s death, the only other sibling to die was another smoker. The surviving siblings (6) now range in age from 68 to 86, with only one case of heart disease, which required angioplasty, and he too was a past smoker. My mother’s family has great longevity; another immigrant family of small means and 9 children, my mother being the youngest, now at age 80. This family distinguished itself for me by all the females being very interested in health and nutrition, and my grandfather having a huge garden. This grandmother died in her late 90’s. My grandfather in his 70’s from lung cancer, he was a smoker. The only siblings who have died are the three males, all from emphysema, all smokers. All the female siblings are alive, and we had a reunion just this week. They range in age from my mother at 80 through her oldest sister at 95. So, two large families with very different diets and different risk factors, and the only people who died on either side were the smokers. It’s my personal experiment of n=21, and the take home for me is don’t smoke and eat my vegetables! As each of these 17 people in my parents’ generation had the Catholic requisite pile of kids, my generation includes around 60 cousins, and it’ll be interesting to see what happens to all of us. I don’t think there are any smokers. I am hoping that the synergy of my long term risk reduction behaviors confers some beneficial epigenetic mojo on my own aging.
Peter, I don’t know how many times we can thank you for your work on this series before it loses its impact on you, but it is much appreciated. Btw, you would have had me at “integral function”.
Ha ha, Lorraine. You’re the only one!
Something tells me that Peter’s ex-girlfriend well understood out-of-sample extrapolations…
Ha ha!
Peter,
Another amazing lecture. Thank you, once again, for all you do on this site. It is so inspiring and very appreciated.
Another great article, Peter. Do you know of any studies that have been done on fasting vs non-fasting lipid levels in high carb vs low carb dieters? I’ve often wondered if lipid numbers among low carb eaters aren’t naturally higher than those of high carb eaters, since their bodies are conditioned to releasing fat stores. Of course, their muscle cells would also be conditioned to consume that fat, so perhaps the net result is the same.
Not exactly. Lots of work on fasting vs non-fasting vs AUC, but I don’t know off the top of head of the side-by-side you describe. I’ve done some self-experiments on this with IF vs “regular” eating.
You are too charitable to esteemed folks like Ornish & Hirsch (labeled as ’emeritus’ twice in one sentence in the latest NY Times diatribe against Ludwig’s findings.) Their dogma have trained medical providers to give such advice to a relative of mine( female in her mid 60’s):
Blood Tests: Range 6/12/2012
Hemoglobin A1C (Blood Sugar) 4.8 – 5.9% 7.0
Cholesterol <200 181.0
Triglyceride /=40 58.0
LDL calculated <100 79.0
Cholesterol/HDL (Formula) <4.3 3.1
For decades now, she ate conventionally 'healthy': nil fat and sugar, lean protein and mostly complex carb and veg. Still slim and trim, she has crossed over to Type 2 Diabetes.
Her doc's advice: maintain her current hi-carb diet composition. And start taking Simvastatin (Z0c0r) 20 mg. daily.
Bad ideas, when implemented, have terrible consequences.
Peter, thanks ever so much for your evidence-driven quest for facts and most importantly, the willingness to question one's beliefs when contradicted by new findings.
I’m confused by the introduction to the illustration with four graphs. The introduction says, “The figure below summarizes the differences in LDL-C, non-HDL-C, apoB, and apoB/apoA-I.” Isn’t non-HDL-C the same thing as LDL-C?
non-HDL-C is a proxy for LDL-C + VLDL-C
Thanks for all this. My learning curve is slowly improving. Still a bit confused about how to assess specific lipid info. After much pestering I was able to get an order for ApoB and ApoA1, but the insurance company denied payment saying such tests are investigational and experimental. Their full defense of the paradigm can be found here:
https://www.aetna.com/cpb/medical/data/300_399/0381.html
Be that as it may, my latest lipid numbers are:
TC – 275
TG – 96
HDL -106
LDL -150
non HDL-C – 169
Chol/HDL – 2.6
apo B – 144
apo A1 – 200
I am not sure if this means I have discordence with my ldl measurements. Also wondering about the high HDL & apo A1. I’ve been very low carb for 6 months. Without giving my med hx, I’d like some guidance on understanding the apoB and apoA1, particularly relative to my “basic lipids.” Can you point me to any info on how to correlate specific apoB numbers to ldl-p?
Really looking forward to NuSci!!
There are formula to correlate them, but they are probably not worth fiddling with. Just have your doctor walk you through the risk assessment based on the apoB (assuming it was measured, not “estimated”).
Good doctor, of course all of this sounds like sugar is an evil, but these studies really don’t tell us if it leads to heart disease. In this world of science we cannot claim that if B causes C, and A causes B, then A must cause C. We are seing this faulty logic exposed in studies of in-development meds that increase HDL — they do not reduce heart disease. Dr. Krause has shown this with Saturated fat; which I’m sure you will cover. SF increases LDL-C, maybe, but SF is not associated with heart disease. Just because something affects a heart risk indicator doesn’t automatically make it bad. Further study is of course needed to link A to C or Sugar to heart disease. Studies such as the University of Warwick’s work with LDL MGmin need to be included in these discussions.
Yes, John. You are correct. The type of studies you’re talking about use “hard outcomes” (e.g., death, rates of cancer, number of heart attacks) rather than “soft markers.” Until such studies are done — and I personally have EVERY indication of ensuring the 100,000 person 5-year study to test these things is done — you, me, and everyone still has to make a choice about sugar. In the words of our good friend, Clint Eastwood, “Do you feel lucky?”
On a VLC diet post-prandial TAG will be high, due to higher levels of chylomicrons.
Do chylomicron TAGs matter?
Good question. It ultimately depends on their fate (biological). If said TAGs end up being oxidized by muscle cells, it’s great. If they end up in adiopose cells…not so good.
I have a thought about age being a major risk factor for atherosclerosis…
I think it is more that just time exposed to ApoB. This would make sense if we were talking about water in a metal pipe, but we are dealing with living cells that are constantly dying and being regenerated. What’s the avg. life of an endothelial cell before it dies and is replaced? When we get older stuff eventually starts to go wrong, breakdown, and/or not have the same integrity that it once did (wrinkled skin, gray hair, failing eyesight, etc). It makes sense to me that this would also apply to the lining of our arteries. If the endothelium has lost some of its integrity due to the aging process, perhaps it creates an environment for ApoB to gain a foothold. The same basic theory could apply to cancer as it relates to old age too I suppose.
Very likely synergistic mechanism as you suggest. I would say it’s at least possible that age contributes to the maladaptive response of the immune system to the apoB particles.
Can’t wait for the IX part series on telomeres…
This will teach me to be sarcastic:
Association of Marine Omega-3 Fatty Acid Levels With Telomeric Aging in Patients With Coronary Heart Disease
https://jama.jamanetwork.com/article.aspx?articleid=185234
Abstract:
Context Increased dietary intake of marine omega-3 fatty acids is associated with prolonged survival in patients with coronary heart disease. However, the mechanisms underlying this protective effect are poorly understood.
Objective To investigate the association of omega-3 fatty acid blood levels with temporal changes in telomere length, an emerging marker of biological age.
Design, Setting, and Participants Prospective cohort study of 608 ambulatory outpatients in California with stable coronary artery disease recruited from the Heart and Soul Study between September 2000 and December 2002 and followed up to January 2009 (median, 6.0 years; range, 5.0-8.1 years).
Main Outcome Measures We measured leukocyte telomere length at baseline and again after 5 years of follow-up. Multivariable linear and logistic regression models were used to investigate the association of baseline levels of omega-3 fatty acids (docosahexaenoic acid [DHA] and eicosapentaenoic acid [EPA]) with subsequent change in telomere length.
Results Individuals in the lowest quartile of DHA+EPA experienced the fastest rate of telomere shortening (0.13 telomere-to-single-copy gene ratio [T/S] units over 5 years; 95% confidence interval [CI], 0.09-0.17), whereas those in the highest quartile experienced the slowest rate of telomere shortening (0.05 T/S units over 5 years; 95% CI, 0.02-0.08; P < .001 for linear trend across quartiles). Levels of DHA+EPA were associated with less telomere shortening before (unadjusted ? coefficient × 10?3 = 0.06; 95% CI, 0.02-0.10) and after (adjusted ? coefficient × 10?3 = 0.05; 95% CI, 0.01-0.08) sequential adjustment for established risk factors and potential confounders. Each 1-SD increase in DHA+EPA levels was associated with a 32% reduction in the odds of telomere shortening (adjusted odds ratio, 0.68; 95% CI, 0.47-0.98).
Conclusion Among this cohort of patients with coronary artery disease, there was an inverse relationship between baseline blood levels of marine omega-3 fatty acids and the rate of telomere shortening over 5 years.
Two Questions on the analysis of the saturated fat diet study. You mentioned that HDL and LDL size increases and VLDL size decreases were signs of improved insulin resistance. Didn’t you explain in past posts that particle size doesn’t matter, that is is all about count? Also, if size were to matter I get that a larger size HDL and LDL would be seen as improving but why with VLDL is smaller size seen as improving? My understanding was that all LDL starts its life as VLDL.
Thanks so much for the blog. I enjoy all the info.
Gerry
Great question, Gerry. Yes, size does not matter when it comes to getting sterols into the sub-endothelial space. A large apoB-carrying lipoprotein is no better or worse at this than a small one. BUT, size (in a drug naive person) is a marker for what is going on. Larger VLDL and smaller LDL particles often — but not always — suggest something bad is going on, almost always related to the over production of hepatic TG.
…..I worry a bit about oxidation in capsules. You could take the things for years…
I use the Carlson’s liquid now but am transitioning over to Paul Jaminet’s preference to just eat a pound of oily fish/ week. Gotta hedge your bets, baby (unless you are feeling lucky)
My understanding is omega-3 stability is provided by the biolayer.
Or, like a good portfolio, diversify your sources at least.
I only use capsules when I travel and am too lazy to bring small bottles of oil. I prefer the oil for many reasons, not the least of which is the cost. Your concern may be valid, also.
Peter,
“In the words of our good friend, Clint Eastwood, “Do you feel lucky?””
This is the logic used by the “diet heart” hypothesisers in 1970’s, ’80’s and ’90’s – arguing a position in advance of the data – in respect of saturated fat.
That style of logic (WRT sat fat) is regarded as wrong.
How may it be correct now? What happens if the data does not support your position?
Slainte
Are you suggesting the evidence implicating saturated fat as the cause of CHD is even in the same metaphysical category as the evidence implicating apoB- trafficking lipoproteins in CHD?
I still stand by my assertion. If you feel lucky, keep eating all the sugar in the world. The case against sugar and the case against saturated fat are very different. In fact, this week’s post will give you more detail about the SFA-CHD story than you’ll probably want to hear, but I’d urge you to contemplate that story with the current story.
Don’t confuse one very important distinction: Acquiring hard outcomes to set policy to drive a mass behavioral change vs. using the best available data PLUS common sense PLUS sound mechanistic understand to make a *personal* choice. These are very different. The SFA debacle was an example of the former; my caution on sugar is an example of the latter.
Ultimately, though, it is your choice. Hence my reference to Clint.
Awesome stuff, Doc. Helpful.
Regarding conclussion #4: 4.The addition of fat, in the absence of sugar and starch, does not raise serum triglycerides or other biomarkers of cardiovascular disease.
What about eating high fat in the presence of moderate or high carbs? I could be wrong, but I seem to recall that in their book “Protein Power” the Drs. Eades say that fat with carbs are a very bad combo, while in the Q & A section of “Why We Get Fat”, Gary Taubes says that fat is not bad no matter if it is in the presence of carbs or not.
Anyone know of good evidence one way or the other? I’ve been eating low carb for a couple years so it’s mainly just a curiosity thing for those rare moments when I decide to indulge in ice cream after a ribeye steak (I have a weakness for ice cream)!
Hey Peter, are you following the Tour de France?
Correct. It’s quite possible that high fat in the presence of sugar (e.g., ice cream, waffles with maple syrup, virtually all fast food) is “extra” bad. If it’s ice cream you crave, make it sugar free. I have a recipe floating around the comments section somewhere.
Hey Tony,
If it’s ice cream you crave there’s an excellent low carb/high fat option from So Delicious. Check out the “No Sugar Added” ones.
https://www.sodeliciousdairyfree.com/products/coconut-milk-ice-creams
A quick look at the (no sugar added) Butter Pecan flavor:
Serving Size 1/2 Cup (85g)
Calories 140
Calories from Fat 110
Total Fat 13g
Saturated Fat 7g
Total Carbohydrate 17g
Dietary Fiber 10g
Sugar 1g
Protein 1g
Dr. A, let me add to the many votes of support for what you are doing to educate us. I sincerely appreciate your work, your time, and your wife’s tolerance. I’ve become an avid reader, particularly of this series.
I have the impression, I believe from reading lipid researcher Mary Enig, that as a result of long-term consumption of an unhealthy ratio of omega-6:omega-3, our cell membrane structure can be compromised. I think she used the term “flabby.” Aside from sheer number of LDL particles, could this be part of the explanation for apoB-containing particle penetration of the endothelial wall?
Possible, certainly. Though I don’t think it’s about the ratio of n-6 to n-3, and more related to the absolute amount of 2 very important n-3’s: EPA and DHA. I’ll be doing a series on this at some point (soon) I hope.
“I only use capsules when I travel and am too lazy to bring small bottles of oil. I prefer the oil for many reasons, not the least of which is the cost.”
I have not supplemented omega-3 or fish oil for several years, but I do make sure to eat salmon or other fatty fish twice a week or so. I recently did a comprehensive Nutreval test and was happy to see that my RBC EPA and DHA were quite high (3.26% and 6.0% by weight respectively).
So it may not be necessary, or even desirable, to supplement for omega-3 fatty acids, depending on diet.
I’m no longer certain how much this matters, but my RBC % omega-3’s by weight was a high 12.5%, my AA/EPA was a low 5, and my omega 3 index was a high 9.2. I do avoid omega 6 oils as much as I can. Bill Lands would approve, I think. Not sure about Bill Harris.
Correct. Bill Lands and Bill Harris are on opposite sides of the n-6 argument. I’ve spent lots of time with both of them and will be assimilating the information for a series on this topic.