
Want to catch up with other articles from this series?
- The straight dope on cholesterol – Part I
- The straight dope on cholesterol – Part II
- The straight dope on cholesterol – Part III
- The straight dope on cholesterol – Part IV
- The straight dope on cholesterol – Part V
- The straight dope on cholesterol – Part VI
- The straight dope on cholesterol – Part VII
- The straight dope on cholesterol – Part VIII
- The straight dope on cholesterol – Part IX
Previously, across 8 parts of this series we’ve laid the groundwork to ask perhaps the most important question of all:
What should you eat to have the greatest chance of delaying the arrival of cardiovascular disease?
Before we get there, since this series has been longer and more detailed than any of us may have wanted, it is probably worth reviewing the summary points from the previous posts in this series (or you can just skip this and jump to the meat of this post).
What we’ve learned so far
- Cholesterol is “just” another fancy organic molecule in our body but with an interesting distinction: we eat it, we make it, we store it, and we excrete it – all in different amounts.
- The pool of cholesterol in our body is essential for life. No cholesterol = no life.
- Cholesterol exists in 2 forms – unesterified or “free” (UC) and esterified (CE) – and the form determines if we can absorb it or not, or store it or not (among other things).
- Much of the cholesterol we eat is in the form of CE. It is not absorbed and is excreted by our gut (i.e., leaves our body in stool). The reason this occurs is that CE not only has to be de-esterified, but it competes for absorption with the vastly larger amounts of UC supplied by the biliary route.
- Re-absorption of the cholesterol we synthesize in our body (i.e., endogenous produced cholesterol) is the dominant source of the cholesterol in our body. That is, most of the cholesterol in our body was made by our body.
- The process of regulating cholesterol is very complex and multifaceted with multiple layers of control. I’ve only touched on the absorption side, but the synthesis side is also complex and highly regulated. You will discover that synthesis and absorption are very interrelated.
- Eating cholesterol has very little impact on the cholesterol levels in your body. This is a fact, not my opinion. Anyone who tells you different is, at best, ignorant of this topic. At worst, they are a deliberate charlatan. Years ago the Canadian Guidelines removed the limitation of dietary cholesterol. The rest of the world, especially the United States, needs to catch up. To see an important reference on this topic, please look here.
- Cholesterol and triglycerides are not soluble in plasma (i.e., they can’t dissolve in water) and are therefore said to be hydrophobic.
- To be carried anywhere in our body, say from your liver to your coronary artery, they need to be carried by a special protein-wrapped transport vessel called a lipoprotein.
- As these “ships” called lipoproteins leave the liver they undergo a process of maturation where they shed much of their triglyceride “cargo” in the form of free fatty acid, and doing so makes them smaller and richer in cholesterol.
- Special proteins, apoproteins, play an important role in moving lipoproteins around the body and facilitating their interactions with other cells. The most important of these are the apoB class, residing on VLDL, IDL, and LDL particles, and the apoA-I class, residing for the most part on the HDL particles.
- Cholesterol transport in plasma occurs in both directions, from the liver and small intestine towards the periphery and back to the liver and small intestine (the “gut”).
- The major function of the apoB-containing particles is to traffic energy (triglycerides) to muscles and phospholipids to all cells. Their cholesterol is trafficked back to the liver. The apoA-I containing particles traffic cholesterol to steroidogenic tissues, adipocytes (a storage organ for cholesterol ester) and ultimately back to the liver, gut, or steroidogenic tissue.
- All lipoproteins are part of the human lipid transportation system and work harmoniously together to efficiently traffic lipids. As you are probably starting to appreciate, the trafficking pattern is highly complex and the lipoproteins constantly exchange their core and surface lipids.
- The measurement of cholesterol has undergone a dramatic evolution over the past 70 years with technology at the heart of the advance.
- Currently, most people in the United States (and the world for that matter) undergo a “standard” lipid panel, which only directly measures TC, TG, and HDL-C. LDL-C is measured or most often estimated.
- More advanced cholesterol measuring tests do exist to directly measure LDL-C (though none are standardized), along with the cholesterol content of other lipoproteins (e.g., VLDL, IDL) or lipoprotein subparticles.
- The most frequently used and guideline-recommended test that can count the number of LDL particles is either apolipoprotein B or LDL-P NMR, which is part of the NMR LipoProfile. NMR can also measure the size of LDL and other lipoprotein particles, which is valuable for predicting insulin resistance in drug naïve patients, before changes are noted in glucose or insulin levels.
- The progression from a completely normal artery to a “clogged” or atherosclerotic one follows a very clear path: an apoB containing particle gets past the endothelial layer into the subendothelial space, the particle and its cholesterol content is retained, immune cells arrive, an inflammatory response ensues “fixing” the apoB containing particles in place AND making more space for more of them.
- While inflammation plays a key role in this process, it’s the penetration of the endothelium and retention within the endothelium that drive the process.
- The most common apoB containing lipoprotein in this process is certainly the LDL particle. However, Lp(a) and apoB containing lipoproteins play a role also, especially in the insulin resistant person.
- If you want to stop atherosclerosis, you must lower the LDL particle number. Period.
- At first glance it would seem that patients with smaller LDL particles are at greater risk for atherosclerosis than patients with large LDL particles, all things equal.
- “A particle is a particle is a particle.” If you don’t know the number, you don’t know the risk.
- With respect to laboratory medicine, two markers that have a high correlation with a given outcome are concordant – they equally predict the same outcome. However, when the two tests do not correlate with each other they are said to be discordant.
- LDL-P (or apoB) is the best predictor of adverse cardiac events, which has been documented repeatedly in every major cardiovascular risk study.
- LDL-C is only a good predictor of adverse cardiac events when it is concordant with LDL-P; otherwise it is a poor predictor of risk.
- There is no way of determining which individual patient may have discordant LDL-C and LDL-P without measuring both markers.
- Discordance between LDL-C and LDL-P is even greater in populations with metabolic syndrome, including patients with diabetes. Given the ubiquity of these conditions in the U.S. population, and the special risk such patients carry for cardiovascular disease, it is difficult to justify use of LDL-C, HDL-C, and TG alone for risk stratification in all but the most select patients.
- To address this question, however, one must look at changes in cardiovascular events or direct markers of atherosclerosis (e.g., IMT) while holding LDL-P constant and then again holding LDL size constant. Only when you do this can you see that the relationship between size and event vanishes. The only thing that matters is the number of LDL particles – large, small, or mixed.
- HDL-C and HDL-P are not measuring the same thing, just as LDL-C and LDL-P are not.
- Secondary to the total HDL-P, all things equal it seems smaller HDL particles are more protective than large ones.
- As HDL-C levels rise, most often it is driven by a disproportionate rise in HDL size, not HDL-P.
- In the trials which were designed to prove that a drug that raised HDL-C would provide a reduction in cardiovascular events, no benefit occurred: estrogen studies (HERS, WHI), fibrate studies (FIELD, ACCORD), niacin studies, and CETP inhibition studies (dalcetrapib and torcetrapib). But, this says nothing of what happens when you raise HDL-P.
- Don’t believe the hype: HDL is important, and more HDL particles are better than few. But, raising HDL-C with a drug isn’t going to fix the problem. Making this even more complex is that HDL functionality is likely as important, or even more important, than HDL-P, but no such tests exist to “measure” this.
Did you say “delay?”
That’s right. The question posed above did not ask how one could “prevent” or eliminate the risk cardiovascular disease, it asked how one could “delay” it. There is a difference. To appreciate this distinction, it’s worth reading this recent publication by Allan Sniderman and colleagues. Allan sent me a copy of this paper ahead of publication a few months ago in response to a question I had posed to him over lunch one day. I asked,
“Allan, who has a greater 5-year risk for cardiovascular disease, a 25 year-old with a LDL-P/apoB in the 99th percentile or a 75-year-old with a LDL-P/apoB in the 5th percentile?”
The paper Allan wrote is noteworthy for at least 2 reasons:
- It’s an excellent reminder that age is a paramount risk factor for cardiovascular disease.
- It provides a much better (causal) model for atherosclerosis than the typical age-driven models, and explains why age is an important risk factor.
What do I mean by this? Most risk calculators (e.g., Framingham) take their inputs (e.g., age, gender, LDL-C, HDL-C, smoking, diabetes, blood pressure) and calculate a 10-year risk score. If you’ve ever played with these models you’ll quickly see that age drives risk more than any other input. But why? Is there something inherently “risky” about being older?
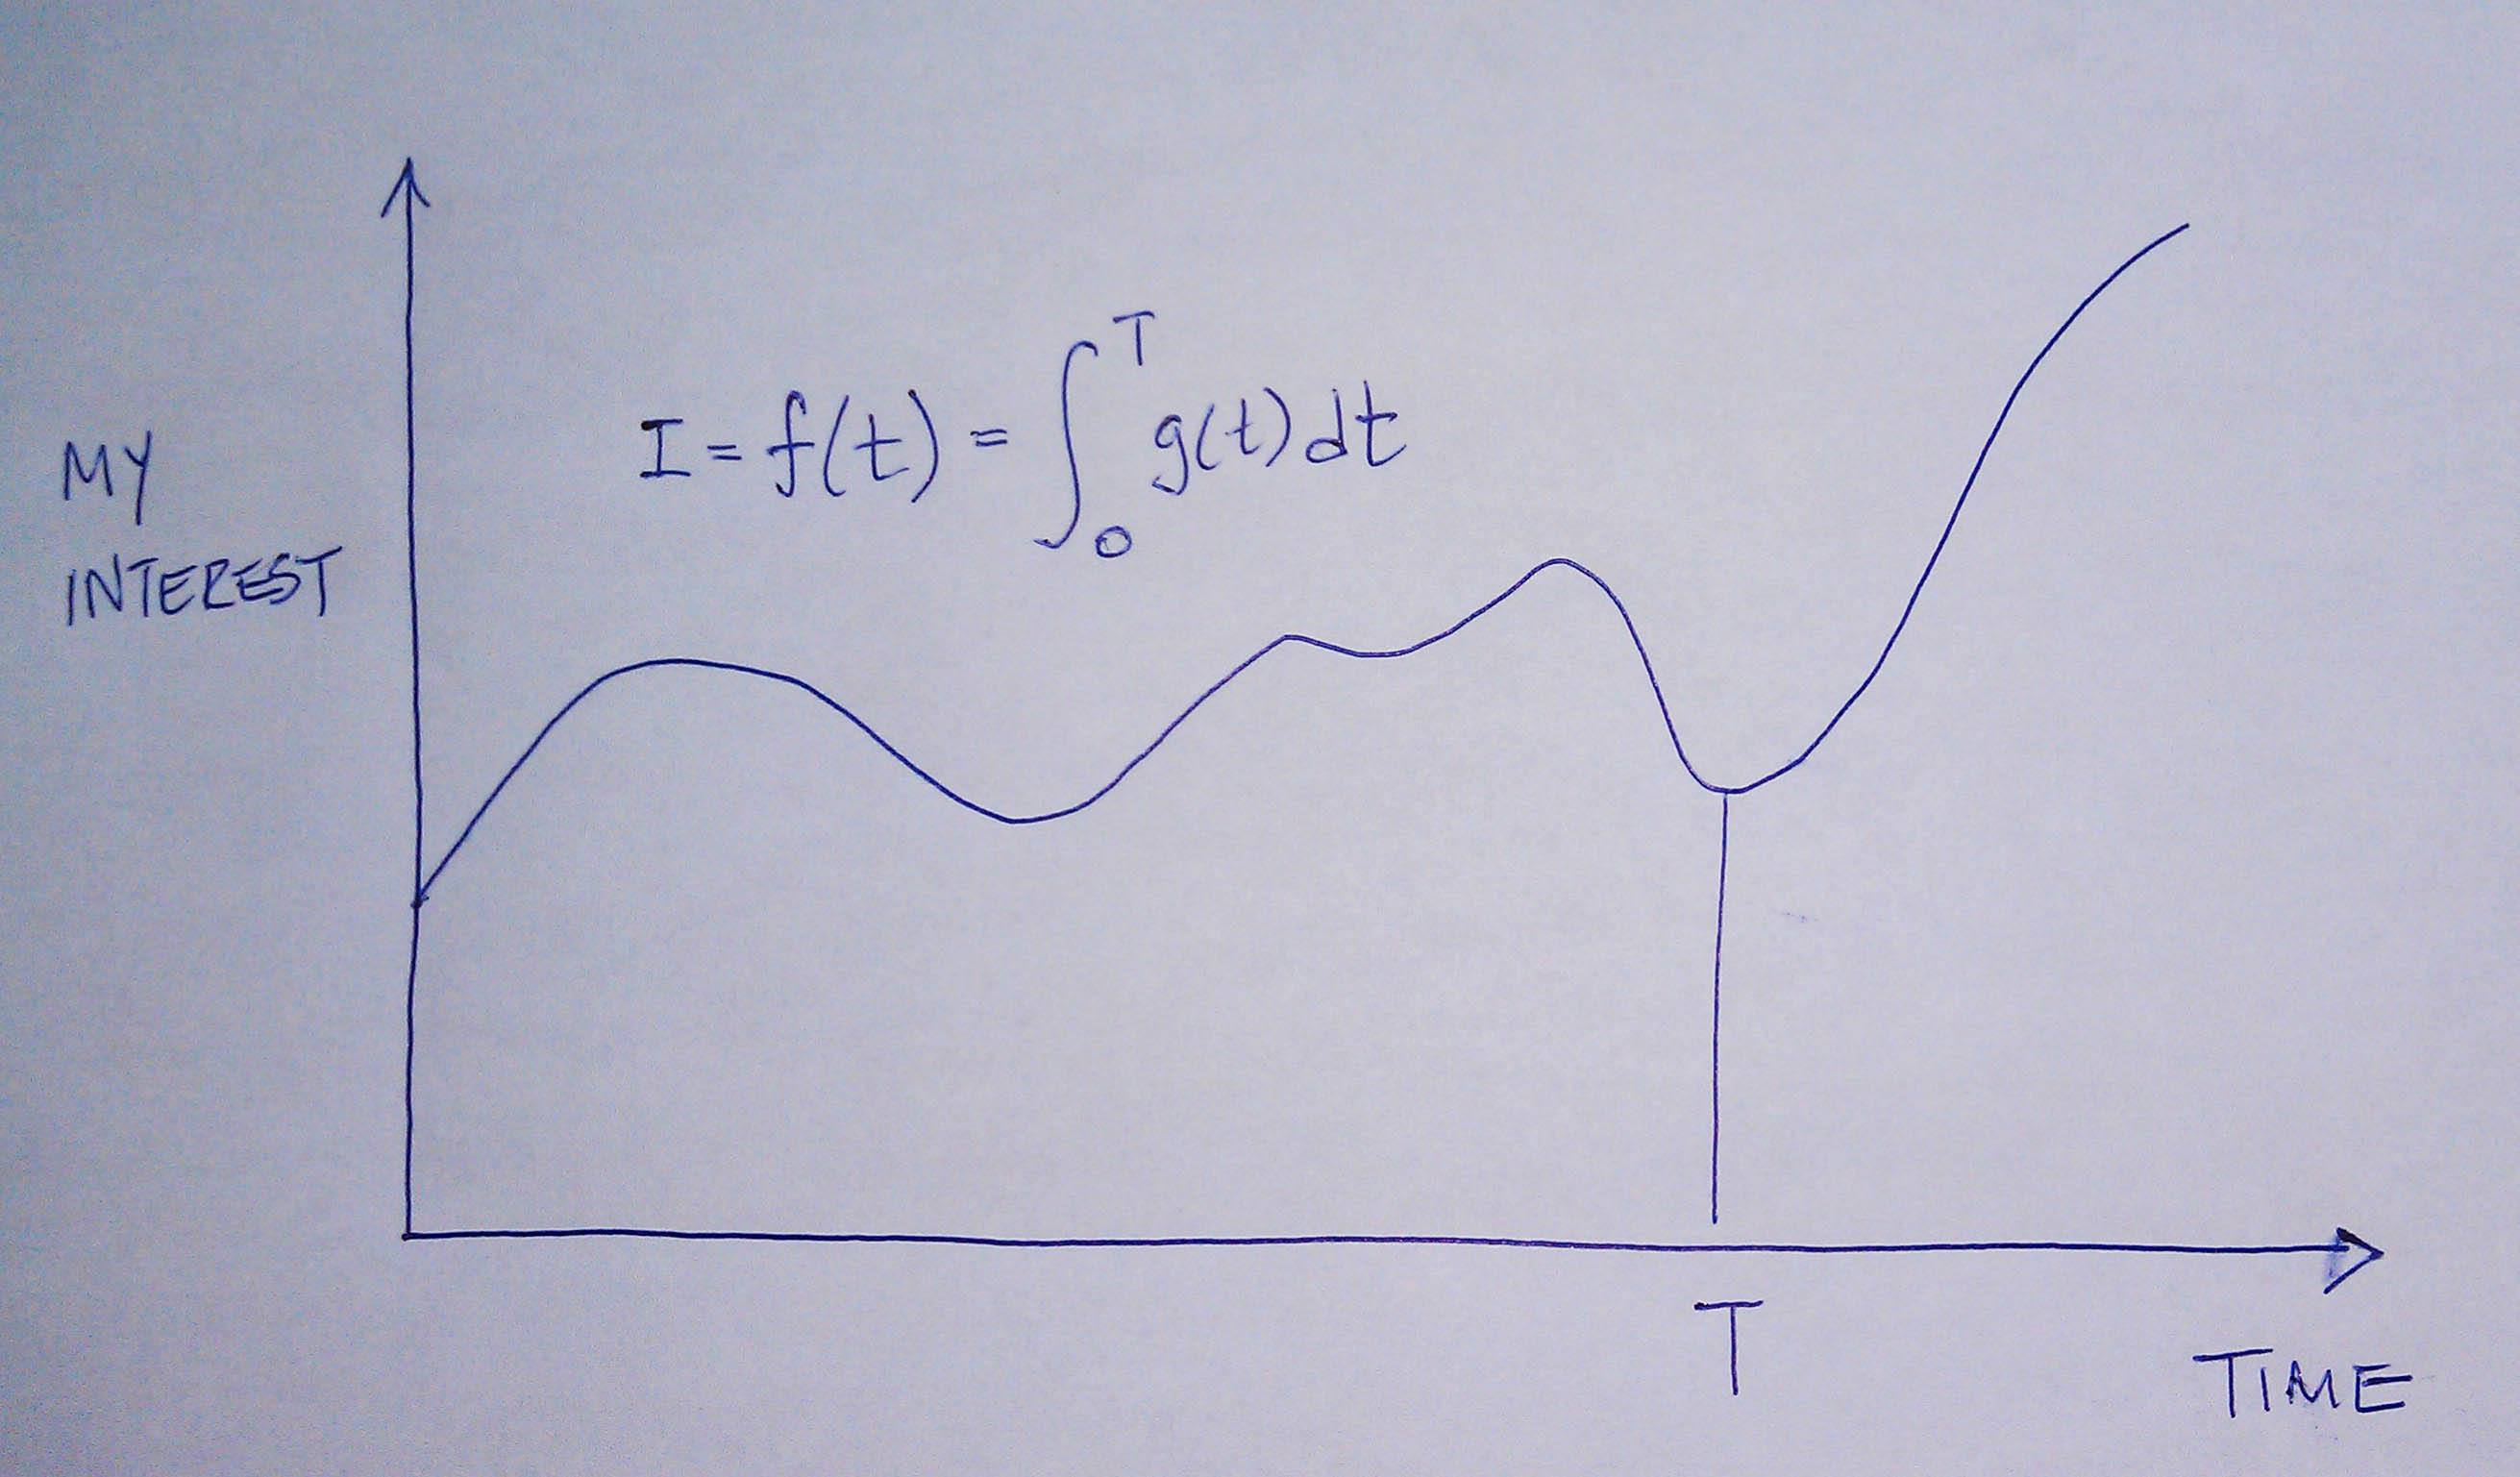
Sniderman and many others would argue (and I agree) that the reason age is a strong predictor of risk has to do with exposure to apoB particles — LDL, Lp(a), and apoB-carrying remnants. Maybe it’s because I’m a math geek, but such models just seem intuitive to me because I think of most things in life in terms of calculus, especially integrals, the “area under a curve.”
[I once tried to explain to a girlfriend who thought I wasn’t spending enough time with her that my interest in her should be thought of in terms of the area under the curve, rather than any single point in time. That is, think in terms of the integral function, not the point-in-time function. Needless to say, she broke up with me on the spot (in the middle of a parking lot!), despite me drawing a very cool picture illustrating the difference, which I’ve re-created, below.]
The reason age is such a big driver of risk is that the longer your artery walls are exposed to the insult of apoB particles, the more likely they are to be damaged, for all the reasons we covered in Part IV of this series. [This paper also reviews the clinical situation of PCSK9 mutations which builds a very compelling case for the causal model of apoB particles in the development of atherosclerosis].
What does eating have to do with cardiovascular risk?
So now that everyone is on the edge of their seat in anticipation of this punch-line, let me provide two important caveats.
First, there are no long-term studies – either in primary or secondary prevention – examining the exact question we all want to know the answer to with respect to the role of dietary intervention on cardiovascular disease. There are short-term studies, some of which I will highlight, which look at proxies for cardiovascular disease, but all of the long-term studies (looking at secondary prevention), are either drug studies or multiple intervention studies (e.g., cholesterol-lowering drug(s) + blood pressure reducing drug(s) + dietary intervention + exercise + …).
In other words, the “dream” study has not been done and won’t be done for a long time. The “dream” study would follow 2 randomized groups for many years and only make one change between the groups. Group 1 would consume a standard American diet and group 2 would consume a very-low carbohydrate diet. Furthermore, compliance within each group would be excellent (many ways to ensure this, but none of them are inexpensive – part of why this has not been done) and the study would be powered to detect “hard outcomes” (e.g., death), instead of just “soft outcomes” (e.g., changes in apoB, LDL-C, LDL-P, TG).
Second, everything we have learned to date on the risk relationship between cardiovascular disease and risk markers is predicated on the assumption that a risk maker of level X in a person on diet A is the same as it would be for a person on diet B.
Since virtually all of the thousands of subjects who have made up the dozens of studies that form the basis for our understanding on this topic were consuming some variant of the “standard American diet” (i.e., high-carb), it is quite possible that what we know about risk stratification is that this population is not entirely fit for extrapolation to a population on a radically different diet (e.g., a very-low carbohydrate diet or a ketogenic diet). Many of you have asked about this, and my comments have always been the same. It is entirely plausible that an elevated level of LDL-P or apoB in someone consuming a high-carb diet portends a greater risk than someone on a ketogenic or low-carb diet. There are many reasons why this might be the case, and there are many folks who have made compelling arguments for this hypothesis.
But we can’t forget the words of Thomas Henry Huxley, who said, “The great tragedy of science is the slaying of a beautiful hypothesis by an ugly fact.” Science is full of beautiful hypothesis slayed by ugly facts. Only time will tell if this hypothesis ends up in that same graveyard, or changes the way we think about lipoproteins and atherosclerosis.
The role of sugar in cardiovascular disease
Let’s start with what we know, then fill in the connections, with the goal of creating an eating strategy for those most interested in delaying the onset of cardiovascular disease.
There are several short-term studies that have carefully examined the impact of sugar, specifically, on cardiovascular risk markers. Let’s examine one of them closely. In 2011 Peter Havel and colleagues published a study titled Consumption of fructose and HFCS increases postprandial triglycerides, LDL-C, and apoB in young men and women. If you don’t have access to this journal, you can read the study here in pre-publication form. This was a randomized trial with 3 parallel arms (no cross-over). The 3 groups consumed an isocaloric diet (to individual baseline characteristics) consisting of 55% carbohydrate, 15% protein, and 30% fat. The difference between the 3 groups was in the form of their carbohydrates.
Group 1: received 25% of their total energy in the form of glucose
Group 2: received 25% of their total energy in the form of fructose
Group 3: received 25% of their total energy in the form of high fructose corn syrup (55% fructose, 45% glucose)
The intervention was relatively short, consisting of both an inpatient and outpatient period, and is described in the methodology section.
Keep in mind, 25% of total energy in the form of sugar is not as extreme as you might think. For a person consuming 2,400 kcal/day this amounts to about 120 pounds/year of sugar, which is slightly below the average consumption of annual sugar in the United States. In that sense, the subjects in Group 3 can be viewed as the “control” for the U.S. population, and Group 1 can be viewed as an intervention group for what happens when you do nothing more in your diet than remove sugar, which was the first dietary intervention I made in 2009.
Despite the short duration of this study and the relatively small number of subjects (16 per group), the differences brought on by the interventions were significant. The figure below shows the changes in serum triglycerides via 3 different ways of measuring them. Figure A shows the difference in 24-hour total levels (i.e., the area under the curve for serial measurements – hey, there’s our integral function again!). Figure B shows late evening (post-prandial) differences. Figure C shows the overall change in fasting triglyceride level from baseline (where sugar intake was limited for 2 weeks and carbohydrate consumption consisted only of complex carbohydrates).
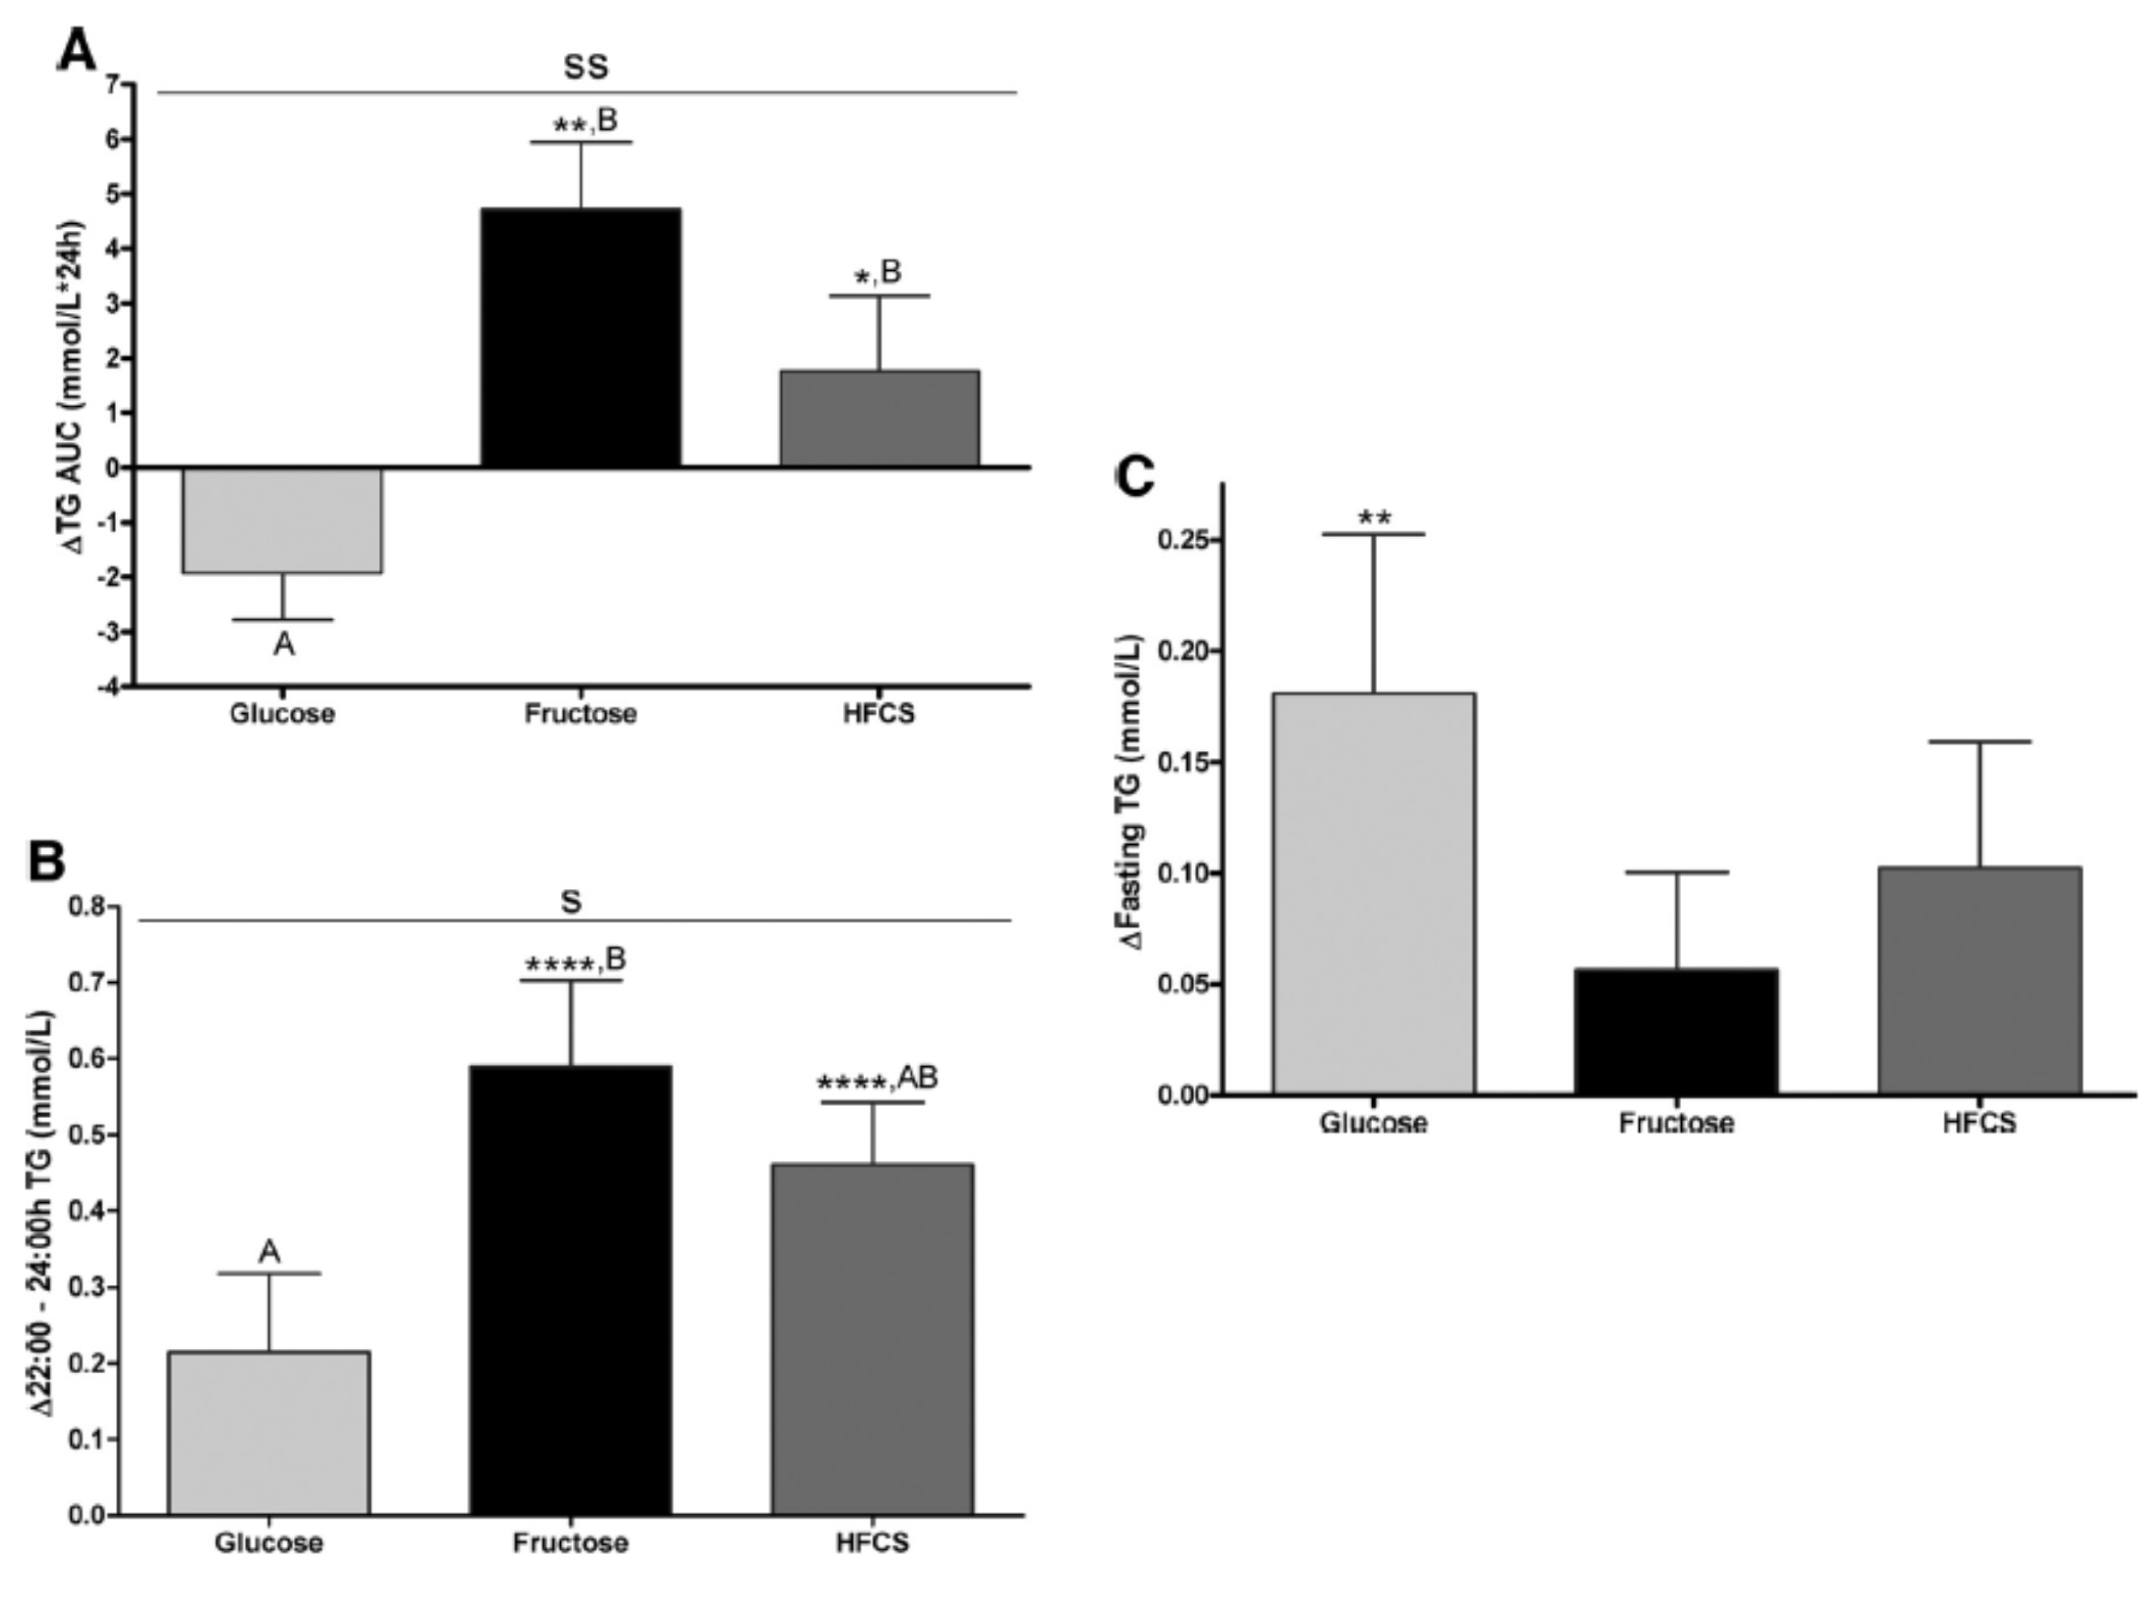
The differences were striking. The group that had all fructose and HFCS removed from their diet, despite still ingesting 55% of their total intake in the form of non-sugar carbohydrates, experienced a decline in total TG (Figure A, which represents the daily integral of plasma TG levels, or AUC). However, that same group experienced the greatest increase in fasting TG levels (Figure C). Post-prandial TG levels were elevated in all groups, but significantly higher in the fructose and HFCS groups (Figure B). The question this begs, of course, is which of these measurements is most predictive of risk?
Historically, fasting levels of TG are used as the basis of risk profiling (Figure C), and according to this metric glucose consumption appears even worse than fructose or HFCS. However, recent evidence suggests that post-prandial levels of TG (Figure B) are a more accurate way to assess atherosclerotic risk, as seen here, here, and here. One question I have is why did the AUC calculations in Figure A show a reduction in plasma TG level for the glucose group?
The figure below summarizes the differences in LDL-C, non-HDL-C, apoB, and apoB/apoA-I.
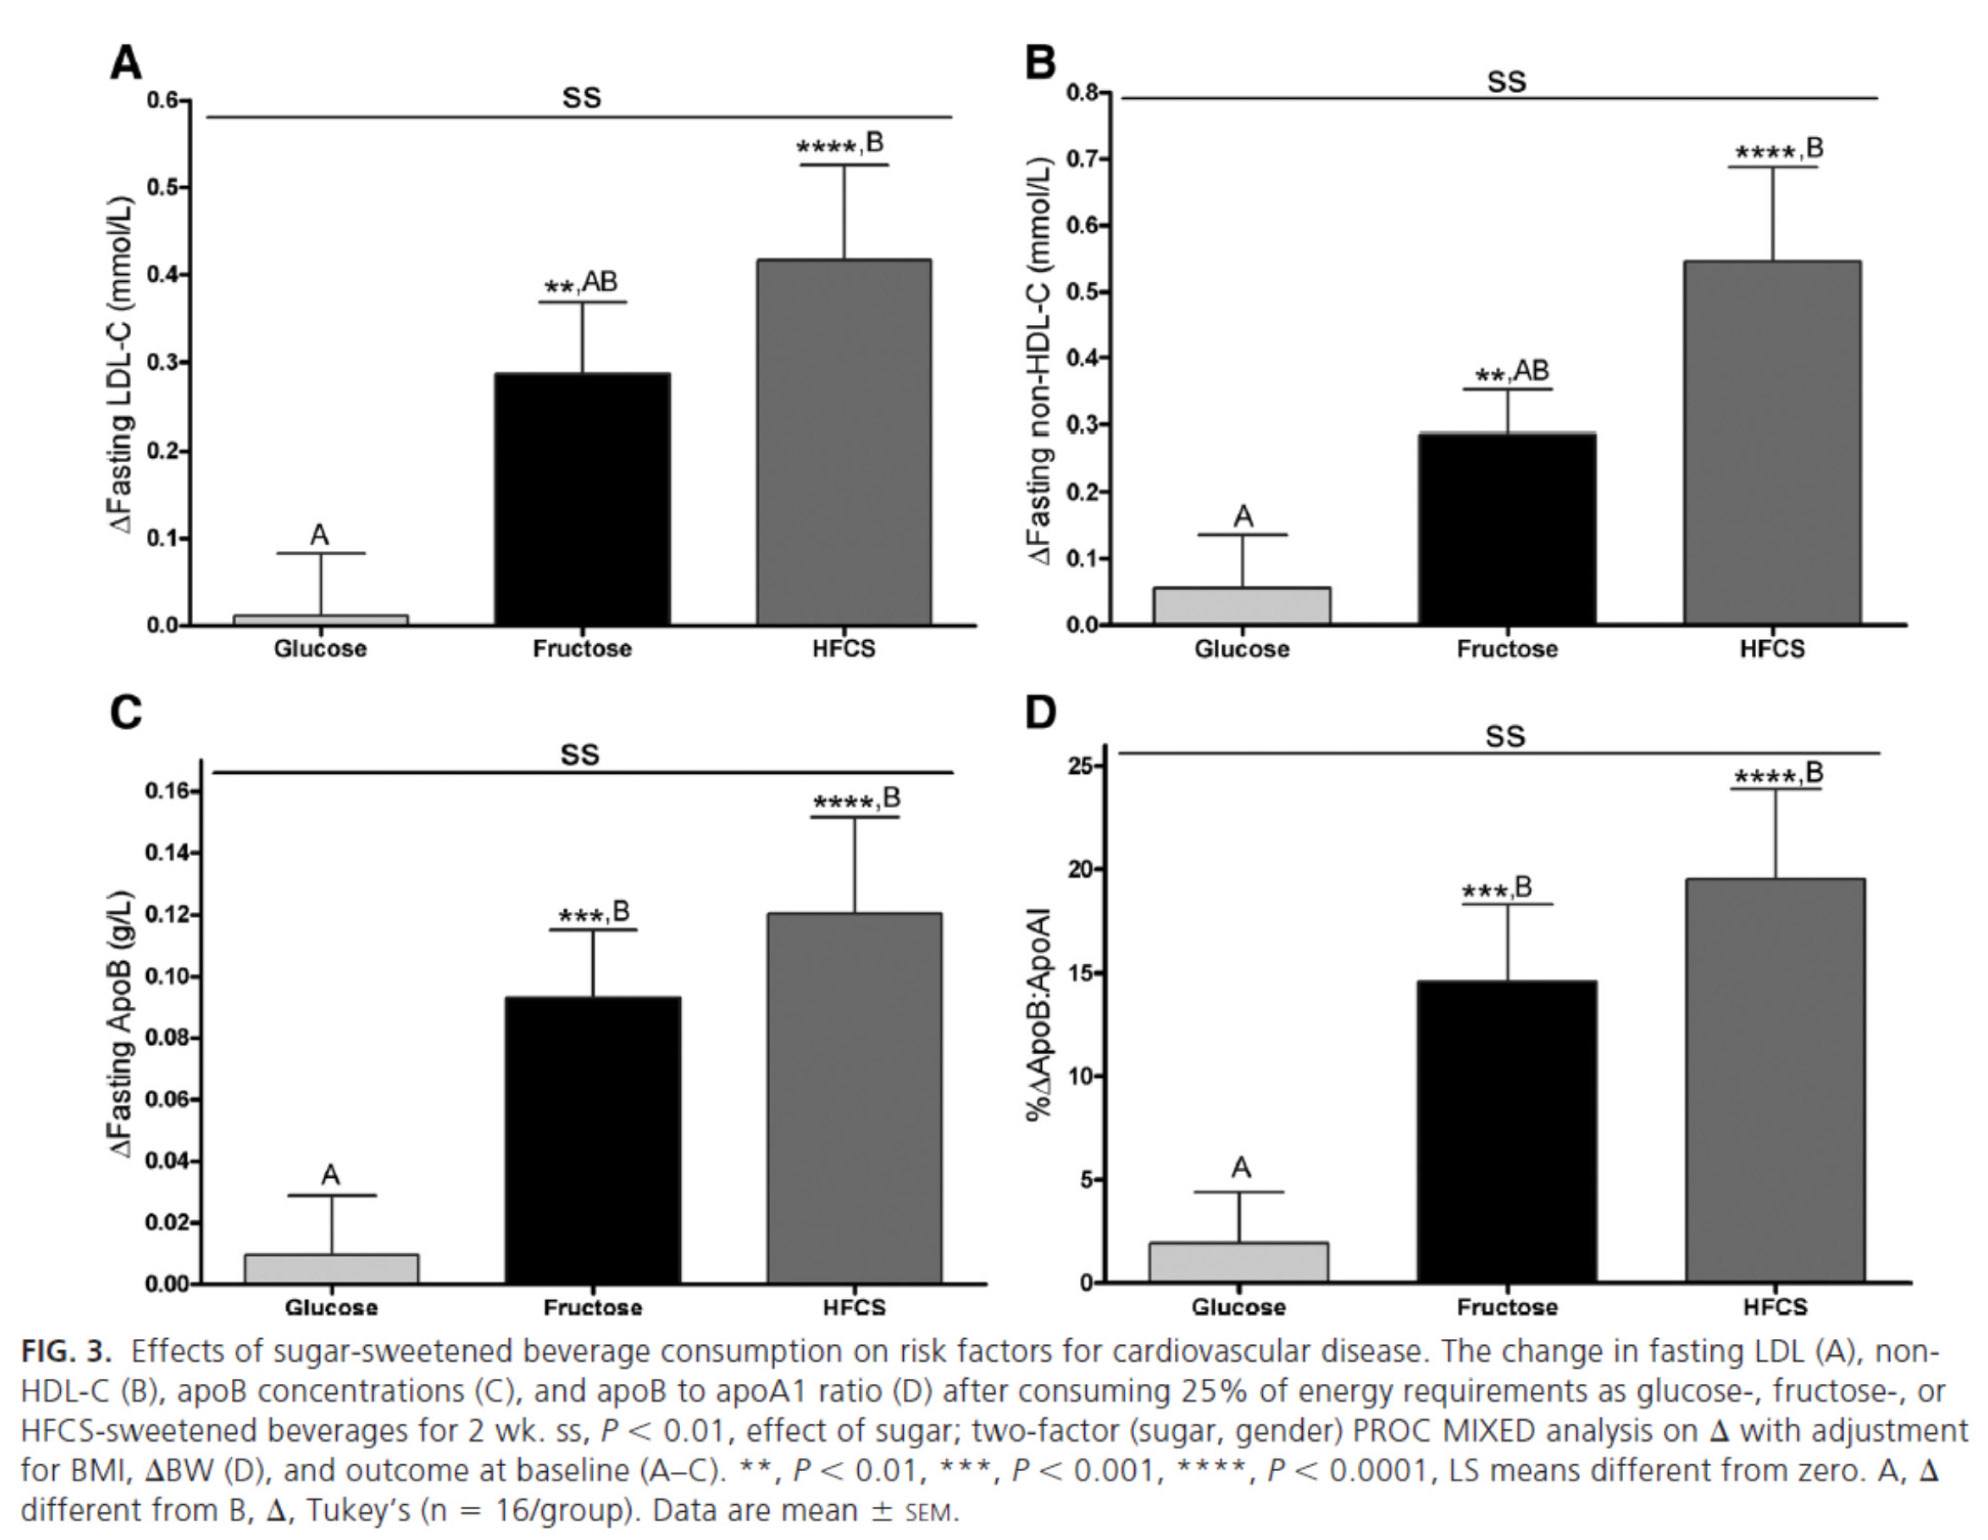
Again, the results were unmistakable with respect to the impact of fructose and HFCS on lipoproteins, and by extension, the relative lack of harm brought on by glucose in isolation. [Of course, removal of glucose and fructose/HFCS would have been a very interesting control group.]
One of the simultaneous strengths and weaknesses of this study was the heterogeneity of its subjects, who ranged in BMI from 18 to 35, in age from18 to 40, and in gender. While this provided at least one interesting example of age-related differences in carbohydrate metabolism (older subjects had a greater increase in triglycerides in response to glucose than younger subjects), it may have actually diluted the results. There were also significant differences between genders in the glucose group.
What was most interesting about this study was the clear difference between the 3 groups that was not solely a function of fructose load. In other words, the best outcome from a disease risk standpoint was in the glucose group, while the worst outcome was not in the all-fructose group, but in the 50/50 (technically 55/45) mixed group. This is a very powerful indication that while glucose and fructose alone can be deleterious in excess, their combination seems synergistically bad.
The role of saturated fat in cardiovascular disease
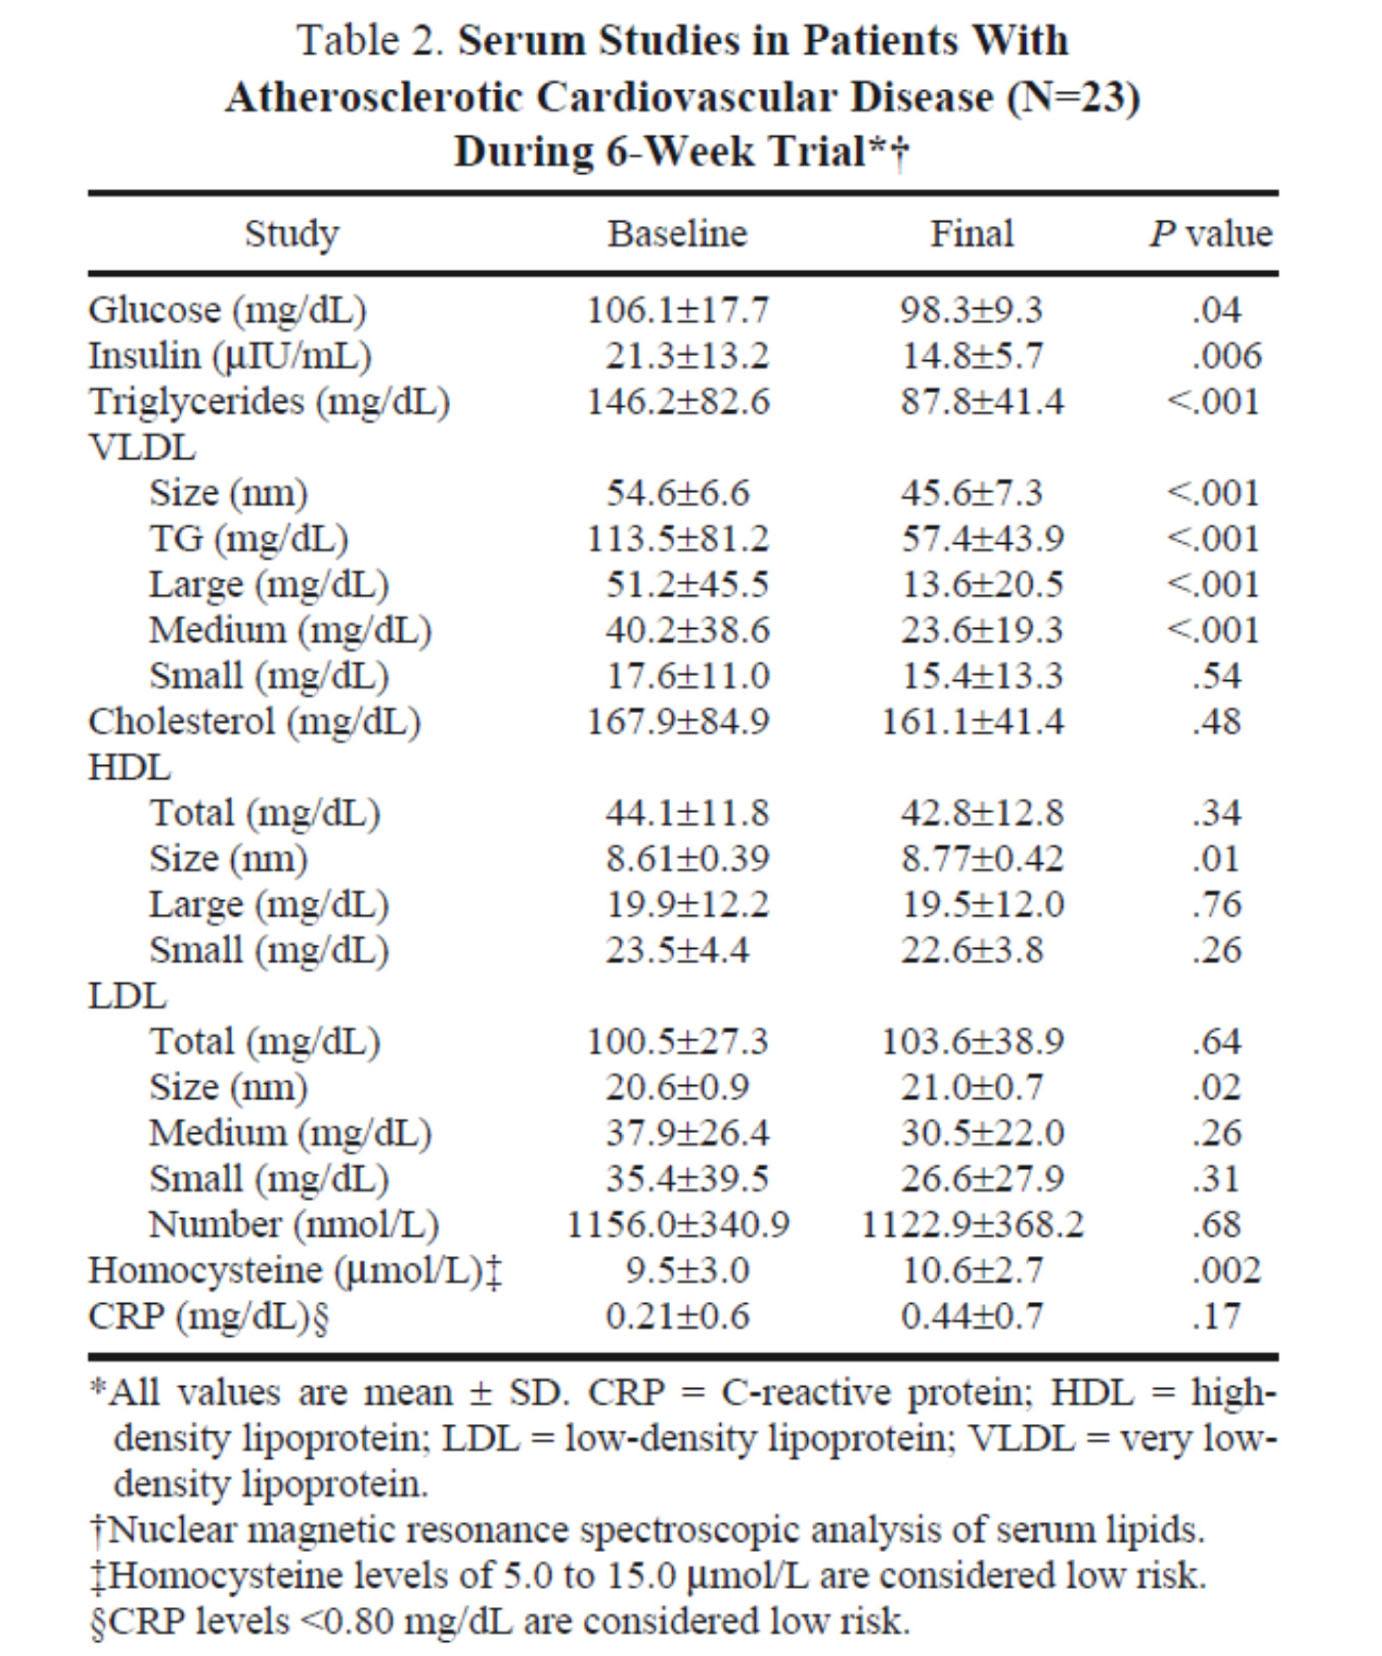
In the next week or two I’ll be posting an hour-long comprehensive lecture I gave at UCSD a few weeks ago on this exact topic. Rather than repeat any of it here, I’ll highlight one study that I did not include in that lecture. The study, Effect of a high saturated fat and no-starch diet on serum lipid subfractions in patients with documented atherosclerotic cardiovascular disease, published in 2003, treated 23 obese patients (average BMI 39) with known cardiovascular disease (status post coronary artery bypass surgery and/or stent placement) with a high-fat ketogenic diet. Because the study was free-living and relied on self-reporting, not all subjects had documented levels of elevated serum B-OHB. However, the subjects were instructed to avoid starch and consume 50% of their caloric intake via saturated fat, primarily in the form of red meat and cheese. There were no restrictions on fruits and vegetables, which may have accounted for the observation that not all subjects were ketotic during the 6-week intervention. In total, only 5 of the 23 patients achieved documented ketosis.
All of the subjects were on statins and entered the study at a goal LDL-C level target of 100 mg/dL, which may have been the only way the authors could get the IRB to approve such a study.
The table below shows the changes in lipoprotein fractions following the intervention (there was no control group):
This study was conducted during the height of the “outcry” over the Atkins diet. While most doctors reluctantly agreed that Dr. Atkins’ diet could reduce body fat, most believed it was still very dangerous. In the words of Dean Ornish, “Sure you can lose weight on a low-carb diet, but you can also lose weight on heroin and no one would recommend that!”
Fair point. In fact, the authors of this study acknowledged that they “strongly expected” this dietary intervention to increase risk for cardiovascular disease, which is why they only included subjects on statins with low LDL-C. However, as you can see from the table above, the authors were startled by the results. The subjects experienced a significant reduction in plasma triglycerides and VLDL triglycerides, without an increase in LDL-C or LDL-P. In fact, LDL size and HDL size increased and VLDL size decreased – all signs of improved insulin resistance. Furthermore, fasting glucose and insulin levels also decreased significantly. The mean HOMA-IR was reduced from 5.6 to 3.6 (normal is 1.0) and TG/HDL-C from 3.3 to 2.0 (normal is considered below 3, but “ideal” is probably below 1.0) in just 6 weeks. Taken together, these changes, combined with the dramatic change in VLDL size, suggest insulin resistance was dramatically improved while consuming a diet of 50% saturated fat!
As all of these patients were taking statins, we’re really robbed of seeing the impact of this diet on LDL-P, which did not change. Also, CRP levels rose (though not clinically or statistically significantly).
Putting it all together
It is very difficult to make the case that when carbohydrates in general, and sugars in particular, are removed or greatly reduced in the diet, insulin resistance is not improved, even in the presence of high amounts of saturated fats. When insulin resistance improves (i.e., as we become more insulin sensitive), we are less likely to have the signs and symptoms of metabolic syndrome. As we meet fewer criteria of metabolic syndrome, our risk of not only heart disease, but also stroke, cancer, diabetes, and Alzheimer’s disease goes down.
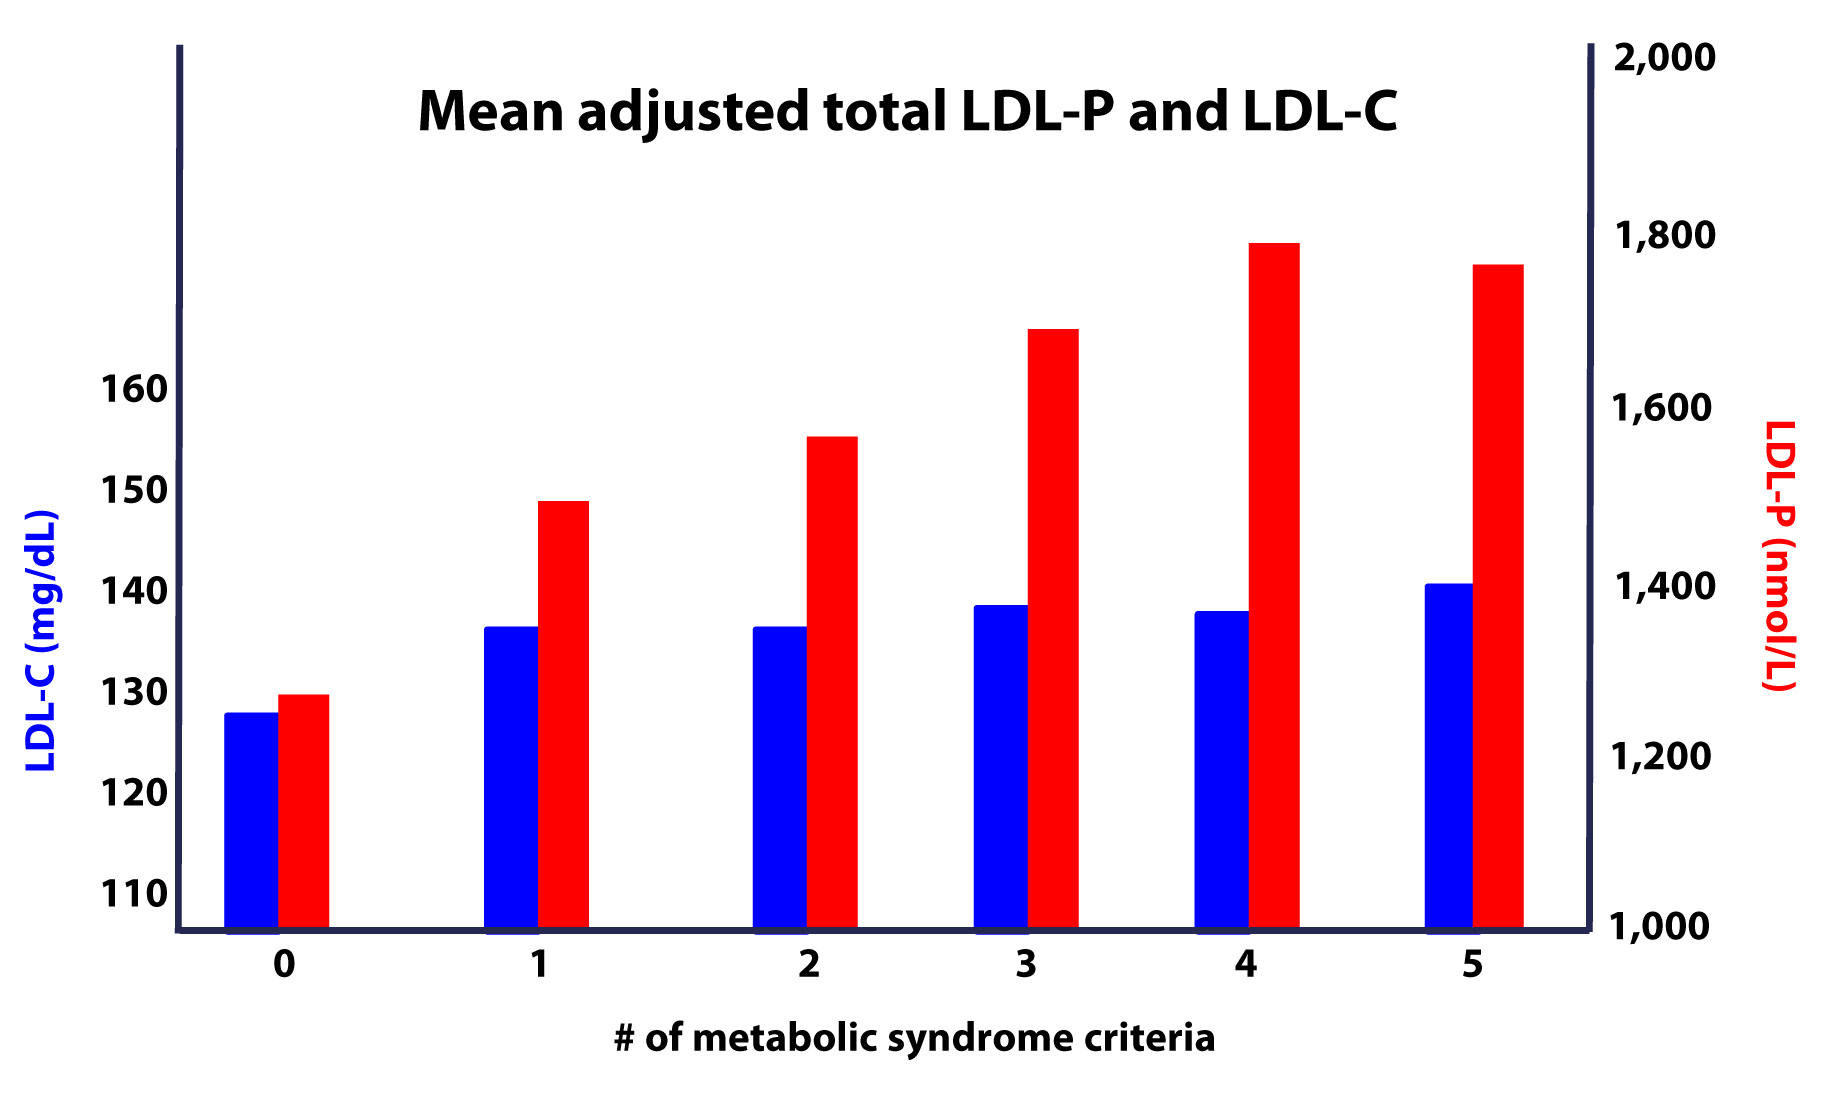
Furthermore, as this study on the Framingham cohort showed us, the more criteria you have along the spectrum of metabolic syndrome, the more difficult it becomes to predict your risk, due to a widening gap in discordant risk markers, as shown in this figure.
As I noted at the outset, the “dream” trial has not yet been done, though we (NuSI) plan to change that. Until then each of us has to make a decision several times every day about what we will and won’t put in our mouths. Much of this blog is dedicated to underscoring the impact of carbohydrate reduction on insulin resistance and metabolic syndrome.
The results of the trials to date, combined with a nuanced understanding of the lipoprotein physiology and their role on the atherosclerotic disease process, bring us to the following conclusions:
- The consumption of sugar (sucrose, high fructose corn syrup) increases plasma levels of triglycerides, VLDL and apoB, and reduces plasma levels of HDL-C and apoA-I.
- The removal of sugar reverses each of these.
- The consumption of fructose alone, though likely in dose-dependent fashion, has a similar, though perhaps less harmful, impact as that of fructose and glucose combined (i.e., sugar).
- The addition of fat, in the absence of sugar and starch, does not raise serum triglycerides or other biomarkers of cardiovascular disease.
- The higher the level of serum triglycerides, the greater the likelihood of discordance between LDL-C and LDL-P (and apoB).
- The greater the number (from 0 to 5) of inclusion criteria for metabolic syndrome, the greater the likelihood of discordance between LDL-C and LDL-P (and apoB).
I would like to address one additional topic in this series before wrapping it up – the role of pharmacologic intervention in the treatment and prevention of atherosclerotic disease, so please hold off on questions pertaining to this topic for now.


Hey Peter,
I was wondering if you’ve ever given any though to coming up with any nutribullet recipes. I just recently bought one to blend my bulletproof coffee. I just don’t know enough about food and nutrition to come up with my own. Making a quick list of 6 or 7 low carb vegetables and maybe 2 or 3 lowest sugar fruits. There’s gotta be some great tasting things that could benefit people to make the HFLC experience a little better. I’ve got about 6 people following the HFLC and people are always asking what I do. I’m trying to think of something to add to the FAGE yogurt to blend for a snake too. Give me your thoughts and move this thread to the appropriate sub section of your blog. I didn’t know where the best place was to pose this question.
Thanks
Have not.
An update to my previous post about elevated LDL – P and LDL numbers. This is very interesting and could be the cause of my not so good results. I think this could have very well affected my results because I did drink coffee with heavy cream and splenda everyday leading up to my test. Here’s the link:
https://www.infobarrel.com/Can_You_Drink_Coffee_Before_a_Cholesterol_Test
Hope this helps.
This is an awesome site and article. It’s so cool to find people that are just genuinely interested in things and enjoy thinking. I’ve developed a huge interest in nutrition recently (age 26) because I was raised on really bad food and am just now really doing everything in my power to change my habits. But to find research like this is just wonderful.
I’m doing an experiment right now… cutting all wheat out and all sugar except for some high cocoa dark chocolate occasionally. I haven’t been worrying about fat in it’s most natural forms such as meats, eggs and dairy… and have upped my vegetable intake from occasionally to multiple times a day.
I am no scientist, I didn’t even go to college. (I make music videos and want to direct feature films), but I think that what I am eating now is a big improvement, and I can feel it both mentally and physically (whether it be placebo or not). At least a step in the right direction by eating REAL foods.
Thanks for this site, and keep doing what you’re doing.
Is Part X published yet?
Not yet…
Fascinating and insightful set of articles. Like you, I am a surgeon, and I applaud your effort at educating the public about this complex issue. I, for one, an just learning, via your site, about the nuances of lipid mgmt, so a big thanks to you.
Throughout this execelent series there is no mention of the form cholesterol sulfate. It is produced at the skin layer with the production of vitamin D sulfate. Are the two of them water soluable? and if so, can they transport in blood without a protein vessel?
Hi Peter,
I’m sure lots of us are anxiously waiting for your take on increase in LDL-C and LDL-P on a low carb diet.
Regards
Excellent series, Peter. Thank you for all the efforts in research, writing and generously sharing with us on your blog. I also enjoyed your TED talk.
I am a physician (neurologist) based in London (England). As per previous poster, I was alarmed by my personal lipid profile: high LDL (calculated, not NMR – though I’m planning to travel to USA if needed to get the test done), though good levels of HDL (high) and TG (low). This is against a background of good lifestyle, lean, active, etc, and in fact a move towards ‘Paleo’ type diet in the past 2 years. In your reply to the previous poster, you mentioned writing an article on this pattern of lipid profile. Have you written it yet?
Keep up the good work! Will make a donation now to NuSI (just need to find the link now…). Best regards, Sui
Donation done! Easy to find on google search
https://nusi.org/donate/#.UpRQMGSgZhN
Towards rigorous research in questions that matter!
Sui, thanks very much. Greatly appreciated.
I have not yet, Sui. It will be part X of this series. I will get to it…
Hi again Peter. Many good wishes for 2014! I am looking forward to Part X…. 😉
Meanwhile, following on from my earlier post, my n=1 numbers raises some questions about LDL-P perhaps? I was surprised when my basic cholesterol panel suggested a worryingly high LDL (a new finding since switching to a Paleo-style eating about 2 years ago) – Surprising because I am lean and have a ‘clean’ lifestyle with eating/ training (almost daily training with either strength/ intervals/ yoga etc). I thought it might be spurious because of LDL done by estimation/calculation rather than direct measurement, so I got a more extensive test including NMR done. The results, just back, show:
LDL-C 158 mg/dL (ref 39)
TG 32 mg/dL (ref <150)
total Cholesterol 252 (ref <200)
Particle concentration & size by NMR:
LDL-P 1402 nmol/L (ref 34.9)
LDL-size 21.8 (large pattern A)
Lp(a) 17 mg/dL (ref <30)
Insulin Resistance Score by lipid fractionation is 7.3)
LDL S 116 nmol/L (ref <117)
VLDL L <0.8 nmol/L (ref 9.6)
LDL size 21.8 nm (ref >21.2)
LpPLA2 (PLAC) 218 ng/dL(ref <200)
I'm not sure what to make of the high LDL-P but an good LDL size. Hence Looking forward to Part X…. Will pledging another donation to NuSI be a good incentive?!? 🙂
Reposting numbers because for some strange reason, I type it correctly on my screen but what I see after hitting ‘add comment’ button seem altered… Some clarifications:
LDL-C 158
HDL-C 88
TG 32
total Cholesterol 252
Particle concentration & size by NMR:
LDL-P 1402
HDL-P 32.6
LDL-size 21.8 (large pattern A)
Lp(a) 17
Insulin Resistance Score by lipid fractionation is <25 (Optimal)
HDL L 14.1
LDL S 116
VLDL L <0.8
HDL size 10.1
LDL size 21.8
LpPLA2 (PLAC) 218
My 18 year old daughter has high triglycerides and is insulin resistant and I came across some interesting info and I was wondering if there is any truth in the following:
Basic Diet Adjustments for Insulin Improvement
The absolute worst possible dietary pattern of eating for a type 2 diabetic IS THE STANDARD DIET ADVICE GIVEN BY DIETICIANS AND DOCTORS ACROSS THIS COUNTRY FOR ALMOST ALL TYPE 2 DIABETIC PATIENTS, which helps lock in a national epidemic of type 2 diabetes. They routinely tell individuals to snack in order to maintain their blood sugar levels and to “stoke” their metabolism with fuel.
In normal health, when you haven’t eaten for three hours, insulin levels return to a baseline. Now your pancreas makes a different hormone called glucagon. This hormone tells your liver to release the sugar (glycogen) it has stored to sustain your blood sugar levels, and as it does this it turns on your liver’s fat burning system. Thus, under the influence of glucagon your liver simultaneously uses sugar and fat to sustain your blood sugar – a true fat burning time that helps clear up stagnating levels of triglycerides in your blood.
If you snack on anything surpassing 30 calories you will raise insulin, which automatically turns off glucagon, causes fat burning to stop, and blunts the use of sugar that has been stored in your liver. However, since you haven’t used the stored sugar in your liver, then insulin can’t put more sugar back in your liver as it normally would, meaning it will readily turn blood sugar into fat (even if you snacked on something with no fat).
Don’t know who to trust anymore. Even her nutritionist said to eat every 3 hours.
Andrea, I think you will find the book by Dr. Richard Bernstein on this topic particularly helpful.
Randy,
I wanted you to know that i started the Keto Diet, on Aug 1st and checked my cholesterol 3 months later and i worked out with weight training 6 days a week and HIIT 3 days a week. My HDL stayed the same. Triglycerides dropped from 85 to 72 but my Ldl went from 130 to 207. Total Cholesterol went from 205 to 284. so i too went and had the NMR test…hoping that the calculations were wrong. They weren’t sad to say. In fact the LDL-P number was off the chart. very high is over 2000, mine was 2843. all other numbers were good. The test was very detailed.
So i just wanted you to know that exercise may not be the culprit in your situation. I am now doing a new test for the next 3 months in which i eat the same diet however i will eat “healthy fats” and also add 1/3 cup of oat bran to my diet. I believe that is only 24 grams of carbs , so i should stay in Ketosis.
I have never felt better in my life. I tell people that i no longer am held hostage by the cravings of that of carb eaters. I eat vegetables with every meal for the little carbs i do eat. I also feel euphoric often, seems to be mostly after large amounts of greens. I don’t drink coffee but i do drink Pu-er tea…a lot actually, about 100 oz per day
I too have leveled out on my weight. although i didn’t lose as much as you did. i went from 197-177. i am 6’3″ and vary from 177 – 181 throughout the week. for over 2 months now. This weight feels good but i think it would be fun to experiment with lower body fat percentages.
My biggest hope is that being on a ketogenic diet, i will not need to worry about ldl-p as much as those on a high carb diet. however i don’t think i should roll the dice until we learn more.
Looking forward to X
Thanks for everything Peter!!
It Would Seem………..
…………………………………
……………………….
Measuring Oxidation and Inflamation within all cell’s and lipids of the body would be a good idea – particullary the Liver – Bloodstream and Under/outer/layer itself of the endothelium and
discover whatever processes are cuasing such – wether external or internal –
this should be a part of a standard blood test
The patient should be able to ask – how many oxidized LDL – LDL-P and what’s up with the Inflamation ? and get a simple anwser – or and how fast are my LDL-P being cleared by the liver or some other way ?
A salient question I might ask is – do these parameters differ in people who never have soft-plaque build-up/heart-attacks and people who do ?
One confounding idea being floated around is that half the people who suffer heart attacks have normal cholesterol –
the confounding thing about this is – there are far more people with normal cholesterol numbers and fewer people with abnormal numbers – if you think about this a bit you will see the confounding involved – in other words – you need to know the percentage of all people with normal ‘numbers’ who sufffer heart trouble and the pertcentage of those with ‘abnormal’ numbers who suffer heart trouble and I do not think it’s any where near 50/50
Hi Peter
Thanks for the great info. I’ve searched around here and a few other places but can’t find much on my two simple questions – ok simple to ask, but not simple to answer!
1) Why did my cholesterol go up so much after starting a Paleo type diet?
– I eat a pretty clean “paleo-type” diet – (daily coffee and gin n tonic though). However my cholesterol went up from 188 to 260 (tested 1 yr. after changing diet, and 2x since) HDL went from 58 to 93, but LDL (calculated) went from 114 to 61. Trigs went from 80 to 36.
– I lift heavy weights 3 x week, run 2x week, some high intensity interval training
– My doctor disregards the positive movement on HDL and trigs (see below). I’m going to have the detailed lipo panel done by WellnessFX next.
Is there something I’m missing? I would have thought the LDL would improve or at least stay in range
2) Is there an authoritative cholesterol resource that my GP doctor would trust that might set him on the road to asking more questions and challenging the “statins first” mantra. I just saw him this morning. here’s my experience if anyone’s interested
– He advised going on statins within 30 seconds of walking in – without asking me about my exercise or diet
– If I had side effects on statins, he would keep changing them until he found one until the side effects ceased
– The doctor, his mother and father all are on statins
– Statins result in 30-40% reduction in risk for patients without priorheart disease
– Eat less saturated fat than I am eating – no coconut oil or butter. Substitute canola oil. Olive oil is good though
– My high HDL is good, but he’s more concerned with high LDL.
– Framingham heart study repeated as source of his advice
– Some processed foods are OK to eat – no elaboration on what kinds though
– He said the LDL particle size tests are useless since you wouldn’t do anything different. He compared it the ‘useless” CRP tests
Besides getting a new doctor, I feel compelled to at least provide him a little information to see if he will become more skeptical about common wisdom. I might try Cholesterol Clarity (which I suspect he would dismiss) but was wondering if you had a good starting point for a doctor. These are the people we need to be learning this!
Thanks again to everybody for the learning.
Oh, and my stats
53 year old male, my weight stayed pretty much the same (165 lbs ) – I did lose an inch off my waist, but weight reduction is not my goal
It was not until I dumped all dairy and meat from my diet that I was able to reach a healthy BMI, BP, total cholestoral dropped from 214 to 152 (LDL dropped from 131 to 76) and I am no longer medicated for gout. This begs the question that sources of dietary cholesterol had an impact on the cholestoral levels in my body. Is this inconsistant with the 7th point you make in the first part of this blog entry? The link to the reference is not working and I would like to learn more about “Eating cholesterol has very little impact on the cholesterol levels in your body.”
Just thought I’d add my voice to the clamour of readers asking for Part X!
I was diagnosed with CVD and had a stent fitted to a severely narrowed LAD age 41 despite being otherwise fit and with none of the traditional risk factors (eventually, I discovered very high Lp(a) as the most likely culprit after asking a private cardiologist to get this tested). Inevitably, a statin was given top billing in the cocktail of drugs I was prescribed on discharge and I took it for about 18 months. However, I have become more and more of a statin-sceptic, and moved to low-carb eating, after reading Gary Taubes, Ben Goldacre, the UK’s Malcolm Kendrick as well as your blog. However, my GP, cardiologist and two professors of endocrinology all tell me I’m mad not to take the statin. As a result, I’m very interested in your view on the role of statins – even if it’s not yet definitive.
I hear you, Paul. I’ll get there.
Hi Peter,
Is it safe to say that particle number of lipoprotein is a bigger problem in heart disease than inflammation as these particles cause inflammation in the artery wall which makes things worse?
What makes “sub-endothelial space” vulnerable to the landing of lipoproteins in there? Can this be prevented other than having less particle?
Thanks
Technically, we don’t know, as the analysis of LDL-P vs. oxLDL has not been done. We know for sure that LDL-P parallels risk and many (including me) believe it drives risk. The role of inflammation is clear, but to measure and quantify it at the artery and particle level and see if that independently predicts risk is another story which has not been resolved.
Hi Peter.
Just now I saw your “Straight dope on cholesterol” talk from AHS once again, and there’s one thing I really think is missing from the chart showing increased discordance of LDL-C to LDL-P with an increased number of criterea of metabolic syndrome. (The one with 6 x blue and red pillars as seen above).
You mentioned when showing this chart that with no criterea for MetSyn there is concordance between the two. I would like to see another set of pillars from that study: What if a person has no criterea for MetSyn but has a high LDL-C? Would that necessarily mean a high LDL-P? According to you (at the time of that talk ofcourse) a reading of let’s say 180 mg/dl LDL-C would equal a reading of around 1800 mmol/L of LDL-P. Don’t you think it could just as well be that a high LDL-C in a person with no criterea for MetSyn could equal a low LDL-P reading? This could be an effect of very low triglyceride count and some elite cholesterol packing LDL’s =)
I can easily imagine that LDL-P pillar just staying in place while its LDL-C buddy shoots up a bit. Maybe this is even slightly favorable when looking at some of the other charts of your cholesterol series suggesting that lowest risk of coronary events is a high LDL-C tin conjunction with a low LDL-P.
Thank you for taking your time to provide all the information on this site!
Andreas.
Andreas, what that graph says is that, on average, if one has no signs of MetSyn, LDL-C and LDL-P will be concordant.
Andreas, you may be giving lipid panel result LDL-C more credibility than it merits.
Lipoprotein panel result LDL-P is what we need instead, and almost never get.
For for a concise critique of LDL-C, see the remarks starting at
“LDL cholesterol is calculated, not measured ” in article
https://www.wheatbellyblog.com/2013/11/a-grain-eaters-cholesterol-panel/
on Dr. Davis’ blog. Dr.D. is a cardiac specialist.
Boundless: That’s perfectly clear. I too am convinced the LDL-P test is superior when trying to predict developement of atherosclerosis. My question was in regards to the specifics of this one chart above.
I know, Peter, but if that was actually true, then in people with no signs of MetSyn high LDL-C by itself would be a strong predictor of future atherosclerosis right? Assuming high LDL-C = High LDL-P.
And that would mean that most people with high LDL-C (even MetSyn-free people) are at high risk for developing atherosclerosis. Conventional wisdom was right?
That’s why I ask: Don’t you think it is very possible to have high LDL-C but with low LDL-P?
I think you may be misunderstand concordance vs. discordance. LDL-P and LDL-C are *concordant* when they both predict equal risk. This is likely to happen when one does not have IR (i.e., 0 signs of MetSyn), but this fact does not change the point. It’s like saying blue eyes predicts CHD risk. Well, it does when someone has blue eyes and high LDL-P, but that doesn’t mean blue eyes predict CHD risk. That fact the *sometimes* LDL-C is concordant with LDL-P says nothing about the CW being right.
Alright, that makes sense. And it puts me somewhat at rest – having no IR, but high LDL-C after 2 years with around 70% of energy intake from a blend of mono and saturated fat. Doc’s very concerned though! 😉
Thank you for clarifying and merry christmas!
Just another, waiting anxiously to see if theirs any light to unraveling the high LDL-P issue in some of us.
In summary, on HFLC, Im concordant, but with an LDL-C of 210 LDL-P 2000, small LDL-P is low at 180, IR 15. Ate lower fat, more carbs and LDL-C drops to 140 but LDL-P now is discordant and stays at 1800. small LDL-P jumps to 600. IR score is still less than 25. Does genetics simply have the final say in some of us no matter what we eat and high LDL-P is something we just cant do anything about?
Mike, genetics always plays a significant role in CHD risk, and this can often be driven through high LDL-P for many reasons.
Andreas,
If I’m reading correctly what Peter said was that both LDL-C and LDL-P are LIKELY to be concordant (predicting equal risk) with NO signs of IR. All the best.
Correct…it’s all about probability.