
Want to catch up with other articles from this series?
- The straight dope on cholesterol – Part I
- The straight dope on cholesterol – Part II
- The straight dope on cholesterol – Part III
- The straight dope on cholesterol – Part IV
- The straight dope on cholesterol – Part V
- The straight dope on cholesterol – Part VI
- The straight dope on cholesterol – Part VII
- The straight dope on cholesterol – Part VIII
- The straight dope on cholesterol – Part IX
Previously, in Part I, Part II, Part III, Part IV and Part V of this series, we addressed these 7 concepts:
#1 — What is cholesterol?
#2 — What is the relationship between the cholesterol we eat and the cholesterol in our body?
#3 — Is cholesterol bad?
#4 — How does cholesterol move around our body?
#5 – How do we measure cholesterol?
#6 – How does cholesterol actually cause problems?
#7 – Does the size of an LDL particle matter?
(Not so) quick refresher on take-away points from previous posts, should you need it:
- Cholesterol is “just” another fancy organic molecule in our body but with an interesting distinction: we eat it, we make it, we store it, and we excrete it – all in different amounts.
- The pool of cholesterol in our body is essential for life. No cholesterol = no life.
- Cholesterol exists in 2 forms – unesterified or “free” (UC) and esterified (CE) – and the form determines if we can absorb it or not, or store it or not (among other things).
- Much of the cholesterol we eat is in the form of CE. It is not absorbed and is excreted by our gut (i.e., leaves our body in stool). The reason this occurs is that CE not only has to be de-esterified, but it competes for absorption with the vastly larger amounts of UC supplied by the biliary route.
- Re-absorption of the cholesterol we synthesize in our body (i.e., endogenous produced cholesterol) is the dominant source of the cholesterol in our body. That is, most of the cholesterol in our body was made by our body.
- The process of regulating cholesterol is very complex and multifaceted with multiple layers of control. I’ve only touched on the absorption side, but the synthesis side is also complex and highly regulated. You will discover that synthesis and absorption are very interrelated.
- Eating cholesterol has very little impact on the cholesterol levels in your body. This is a fact, not my opinion. Anyone who tells you different is, at best, ignorant of this topic. At worst, they are a deliberate charlatan. Years ago the Canadian Guidelines removed the limitation of dietary cholesterol. The rest of the world, especially the United States, needs to catch up. To see an important reference on this topic, please look here.
- Cholesterol and triglycerides are not soluble in plasma (i.e., they can’t dissolve in water) and are therefore said to be hydrophobic.
- To be carried anywhere in our body, say from your liver to your coronary artery, they need to be carried by a special protein-wrapped transport vessel called a lipoprotein.
- As these “ships” called lipoproteins leave the liver they undergo a process of maturation where they shed much of their triglyceride “cargo” in the form of free fatty acid, and doing so makes them smaller and richer in cholesterol.
- Special proteins, apoproteins, play an important role in moving lipoproteins around the body and facilitating their interactions with other cells. The most important of these are the apoB class, residing on VLDL, IDL, and LDL particles, and the apoA-I class, residing for the most part on the HDL particles.
- Cholesterol transport in plasma occurs in both directions, from the liver and small intestine towards the periphery and back to the liver and small intestine (the “gut”).
- The major function of the apoB-containing particles is to traffic energy (triglycerides) to muscles and phospholipids to all cells. Their cholesterol is trafficked back to the liver. The apoA-I containing particles traffic cholesterol to steroidogenic tissues, adipocytes (a storage organ for cholesterol ester) and ultimately back to the liver, gut, or steroidogenic tissue.
- All lipoproteins are part of the human lipid transportation system and work harmoniously together to efficiently traffic lipids. As you are probably starting to appreciate, the trafficking pattern is highly complex and the lipoproteins constantly exchange their core and surface lipids.
- The measurement of cholesterol has undergone a dramatic evolution over the past 70 years with technology at the heart of the advance.
- Currently, most people in the United States (and the world for that matter) undergo a “standard” lipid panel, which only directly measures TC, TG, and HDL-C. LDL-C is measured or most often estimated.
- More advanced cholesterol measuring tests do exist to directly measure LDL-C (though none are standardized), along with the cholesterol content of other lipoproteins (e.g., VLDL, IDL) or lipoprotein subparticles.
- The most frequently used and guideline-recommended test that can count the number of LDL particles is either apolipoprotein B or LDL-P NMR, which is part of the NMR LipoProfile. NMR can also measure the size of LDL and other lipoprotein particles, which is valuable for predicting insulin resistance in drug naïve patients, before changes are noted in glucose or insulin levels.
- The progression from a completely normal artery to a “clogged” or atherosclerotic one follows a very clear path: an apoB containing particle gets past the endothelial layer into the subendothelial space, the particle and its cholesterol content is retained, immune cells arrive, an inflammatory response ensues “fixing” the apoB containing particles in place AND making more space for more of them.
- While inflammation plays a key role in this process, it’s the penetration of the endothelium and retention within the endothelium that drive the process.
- The most common apoB containing lipoprotein in this process is certainly the LDL particle. However, Lp(a) and apoB containing lipoproteins play a role also, especially in the insulin resistant person.
- If you want to stop atherosclerosis, you must lower the LDL particle number.
- At first glance it would seem that patients with smaller LDL particles are at greater risk for atherosclerosis than patients with large LDL particles, all things equal.
- “A particle is a particle is a particle.” If you don’t know the number, you don’t know the risk.
- To address this question, however, one must look at changes in cardiovascular events or direct markers of atherosclerosis (e.g., IMT) while holding LDL-P constant and then again holding LDL size constant. Only when you do this can you see that the relationship between size and event vanishes. The only thing that matters is the number of LDL particles – large, small, or mixed.
Concept #8 – Why is it necessary to measure LDL-P, instead of just LDL-C?
In the growing list of reasons why I used to refer to myself as “chick-repellant” in college, I have a confession to make: I find the topic of statistical concordance and discordance to be so exciting, I sometimes have a hard time containing myself. This may explain the paucity of girlfriends in college. Let me use an example to illustrate the distinction between these terms. Let’s say you want to predict the change in home prices in the following year (I used to model this for a living). There are at least a dozen parameters linked to this, including: GDP growth, unemployment, interest rates (both short term and long term, though to different degrees), housing inventory (i.e., how many houses are on the market), housing absorption (i.e., how quickly houses go from being on the market to being sold), major stock indices, and consumer confidence. Historically, from the mid-1990’s until about the fourth quarter of 2006, this worked like clockwork. While each of these variables had differing strengths of predicting changes in home prices, they all moved together. For example, when GDP growth was robust, unemployment was low, interest rates were modest, housing inventories were about 60 to 90 days, etcetera. All of these variables pointed to a predictable change in home values.
Around Q42006 (i.e., last 3 months of 2006), one of these variables began to deviate from the others. The details aren’t important, but the point is one variable began to suggest home prices would fall while the others all pointed to a continued rise. Prior to Q42006 these parameters were said to be concordant – they all predicted the same thing – either up or down. By 2007, they became discordant – one variable said the sky was falling while others said everything was fine.
This was true on the “micro” level, too. [What I described above is called “macro” level.] As a lender, it should be very important to know the risk of each and every loan you make (clearly this was part of the root problem in the age of mass securitization). Will this person pay the loan back or will they default?
Same game here, but now a new set of even greater variables. As a lender, if I want to know if YOU will default, I will want to know a lot of things about you, such as your agency credit risk scores, your bank account activity, payroll activity, how much you’re borrowing relative to the value of your house, where your house is located, and about 50 other things (literally).
Not surprisingly, the same thing that happened on the macro side happened on the micro side. It became difficult to predict who would default and would not default because there were so many variables to consider and lenders didn’t know which ones were still predictive. The models that predict default are very sensitive to the balance of these inputs. When all of the variables are concordant, their accuracy is prophetic, as was the case from the mid-1990s until late 2006. When some variables become discordant with each other, especially variables that were historically concordant with each other, really bad stuff happens, as became evident to me, personally, one Thursday afternoon in November 2007. It became clear the sky was about to fall. And, of course, it did.
What does real estate have to do with atherosclerosis?
Fortunately, predicting heart disease is a little easier than predicting changes in home prices. It’s not perfect, of course, but it’s pretty good. Why is it not perfect? For one thing, we can’t do the “perfect” experiment. The “perfect” experiment would look something like this:
Take 100,000 people and randomize them into four matched groups, A, B, C, and D. Wave a magic wand (you can see why this experiment hasn’t been and won’t be done) and give the folks in Group A an LDL particle concentration of, say, 700 nmol/L; those in Group B you give 1,200 nmol/L; those in Group C you give 1,600 nmol/L; and those in Group D get 2,000 nmol/L.
In our dream world, due to the randomization process, these four groups would be statistically identical in every way except one – they would, thanks to our magic wand, have a different number of LDL particles. We would follow them without further intervention for 10 years and then compare their rates of heart disease, stroke, and death.
There are some areas in medicine where we can do such experiments. But, we can’t do this experiment for this question. Even when we do the next best thing — give people a drug that lowers their LDL-P and measure the impact of this intervention — there is always a chance we’ve done something in addition to “just” lowering LDL-P. If you’ve been reading this series, you no doubt know my thoughts on this: while other factors are likely to be involved the pathogenesis of atherosclerosis (e.g., endothelial “health”, normal versus abnormal inflammatory response) the primary driver of atherosclerosis is the number of apoB trafficking lipoproteins in circulation, of which LDL particles are the vast majority.
The data below should further clarify this association.
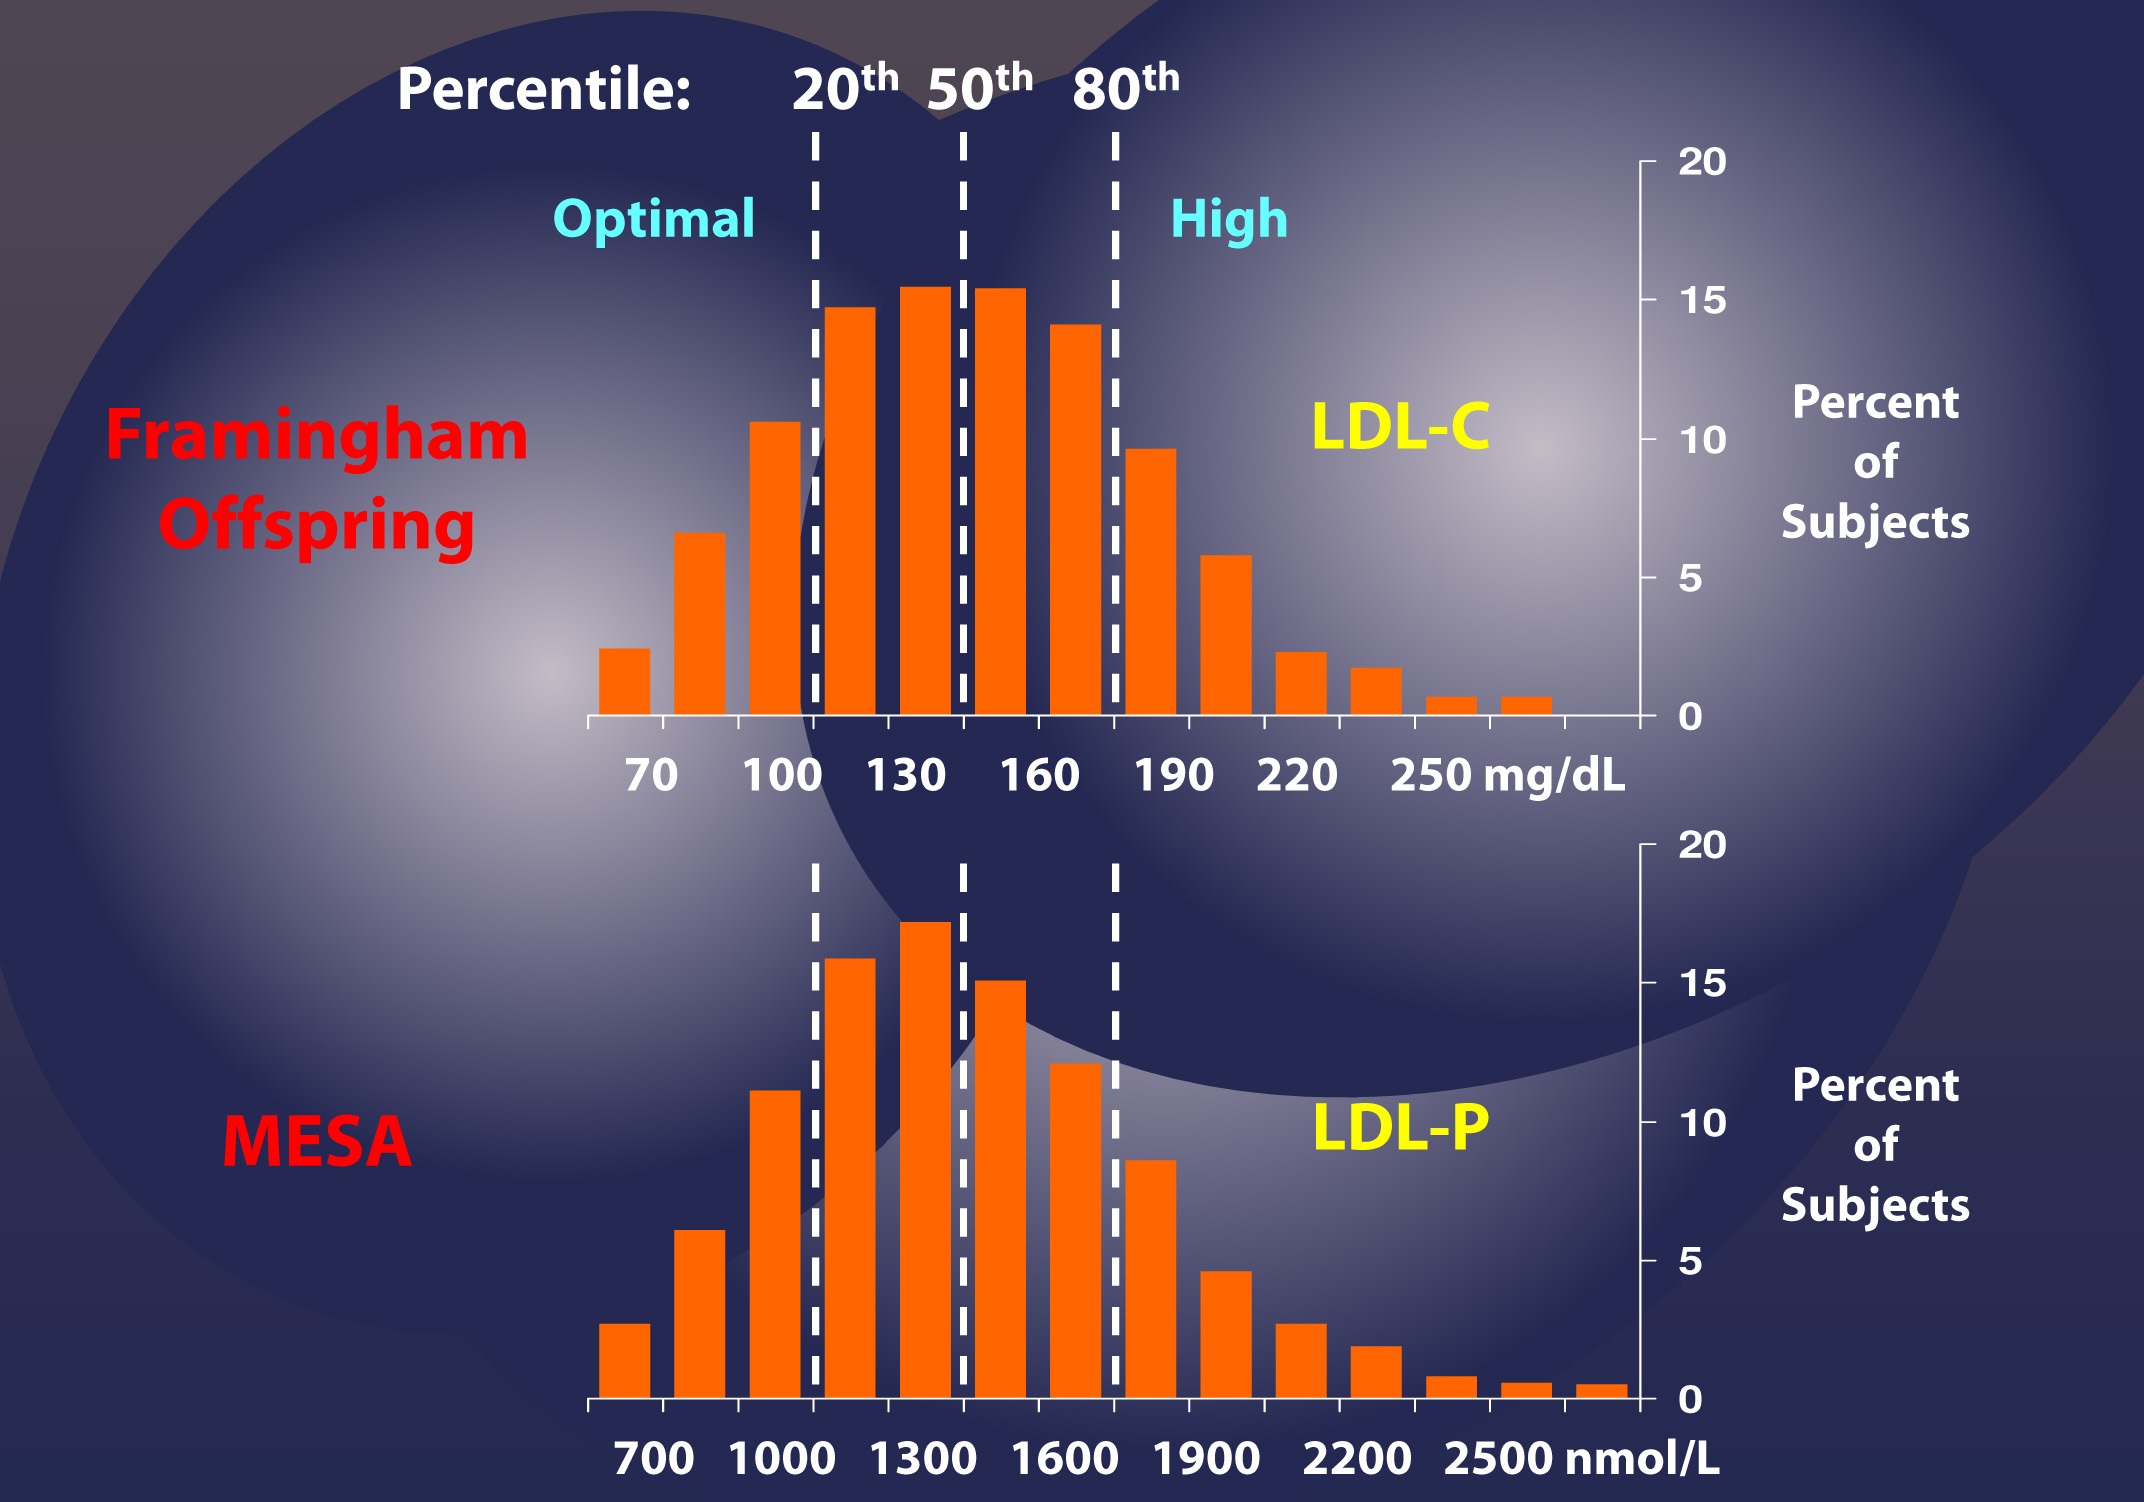
What do concordant LDL-C and LDL-P values look like?
Among the two largest studies tracking the association between cholesterol and atherosclerotic mortality are the Framingham study and the MESA trial (the two largest trials were AMORIS and INTERHEART). The figure below, which I’ve graciously borrowed from Jim Otvos, shows the risk stratification of LDL-C (top) and LDL-P (bottom) from the Framingham study and MESA trial, respectively. As you can see, conveniently, LDL-C values in mg/dL are about 10x off from LDL-P values in nmol/L. In other words, in the Framingham population, the 20th percentile value of LDL-C was 100 mg/dL, while the MESA trial found the 20th percentile of the population to have an LDL-P concentration of 1,000 nmol/L. As you will see by the end of this post, this “rule of the thumb” should never be used to infer LDL-P from LDL-C.
If this were always the case – that is, if LDL-C and LDL-P were always concordant – we could conclude that LDL-C and LDL-P would be of equal value in predicting heart disease. Obviously this is not the case, or I wouldn’t be making such a fuss over the distinction. But how bad is it?
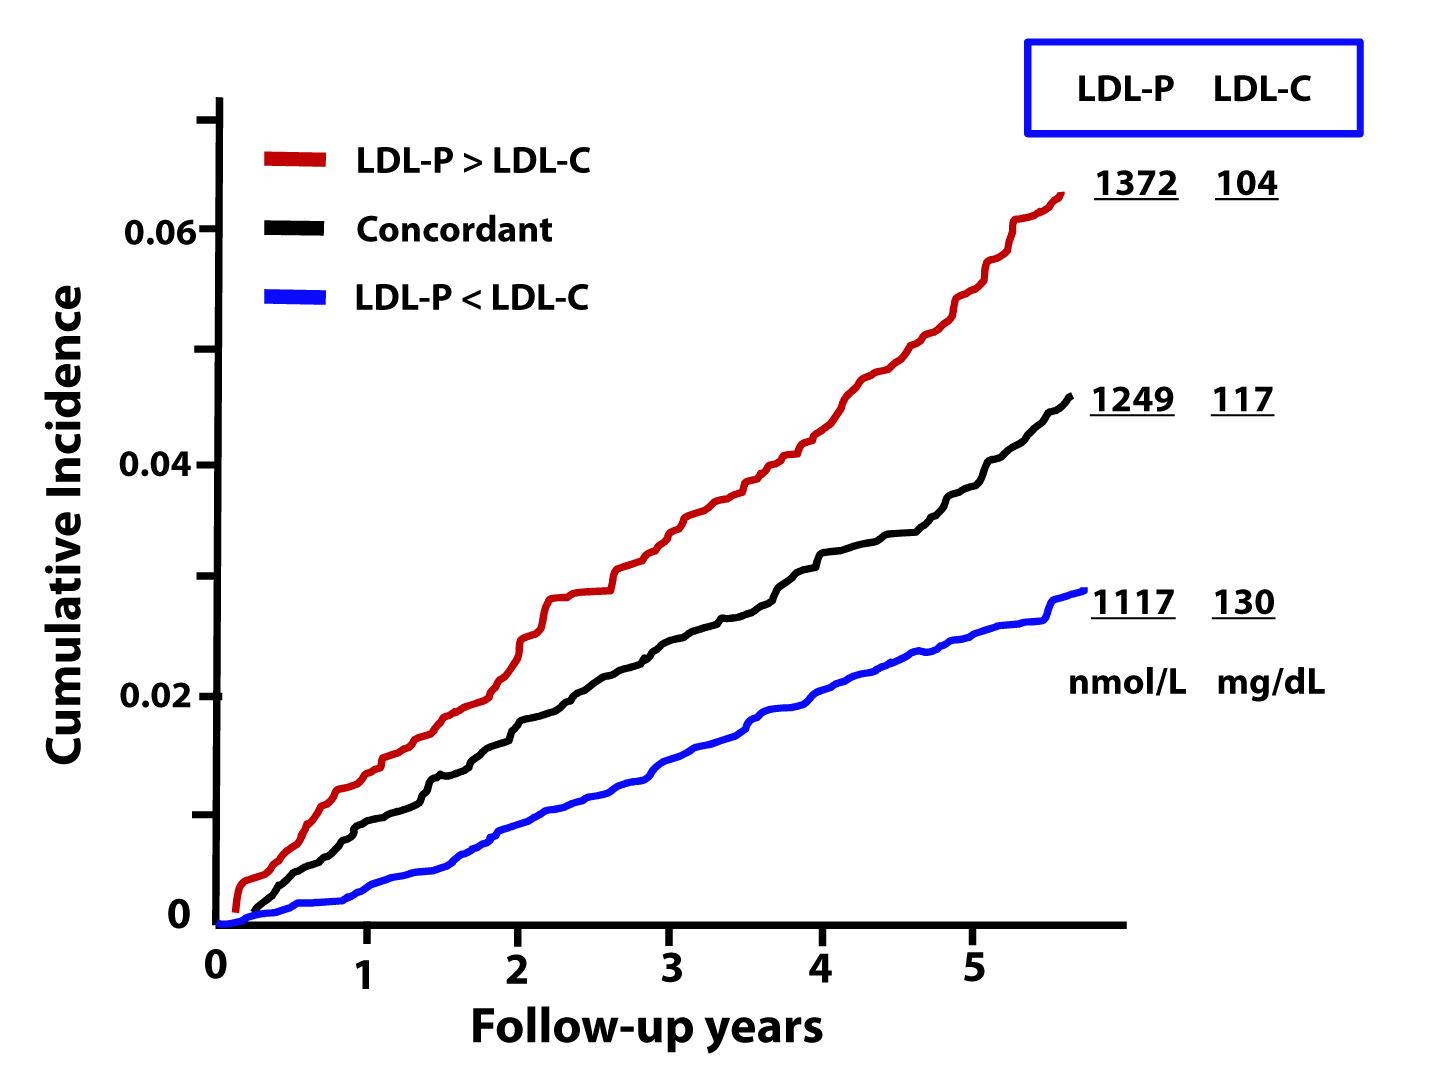
What do discordant LDL-C and LDL-P values look like?
The figure below, from the Journal of Clinical Lipidology, shows the cumulative incidence of cardiovascular events (e.g., myocardial infarction, death) over time in three sub-populations:
- Those with concordant LDL-P and LDL-C (black line);
- Those with discordant LDL-P and LDL-C (LDL-P>LDL-C, shown by the red line);
- Those with discordant LDL-P and LDL-C (LDL-P<LDL-C, shown by the blue line).
This analysis was done using a Cox proportional hazard model and was adjusted for age, sex, and race. The steeper the line the more people in that sub-population died or experienced adverse cardiac events relative to other sub-populations. In other words, the folks in the red group had the worst outcomes, followed by the folks in the black group, followed by the folks in the blue group.
What can we infer from these data?
First, we confirm what I alluded to above. Namely, that a non-zero percent of the population do not have LDL-C and LDL-P values that predict the same level of risk. However, and perhaps more importantly, we get another look at an important theme of this series: LDL-P is driving atherosclerotic risk, not LDL-C. If LDL-P and LDL-C were equally “bad” – even when discordant – you would expect the blue line to be as steep as the red line (and both to be steeper than the black line). But this is not the case.
Let’s look at these data parsed out another way. Below we see the four possible subgroups, from the top:
- Not low LDL-P, low LDL-C (red line);
- Not low LDL-P, not low LDL-C (yellow line);
- Low LDL-P, low LDL-C (black line); and
- Low LDL-P, not low LDL-C (blue line).
Note that “low” is defined below the 30th percentile and “not low” is defined as greater than 30th percentile for each variable. This figure is even more revealing than the one above. Again, it demonstrates the frequency of discordance (about 20% in this population with these cut-off points), and it shows the importance of LDL-P’s predictive power, relative to that of LDL-C.
In fact, though not statistically significant, the highest risk group has high LDL-P and actually has low LDL-C (I’ll give you a hint of why, below) while the lowest risk group has low LDL-P and not-low LDL-C. *This is not a typo.

The highest risk and lowest risk groups are those with discordant LDL-C and LDL-P. The high risk group has high LDL-P and low LDL-C, while the lowest risk group has high LDL-C with low LDL-P. Only a minority of physicians would know that there is a segment of the population with elevated LDL-C who are at low risk! The same conclusion will be drawn from the next study.
Let’s look at an even longer-term follow up study, below. This study followed a Framingham offspring cohort of about 2,500 patients over a median time period of almost 15 years in each of the four possible groups (i.e., high-high, high-low, low-high, and low-low) and tracked event-free survival. In this analysis the cut-off points for LDL-P and LDL-C were the median population values of 1,414 nmol/L and131 mg/dL, respectively. So “high” implies above these values; “low” implies below these values. Kaplan-Meier survival curves are displayed over a 16 year period – the steeper the slope of the line the worse the outcome (survival).
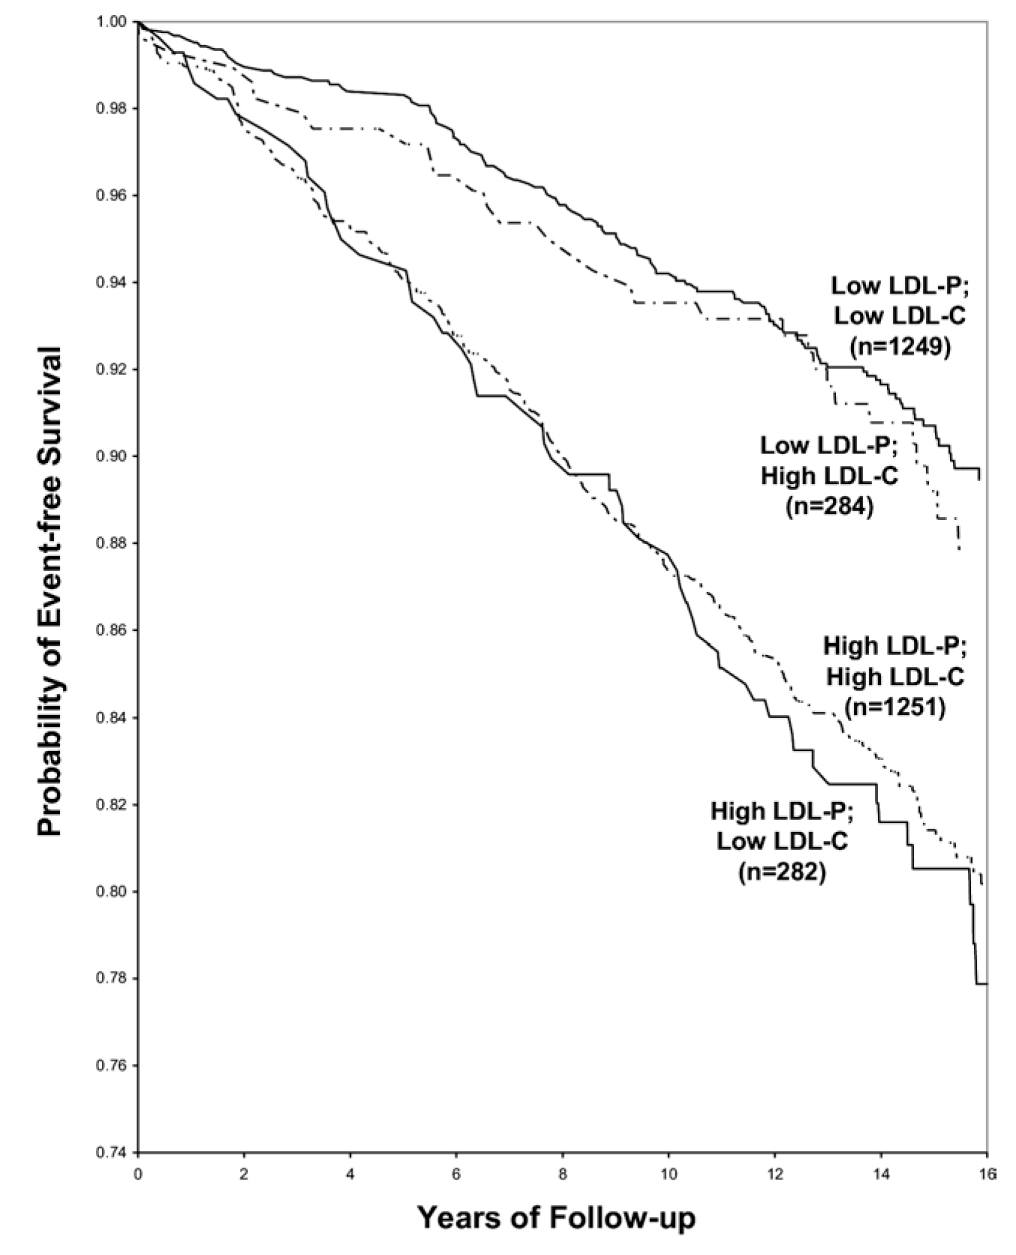
The same patterns are observed:
- LDL-P is the best predictor of adverse cardiac events.
- LDL-C is only a good predictor of adverse cardiac events when it is concordant with LDL-P; otherwise it is a poor predictor of risk.
Amazingly the persons with the worst survival had low (below median) LDL-C but high LDL-P. The patients most likely to have high LDL-P with unremarkable or low LDL-C are those with either small LDL particles, or TG-rich / cholesterol poor LDL particles, or both (e.g., insulin resistant patients, metabolic syndrome patients, T2DM patients). This explains why small LDL particles, while no more atherogenic on a per particle basis than large particles, are a marker for something sinister.
Populations where LDL-P and LDL-C discordance are even more prevalent
As I described above, the discordance between LDL-P and LDL-C is exacerbated in patients with metabolic syndrome. The figure below, MESA data, again borrowed from Jim Otvos, presents this difference in an elegant way. The horizontal axes show LDL-P concentration in the usual units, nmol/L.
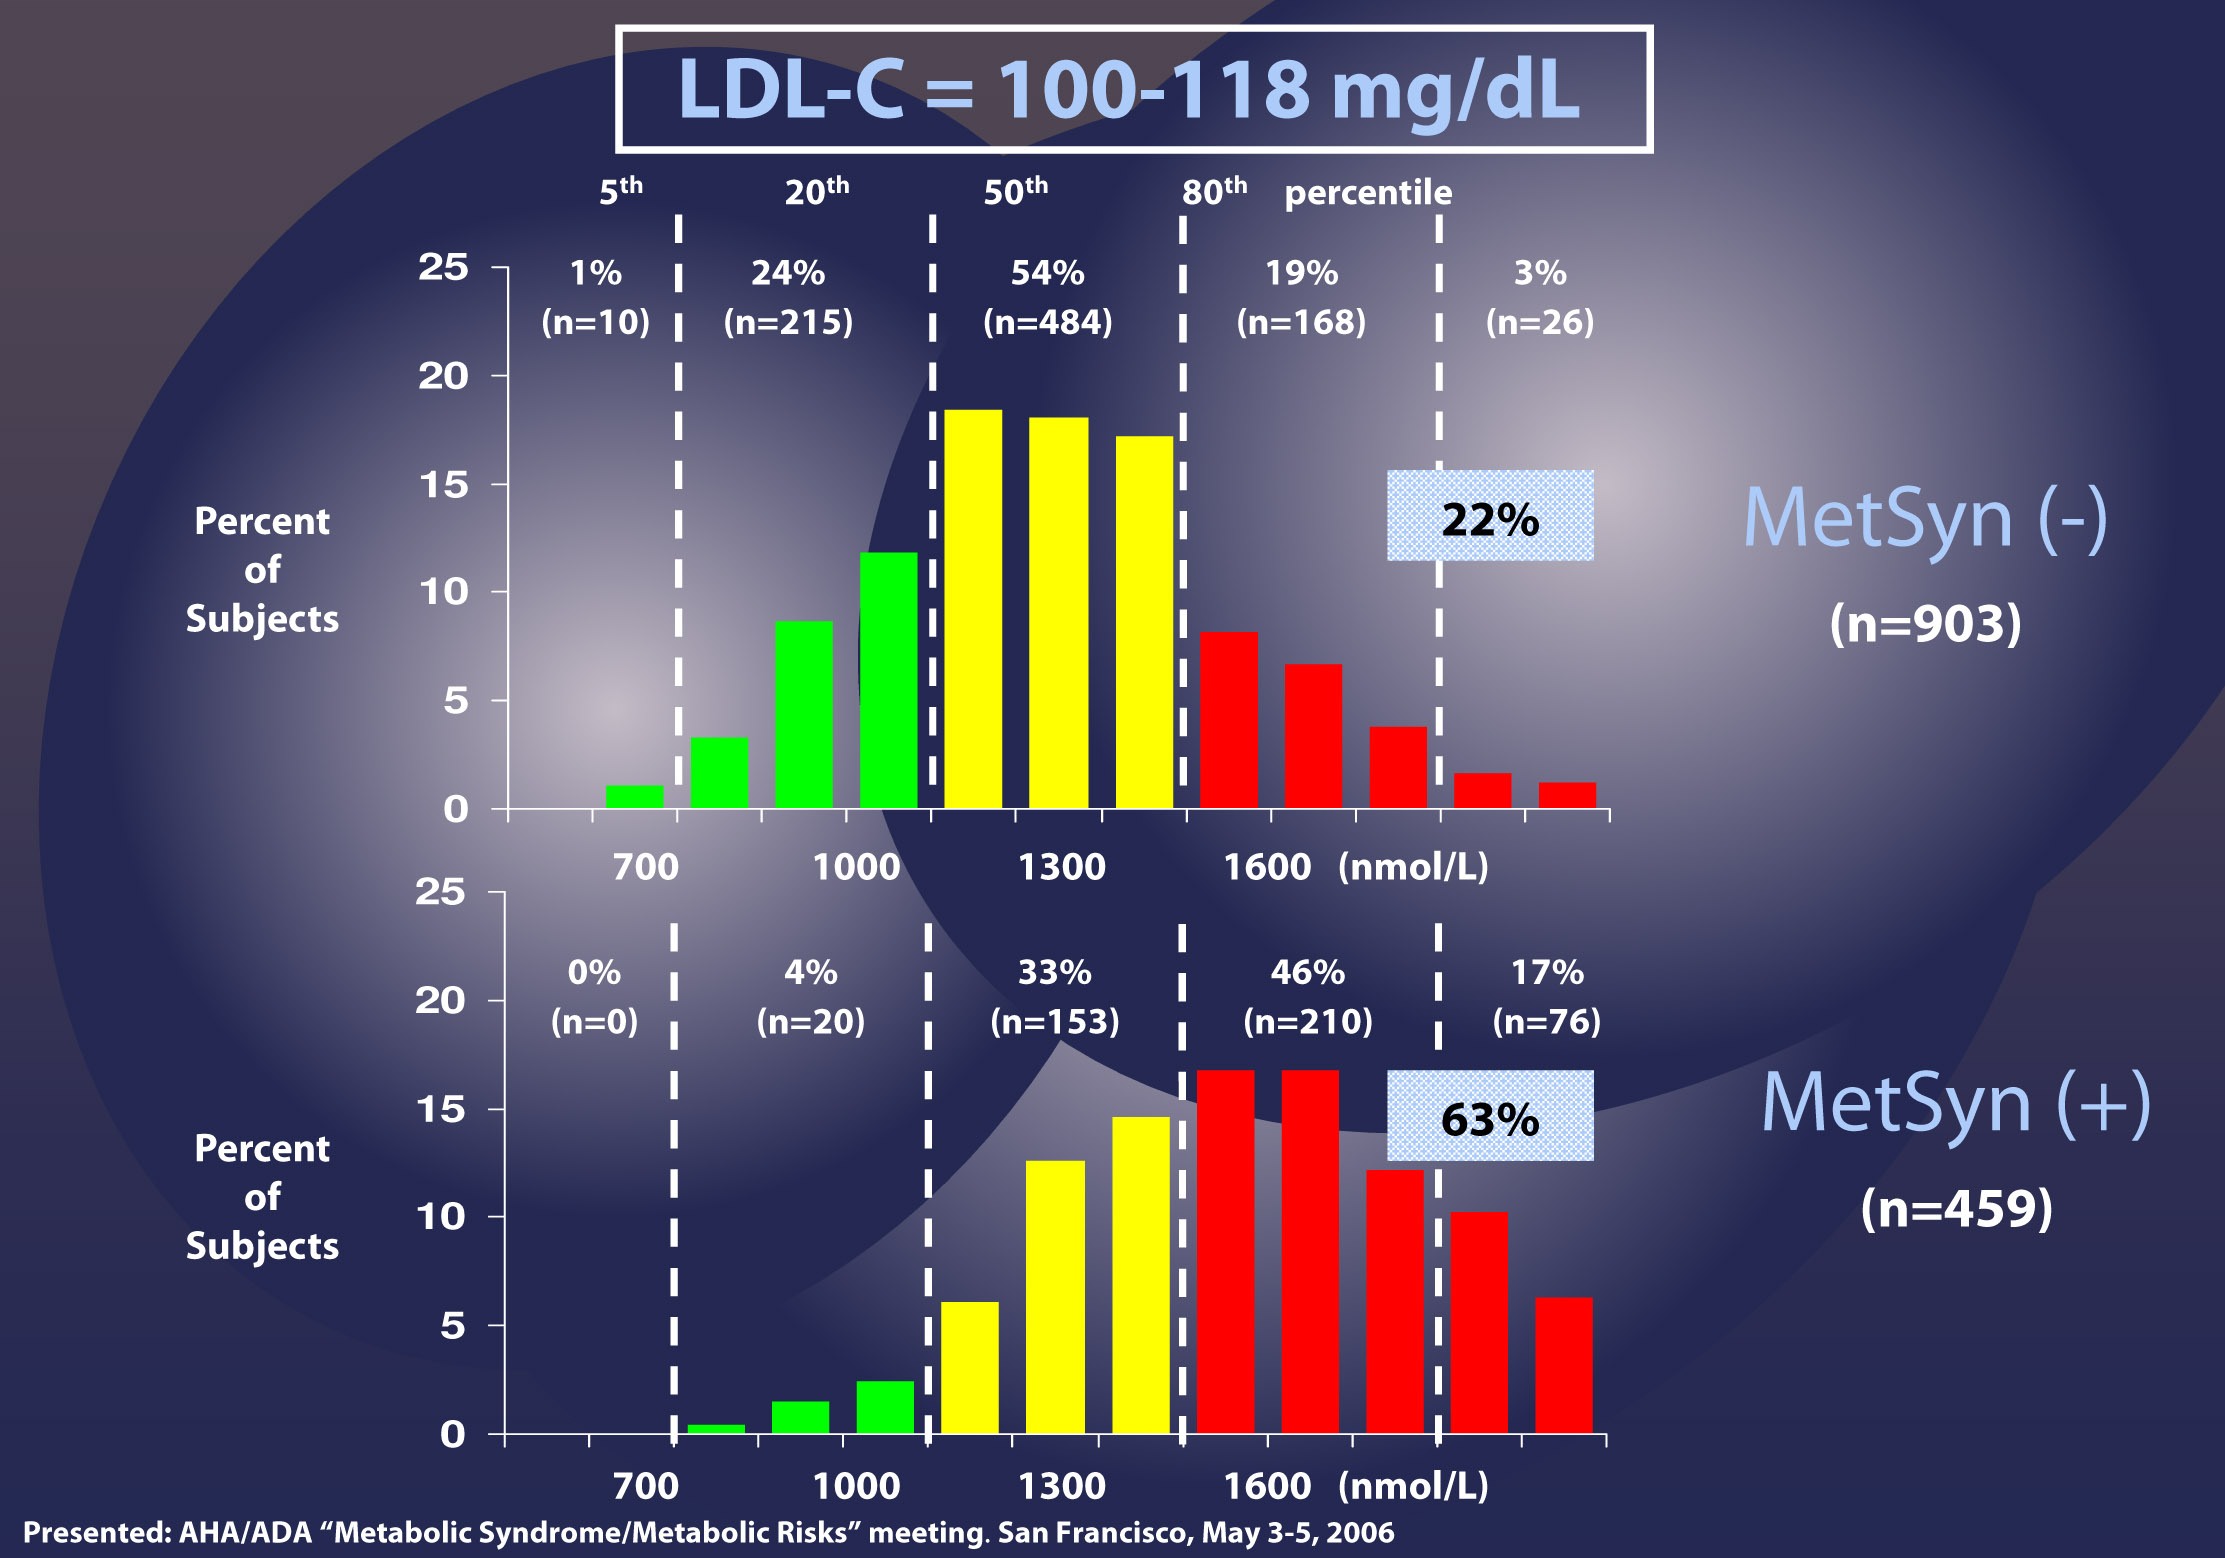
Patients with LDL-C between 100 and 118 mg/dL (i.e., second quartile of risk: 25th to 50th percentile) are shown without metabolic syndrome (top) and with metabolic syndrome (bottom). In the patients without metabolic syndrome, LDL-C under-predicts cardiac risk 22% of the time, consistent with the population data I have shown you earlier. However, when you look at the patients with metabolic syndrome, you can see that 63% of the time their risk of cardiac disease is under-predicted. Again, not a typo.
There are so many subsets and cut-off points that I could devote ten more posts to showing you every one of these analyses. Let me finish this point with the most recent, hot-off-the-press (actually, still in press in the American Journal of Cardiology, though you can get a preprint here) analysis of which Tom Dayspring is one of the authors.
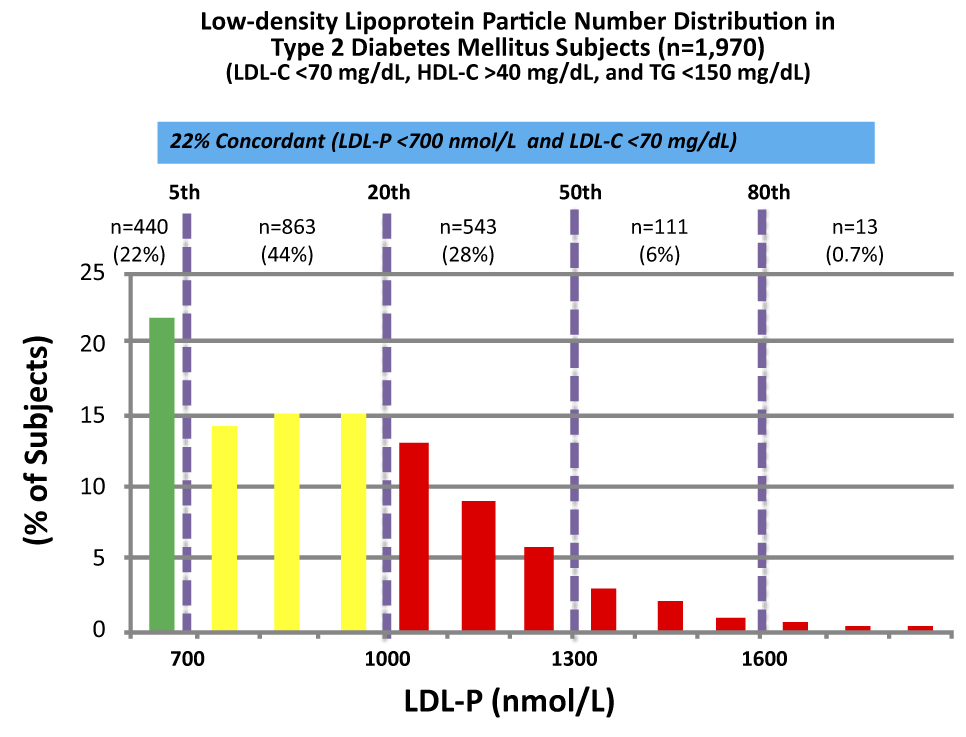
These data were collected from nearly 2,000 patients with diabetes who presented with “perfect” standard cholesterol numbers: LDL-C < 70 mg/dL; HDL-C > 40 mg/dL; TG <150 mg/dL. However, only in 22% of cases were their LDL-P concordant with LDL-C. That is, in only 22% of cases did these patients have an LDL-P level below 700 nmol/L.
Remember, LDL-C < 70 mg/dL is considered VERY low risk – the 5th percentile. Yet, by LDL-P, the real marker of risk, 35% of these patients had more than 1,000 nmol/L and 7% were high risk. When you do this analysis with the same group of patients stratified by less stringent LDL-C criteria (e.g., <100 mg/dL) the number of patients in the high risk group is even higher.
The real world tragedy: 90-95% of physicians, including cardiologists, would bet their own lives that persons with an LDL-C < 70 mg/dL have no atherosclerotic risk.
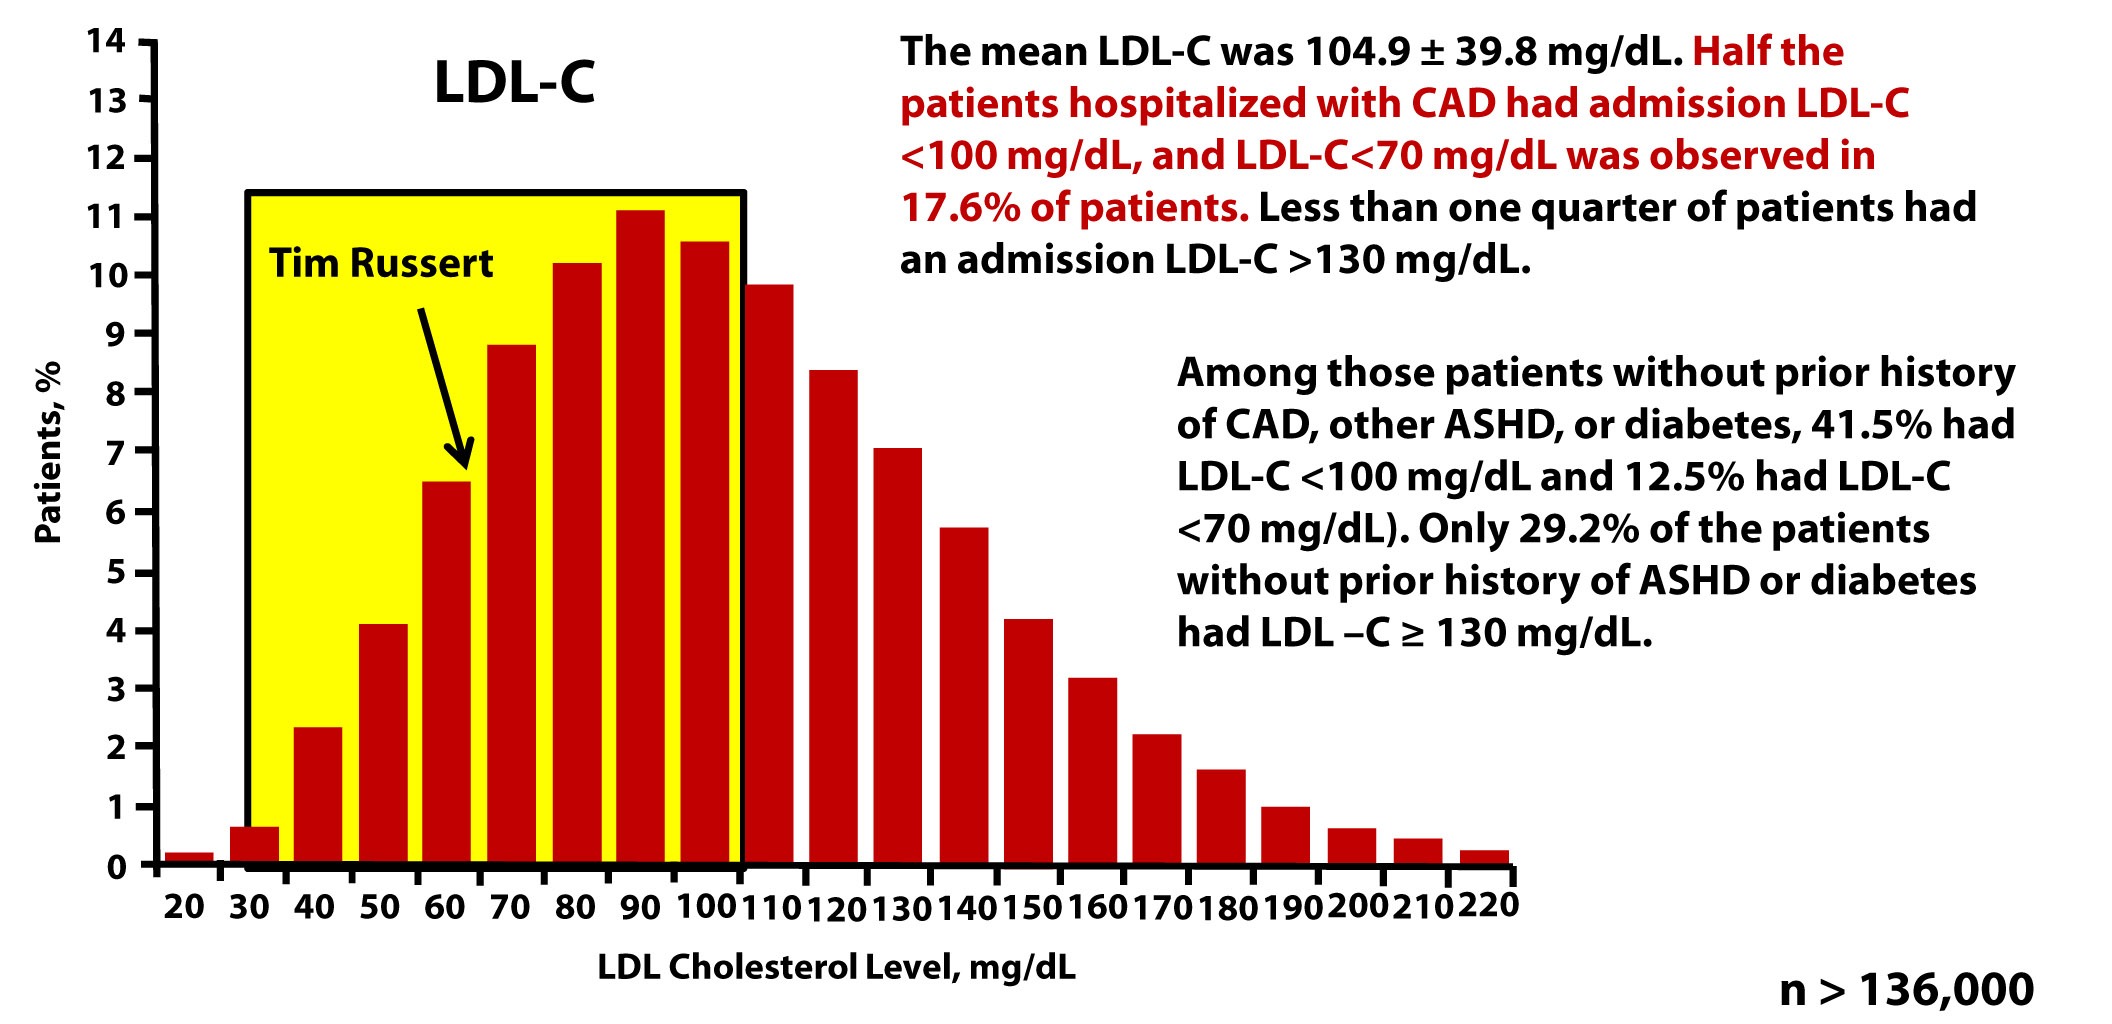
Tim Russert, shortly before his death, had his LDL-C level checked. It was less than 70 mg/dL. Sadly, his doctors didn’t realize they should also have been checking his LDL-P or apoB. The figure below, which is from one of Tom Dayspring’s presentations, shows data from this study of nearly 137,000 patients hospitalized for coronary artery disease between 2000 and 2006. As you can see, LDL-C fails to even reasonably predict cardiovascular disease in a patient population sick enough to show up in the hospital with chest pain or outright myocardial infarction.
Why are LDL-C and LDL-P so often discordant?
Think back to what you learned in a previous post in this series. LDL particles traffic not only cholesterol ester but also triglycerides. Each and every LDL particle has a variable number of cholesterol molecules which, because of constant particle remodeling, is constantly changing. In other words, of the several quadrillion LDL particles floating in your plasma, no two are carrying the exact same number of cholesterol molecules. It takes many more cholesterol-depleted LDL particles than cholesterol-rich LDL particles to traffic a given cholesterol mass (i.e., number of cholesterol molecules) per volume of plasma (i.e., per dL). Core cholesterol mass is related to both LDL particle size (the volume of a sphere is a third power of the radius — it can take 40-70% more small particles than large LDL particles to traffic a given cholesterol mass) and the number of TG molecules per LDL particle.
TG molecules are larger than cholesterol ester molecules, so as the number of TG molecules per particle increases, the number of cholesterol molecules will be less – in a very non-linear manner. Regardless of size it takes many more TG-rich LDL particles (which are necessarily cholesterol-depleted) to traffic a given cholesterol mass than TG-poor LDL particles. The persons with the highest LDL particles typically (though not always) have small LDL particles that are TG-rich. These are incredibly cholesterol-depleted LDL particles.
Summary
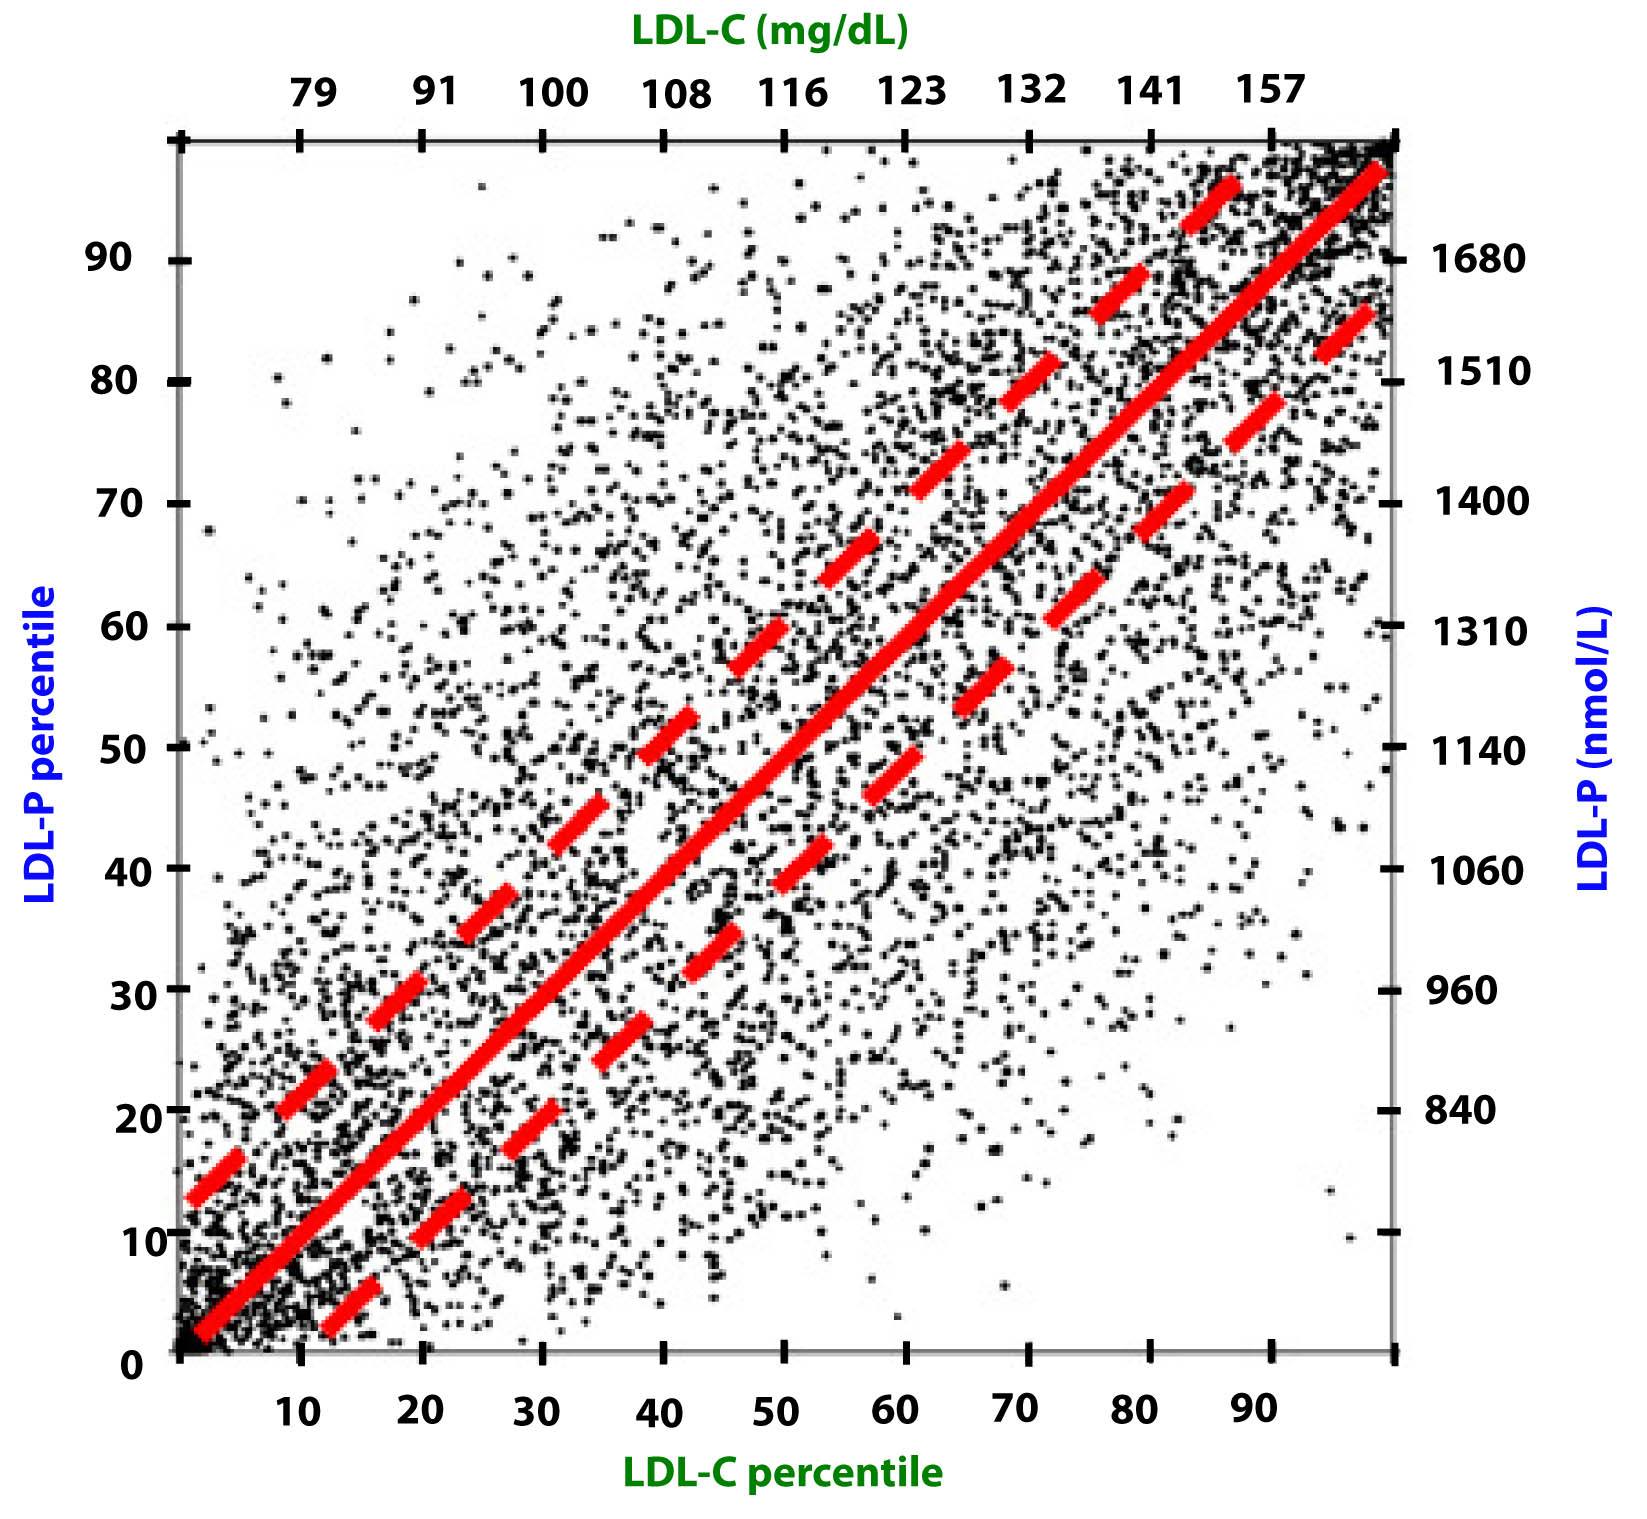
Take a look at this figure below from the 2011 Otvos et al. paper I referenced above. It’s a scatterplot of each data point (i.e., patient) in the study. The solid red line shows perfect concordance between LDL-P and LDL-C. The dashed red lines show a +/- 12% margin on each side. Look at how many dots (remember: each dot represents a person) lie OUTSIDE of the dashed red lines. Now look again.
When people argue with me about why it’s unnecessary to check LDL-P or apoB because it’s much easier and cheaper to check LDL-C, I like to remind them of what Clint Eastwood would probably say in such a situation: “You’ve got to ask yourself one question: Do I feel lucky? Well, do ya, punk?”
- With respect to laboratory medicine, two markers that have a high correlation with a given outcome are concordant – they equally predict the same outcome. However, when the two tests do not correlate with each other they are said to be discordant.
- LDL-P (or apoB) is the best predictor of adverse cardiac events, which has been documented repeatedly in every major cardiovascular risk study.
- LDL-C is only a good predictor of adverse cardiac events when it is concordant with LDL-P; otherwise it is a poor predictor of risk.
- There is no way of determining which individual patient may have discordant LDL-C and LDL-P without measuring both markers.
- Discordance between LDL-C and LDL-P is even greater in populations with metabolic syndrome, including patients with diabetes. Given the ubiquity of these conditions in the U.S. population, and the special risk such patients carry for cardiovascular disease, it is difficult to justify use of LDL-C, HDL-C, and TG alone for risk stratification in all but the most select patients.
- This raises the question: if indeed LDL-P is always as good and in most cases better than LDL-C at predicting cardiovascular risk, why do we continue to measure (or calculate) LDL-C at all?
Photo by Aldric RIVAT on Unsplash


Hi Peter,
I did a bloodtest last week and could get my doc.to approve for a APO B test.Here are my numbers:
TC 248 mg/dl
hdl C 66 mg/dl
ldl C 168 mg/dl
trig. 75 mg/dl
APO B 1.2 g/l
25 OHD 129 ng/ml
This is my third test within 30 months or so and there are no great variations in them,so pretty constant over that timespan.
I eat under 50 gr. of carbs a day and about 100-120 gr. of protein. I actually thought that my apo b count would be lower , but it isn’t. Would you suggest to ,after seeing these numbers,that I should investigate whether I’m a high absorber? Or could just a high traffic of cholesterol within not so big particles(maybe because of genetics) be the cause?Good to know,I feel really healthy ,never be sick and last time my bloodpressure was checked it was 120/80(age 48,no overweight).
I see very often the apo b count in nmol. How can I convert these numbers?
Thanks,
ad
Actually, most folks read apoB in mg/dL, so you’d multiply by 100 (i.e., 120 mg/dL). I do think additional studies could put this paradoxical numbers in context. I hope to write a post on this exact issue in the coming month or so.
Wow, what a long and interesting string of comments has piled up here! Peter, you have been very gracious in offering and participating in this forum, and humoring all of our sometimes strong opinions.
My thinking aligns with Hasan’s — i.e. I think that the extra prediction power of LDL-p over LDL-c in a broad cohort is likely contributed only by those with IR (probably the vast majority in our modern societies), as suggested by the EPIC-Norfolk data cited by many already, via reasonably well-understood lipoprotein-particle mechanisms (e.g. CE transfer). And I think that insulin resistance is likely a sine qua non for CVD. More specifically, I suspect that IR of the endothelium is a requirement for atherogenesis. The genetic vulnerability of the endothelial tissue (to developing IR) probably is a primary differentiator between individuals, accounting for the significant variability in susceptibility to CVD amongst us. Vulnerability of the pancreatic islets (to IR-like damage to the bio-energetic and related mechanisms in the cells, such as mitochondria and endoplasmic reticulum), in the same way, explains why ~55% of the population appears to be invulnerable to T2DM and the rest can get it. But it has always been a fundamental research limitation that IR of specific tissues is difficult or impossible to measure, especially in large-cohort epidemiological studies.
I’d like to offer up some more food for thought based upon my own individual case. I have mild isolated fasting hyperglycemia discovered only a few years ago. Before then I ate a SAD and had signs of IR for decades but didn’t know any better — I thought that gaining weight, etc. just came with middle age and felt basically healthy. I know now that my beta cells have lost ~60% of their efficacy, and at ~80% loss onset of frank diabetes typically occurs. So my primary motivation for maintaining a ketogenic diet is related to some evidence that it could be helpful in regaining (slowly, if at all) beta-cell mass, volume and function. Whole-body IR is NOT involved in my form (i.e. i-IFG) of hyperglycemia. The pathogenesis is NOT IR-driven (as in i-IGT and CGI), but rather involves glucokinase degradation, elevated gluconeogensis, etc. But i-IFG is pretty common, accounting typically for ~1/3 of all pre-diabetes in populations such as ours.
The research pretty consistently has shown that i-IFG does NOT produce any significant increase in risk for CVD, while the IR-driven forms (i-IGT and CGI) do. And there is no IR in i-IFG — IS is normal. This has been extensively studied, and offers an insight into the etiology of CVD — i.e. insulin resistance is a very important factor. And in frank T2DM the metabolism and endocrinology breaks down in such a way that excessive whole-body IR is always a consequence, and hence (presumably) the well-known big jump in CVD risk for type-2 diabetics.
In addition to this, research indicates that in i-IFG a supra-normal secretion of GLP-1 (from the gut) is one of the adaptive responses. This adaptive response is believed to be the explanation that in i-IFG the postprandial glucose response is roughly normal relative to the elevated baseline (i.e. the fasting blood glucose). By contrast, in the other two forms of pre-diabetes the postprandial response is severely compromised, even though the beta-cell loss is generally somewhat smaller at a similar stage of progression relative to overt T2DM.
Now, consider that there is no measurable increase in risk of CVD from the i-IFG form of pre-diabetes. I myself, for example, recently had a coronary calcium test result of zero. And consider that there is much interest and research in the cardiovascular-protective effects of the GLP-1 mimetics (e.g. Byetta, Victoza). Consider also that in i-IFG there is an elevated basal secretion of glucagon (from islet alpha cells) that is part of the altered/abnormal regulation of fasting glucose (since it calls on the liver to produce more endogenous glucose but the basal insulin secretion in i-IFG is normal). And glucagon is cardiovasculature-protective , just like the incretin hormone GLP-1 (glucagon-like peptide, a similar hormone) is protective, and opposite to the atherogenic effect of insulin.
So I hypothesize that the form of damage to my pancreatic islets is actually protective of my cardiovasculature, ironically. My artery endothelium is (and has been) bathed in supra-normal concentrations of cardio-protective hormones in both the postprandial and the fasting states — essentially all the time. Based upon typical rates of progression of isolated fasting hyperglycemia (which is slower and much less variable between individuals than the IR-driven forms) the damage to my beta cells has probably been accumulating for at least two and more likely three decades, while I ate the SAD and had increasing symptoms of at least some insulin resistance. But maybe the extra glucagon and GLP-1 kept my arteries free of disease. I certainly did not live a “clean” life, based on what I now know.
It’s a hypothesis, and it’s my own — I haven’t seen this idea anywhere in the literature. But I think that there is some substantial evidence it might be correct, and it is food for thought for epidemiological research I think. Maybe even NuSI, although this is probably too far afield from its already ambitious focus.
Since there seem to be a lot of very smart people in the comment chain, I offer this as food for thought for all of you.
Is it true that significant (40#) rapid weight loss, say 2 #week, may temporarily increase ldl-p in order to clear text large amount of TG being released from fat stores? If so, how long can it take for ldl-p to normalize?
Yes, this has been observed and described on several occasions. What’s not clear is why it happens in some and not others, how long this phenomenon lasts, or what the significance is.
Peter, Thanks for the confirmation because it appears to have happened to me. Every marker of health improved except ldl-p, which shot up to 1680 from 1000 (small dense ldl-p < 50 so LDL-C also rose significantly).
I have been weight stable for six months and am in the process of retesting. My fat loss was 20% of my body weight and fat percentage is now 14%. All good,..almost. Thx again. Sam
Peter,
Thanks for this series it really helped me understand. I’ve been semi primal for a year and went from 210 lbs to 165 lbs. I just had a regular lipid panel which was
TG: 71
TC: 251
HDL: 60
LDL: 177
Now I know you say LDL-C doesn’t mean anything. But if you look on the scatter chart that shows LDL-C and LDL-P when you start getting in my range for LDL-C the data does tend to show the odds are my LDL-P will be >1500. I am in the process of trying to find a doctor that will write a Rx for the NMR Lipidprofile. I will report back.
John, your experience mimics mine. It seems that in some people LDL-C rises with a LCHF diet. I also note that the scatter plot would suggest that for a high percentage of people, high LDL-C is predictive of high LDL-P, especially above, say 170. i am conflicted by this because this takes us back to some degree to focusing on LDL-C, which we know is a poor predictor of CVD. (You don’t say what your blood work looked like pre weight loss. My LDL-C was 120 and increased to 180 post weight loss. LDL-P tested at 1680 post weight loss but I don’t have a base line particle count. All I can say is my TG/Hdl went from 2:1 to 0.9 to 1 which suggests my LDL-p was in pattern a pre and post.
Phinney writes about a transient rise in LDL-C in some people in his “art and science” book. Maybe this applies to you. I am also retesting now that I have been weight stable for 6 months. I don’t think you need an Rx for NMR, at least not in all states.
OK just got my results back from LabCorp.
Here are my numbers.
LDL-P 1743 nmol/L
LDL-C 177 mg/dL
HDL-C 55 mg/dL
TG 67 mg/dL
TC 245 mg/dL
HDL-P 29.4 umol/L
Small LDL-P 383 nmol/L
LDL Size 21.6 nm
LP-IR 30 (no idea what this is).
The only data I have from before is a blood test from donating blood this was about a month or so after I started loosing weight which only reported TC as 180. Previously when I was +40 lbs I remember always having elevated cholesterol 220+.
Dropping back into this thread just to post some recent lab numbers, including LDL-P, showing a radical change, and thought some people might be interested. Not looking for advice, more like bragging. I’m an insulin resistant, overweight, metabolic syndrome poster boy, 46 yrs old, both parents dead of heart attacks (Though I have lost 40 lbs from my peak of about 3 years ago). Currently eating low carb/high fat, though my bod seems rather resistant to getting into ketosis.
This isn’t as good an n=1 experiment as I’d like, since I did not get my numbers checked immediately prior to going LCHF, last March. However I did get a basic lipid panel done 2 years ago, so I’ll start with that.
**2010 – on a conventional healthy-whole-grain, lowish fat diet **
TC: 219
HDL-C: 32
LDL-C: 97 (NOT directly measured)
TG: 487 (Yes!)
Note: I suspect my LDL may have been considerably higher, considering it was merely calculated, and my sky-high trigs. I was not aware of NMR in 2010, so I don’t know the LDL-P, although I believe the high TG’s suggest it probably would have been very high.
** August 2012 – 5 months into a very low carb, high fat, more-or-less paleo diet . Drug naive, aside from fish oil **
(Numbers from LipoScience NMR)
TC: 281
HDL-C: 40
LDL-C: 205
TG: 178
LDL-P: 2868 (World record????)
Note: was happy with great improvement in TG and HDL, but obviously LDL-P is a problem, and my TC and LDL would make a doctor panic. Doctor puts me on simvastatin and Niaspan niacin.
** December 2012 — continuing LCHF diet, and 4 months into statin/niacin regime **
(Numbers from LipoScience NMR again)
TC: 126 (Yes, one twenty-six!)
HDL-C: 45
LDL-C: 52 (as in, fifty-two)
TG: 147
LDL-P: 1284
…..
How about that. I feel like stopping strangers on the street to tell them all this. LDL-P isn’t the best 20th percentile, but it’s lower than the 50th percentile, which is pretty good for a genetic time-bomb like me. TC and LDL look so low as to be misprints, but if you can’t trust LipoScience who can you trust?
A lot of low-carbers are very anti-statin, and I’ve heard Dr. Dayspring say that statins don’t do a good-enough job of lowering LDL-P. All I can say is a combination of LCHF and statins/niacin are doing a bang-up job for me. The drugs made a MASSIVE difference, and perhaps some of that was due to another 4 months of paleo LCHF eating. If I can just get the TG’s down some more maybe I could end up with super-low LDL-P.
Confession: I’ve had hardly a lick of exercise in about a year. So next I’ll phase in working out, and see what 3 months of that will do in my next NMR. (Which, btw, super-easy to set up through privateMDlabs.com.)
Kevin, thanks for sharing.
Wonderful site with lots of great information. The purpose of this post is to solicit opinions. Some of the doctors I see are encouraging a statin. I am mid-50s male with high total cholesterol. My latest test results appear below. My instincts are to refuse the statins, but would be interested in opinions from this board. Thanks very much.
Total Cholesterol = 227
LDL-C = 123 (calculated)
HDL-C = 94
Triglycerides = 51
LDL-P = 813 nmo/L
HDL-P (total) = 45.4
Small LDL-P = <90
LDL Size = 21.3
LP-IR score = 5 (on 0-100 range)
Large VLDL-P = 1.31
Large HDL-P = 12.5
VLDL size = nm (too low to measure)
HDL Size = 9.8
Your LDL-P is around the 5th percentile and your ratio of LDL-P to HDL-P is about 18 (lowest quartile is a ratio of 35). A statin in you would be malpractice, in my opinion…
Thanks very much, Dr. A. I will continue to resist the advice that if cholesterol >200, then you should/must be on a statin. Will also resist the logic that “statins may have side effects, but it’s better than a heart attack.” My wife’s doctor doesn’t even do the NMR…
Your cholesterol series was superb.
Health Diagnostics Lab did my blood profile, They gave me a “low risk” number for apo B and a high risk number for ldl-P (by nmr). They say apo B was measured, not calculated. So, I don’t know what to think of this since they are both particle counts. I’ve tried to get a good explaination from the lab but no luck there. This makes me wonder if the test results are accurate at all? Any ideas?
Not entirely. LDL-P is exactly as it is billed. ApoB is, even measured, is an indirect measure of particle count because each LDL particle has one apoB. However, other particles have apoB, also, such as VLDL. When both are presented, LDL-P is the better predictor of risk.
I understand that every LDL particle has an apo-b and other particles can also have an apo-b. It just seems to me that the apo-b measurement would tend to reflect more risk and not less risk than the ldl-p (by nmr).
If I had only the apo-b report, I would be wrongly thinking that my risk is very low. So I’m wondering if others should not count on their apo-b results either ?
I had a follow-up ldl-p done that also showed high risk ldl-p. This second report came from Direct Labs and only cost $57. It was a very basic lipid panel but does include the all important ldl-p by nmr.
The advanced lipid panel from Health Diagnostics Labs cost nearly $1000.
Just throwing that out there so others know that they can often just walk into a lab and request the ldl-p report themselves (no doctor required).
But now what to do with this knowledge of high risk ldl-p? As my personal experiment, I plan to have another ldl-p report after taking niacin and psyllium fiber for a couple of months. Of course, I’ll be looking for any other suggested treatments that may be found on this blog and other sites. Thank’s to Dr Attia and Dayspring for making this information available to us.
Ed, are you sure LipoScience is doing the LDL-P for Direct Labs?
Well, I just checked my report. It was LabCorp, not Direct Labs. The LabCorp test number was 884247 and the cost was $58. This included the Lipo Science NMR LipoProfile as well as an IR Score. It’s possible the clerk billed for the wrong test since $58 seems very cheap. However, it’s nice to know that an individual can order their own lipo profile.
I’ve heard Dr Dayspring say that Lipo Science is the only source for the NMR and all labs must send the blood to Raleigh NC until license agreements allow for additional machines to be located elsewhere. If Lipo Science was a public company, I’d be investing in it 🙂
Correct. $58 is reasonable for just the LDL-P.
Hi Peter:
Thanks for all the info you’ve presented, and for the most part, I don’t think I’m confused. (That means I could be so confused, I think I got it straight.) It appears as though I too am one of those Low Carb – High LDP-P guys; so I’m very interested in all things cholesterol. I’m also interested in alternate testing methods.
Anyway, I’ve found an article in the Arizona Sun by Dr Patel, and I’m interested in your thoughts on the Carotid Intima Media Thickness ultrasound test (CIMT). As a lay person, I like the “logic” of measuring plague, even if it isn’t directly on the heart. As well, is there any value in heart scans as advocated by Dr. Davis?
https://azsunfm.blogspot.ca/2012/09/font-definitions-font-face-font-family.html
I’m not going back to medium or high carb. So, I’m looking for other ways to track “potential” damage, or make up coming decisions about statin use. Do you believe any of the above tests, or any other tests will help me to better identify risk, and thereby address treatment?
I will definitely cover my thoughts on this when I (gulp…eventually) get to Part X of this series.
hi Peter,
I have to say i really like how you responded to Hussan, you are clearly a gracious character. I also think Hussan poses some excellent thought provoking questions. Anway, my interest in LCHF diets stems from a guy called Dave Asprey (bulletproof diet), i am not sure your awhere of him. However, i wasn’t satisfied with the level of scientific discussion that this blog clearly has. In saying that, one of the things the bullet proof diet incorporates is not “oxidising your fats” (what ever the definition of that is) (via cooking, such as the preference for raw eggs over hard boiled eggs,) as this is “bad for you”. I am just wondering if you have incounted any such findings in you research? and if you have any thoughts on the matter? cheers :).
The more unsaturated a fat, the more likely it is to generate ROS when heated.
Peter, I was just giving this post my umpty umpth read through (well, reading it with/to someone) and my curiosity has finally piqued: Just what was the discordant variable? GDP, interest rates, unemployment??? I’ve always been curious but figured someone else would have asked by now! Off topic, I know, but, eh, what’s a mind without curiosity?
Interest rates. Trailing, not leading indicator.
Fanstastic series Peter! Really enjoyed reading it and I can now explain to my mother what her cholesterol numbers really mean. She’s on certain drugs and has been avoiding eating eggs and butter for so many years. It does not make much sense after reading your articles.
What we are all missing now is some reference markers for people on LCHF diets and nutritional ketosis (like me). A field of research I hope you can help explore with your NuSI 🙂
Cheers!
J.
I’m a little confused..I had an nmr Lipoprofile test and results were: LDL-p is 1933 But,
HDL-P 43.4
Small LDL-P 123
LDL size 21.8
All of these above markers are listed as in the Lower CVD Risk catagory and the report further shows me as in (Pattern A) which I read is associated with low CVD risk. Also other markers show me with an lp-ir number of 7 which is insulin sensitive which I guess is also good. Am I reading this right? Thanks in advance for any response.
Robin, I can’t weigh in on this, but hopefully your doctor is appropriately versed to explain it in great detail.
Dr. Attia, Thank you for your response. Out of curiosity is there a reason you can’t weigh in in my results? Is it that there isn’t enough information or maybe my results are controversial? I don’t know if my Doc. is versed in reading NMR results. There were 2 labs he told me I could go to and later i learned that one does standard lipid panel and the other NMR. My doc didn’t specify which he only said it doesn’t matter. I picked the NMR by accident because it was closer. When I got the results I was confused since I never saw such results. When I started researching I found some info stating the total ldl-p number was most important then other info stating small ldl number was most important. I got very confused. Got even more confused when my results show hdl-p total, small ldl-p, ldl size all in the low risk range. Other results were:
Hdl-p total 43.4
Large VLDL-P less than 0.7
Small ldl-P 123
large hdl-p 10.7
VLDL size 36.0
ldl size 21.8
hdl size 9.5
lp-ir score 7
Total lpl-p 1933
All of the above are listed in the Lower cvd risk category and I am show in Large Pattern A.
If any of this helps I would really appreciate your thoughts. But I apologize if you still can’t comment. Thanks in advance.
No, it’s because I can’t practice medicine over the internet.
Peter,
I started on a low-carb, high-fat (LCHF) diet a couple months ago, and just had an NMR Lipoprofile done. My LDL-P is extremely high. Unfortunately I don’t have a baseline from before I started LCHF, so I’m not sure what to make of the results, especially as I am also losing weight.
Do you have any recommendations for finding a doctor who is knowledgeable about these matters? It seems like there are so many factors, and so much conflicting information (it’s LDL particle size that matters, no, it’s particle count; no, LDL is irrelevant, it’s HDL / triglyceride ratio that’s important, etc etc).
As a reasonably intelligent person with a strong math/science background, I’m doing the best I can to understand this stuff, but it would be nice to have a doctor who can give sage counsel. I fear that if I go to a doctor at my current medical practice, I would simply be told “your LDL-C is high; eat heart-healthy grains, cut back saturated fat, and here’s a statin.”
So how do I find a doctor who is up on the latest research about diet, metabolic syndrome, and cholesterol, who can advise me in my journey towards better health?
Check on LecturePad or with FHIT.
Hello Peter,
Are the data from Jim Otvos that you showed here published now?
If you have it, would you please give us the citation?
I am persuaded, but need to prepare for persuading my internist to order an apo B or NMR test for me.
Thanks.
J Clin Lipidol. 2011 ; 5(2): 105–113
So what is the blood cholesterol measurement?
Is it the cholesterol in each lipoprotein?
Is it the whole lipoprotein?
Isn’t the free cholesterol content quite the same among lipoprotein subclasses.
Free cholesterol composition of lipoprotein classes:
https://lipidlibrary.aocs.org/Lipids/lipoprot/index.htm
https://themedicalbiochemistrypage.org/lipoproteins.php
https://bit.ly/OG3V09
Plasma cholesterol measures the concentration of cholesterol in the specific lipoprotein (e.g., HDL-C, LDL-C, TC-C).
Hi Peter,
one of your links is not working. It is the one in the following text: “The figure below, from the Journal of Clinical Lipidology, shows the cumulative incidence of cardiovascular events (e.g., myocardial infarction, death) over time in three sub-populations:”
I think this is a working link for that paper:
https://www.ncbi.nlm.nih.gov/pubmed/21392724
Best regards
I too never thought I’d find a guy who was both normal(ish) and nerdy enough to put up with my nutrition science ramblings. Luckily, at least one such guy existed, but the trade off is I have to listen to his engineering talk. ‘Tis a small price to pay.
Thanks so much for the EXCELLENT series! I wish all my dietitian friends would read this. We (dietitians) are an embarrassment to the field nutrition science with our outdated advice!
Angela, you may have just posted the comment of the month!