
Want to catch up with other articles from this series?
- Studying Studies: Part I – relative risk vs. absolute risk
- Studying Studies: Part II – observational epidemiology
- Studying Studies: Part III – the motivation for observational studies
- Studying Studies: Part IV – randomization and confounding
- Studying Studies: Part V – power and significance
- Ask Me Anything #30: How to Read and Understand Scientific Studies
As we set off on our inaugural Nerd Safari, we think a primer on interpreting research—“studying studies,” so to speak—might be helpful. This Nerd Safari will be the first in a series that explores just that: how does one actually read and make sense of the barrage of “studies” cited? Relative and absolute risk, observational studies and clinical trials, power analysis and statistical significance, the myriad biases and threats to internal validity are some of the larger themes throughout the series.
There’s almost an endless number of topics within topics (e.g., how do meta-analyses work and why we should be skeptical of them) that we may skim over today, but dig into tomorrow: in these cases we’ll cover a number of them in more detail in the future and update the links in this original series. Similar to going on a safari in the same place every few years, observing animals in their natural habitat, and enjoying different experiences each time: learning something new, seeing something new—when you come back to a Nerd Safari, you may pick up a new piece of knowledge or visit a new link on our site that wasn’t there before, and expand your knowledge.
For more on this topic, Layne Norton, a returning podcast guest, also has a guide on “How to Read Research.”
So without further ado, let’s get on with the Safari…
§
“There are three kinds of lies: lies, damned lies and statistics.” – MARK TWAIN
A lie is defined as an intentionally false statement. Statistics are a special kind of false statement. We’re speaking of a kind of unwitting chicanery: interpreting and promulgating statistics in a manner that often exaggerates associations, making things appear more meaningful than they are. The statistic may be more damaging in this respect. The statistic allows one to be truthful, but at the risk of fooling other people, and perhaps more importantly, fooling oneself. “Figures often beguile me,” wrote Twain in his autobiography, “particularly when I have the arranging of them myself; in which case the remark attributed to Disraeli would often apply with justice and force: ‘There are three kinds of lies: lies, damned lies, and statistics.'”
The context? Twain is determining his writing output and comparing it to when he was younger. He at first seems to deduce that his production has slowed over the years. Looking at the numbers, the volume of words produced is on the decline. He then realizes that although he is creating a smaller amount of writing in a day’s work, in fact, he has maintained his production rate of about 375 words per hour. He’s just working shorter days.
This perhaps illuminates the most critical point. Statistics can be both persuasive and misleading if we’re not extremely careful. It is self-persuasion that we must vigilantly guard against if we want to establish reliable knowledge about the world, and ourselves.
Addressing Caltech grads about good science, Richard Feynman said:
“The first principle is that you must not fool yourself—and you are the easiest person to fool. So you have to be very careful about that. After you’ve not fooled yourself, it’s easy not to fool other scientists. You just have to be honest in a conventional way after that. . . . I’m talking about a specific, extra type of integrity that is not lying, but bending over backwards to show how you’re maybe wrong, that you ought to do when acting as a scientist. And this is our responsibility as scientists, certainly to other scientists, and I think to laymen.”
“Cholesterol-fighting drugs lower risk of Alzheimer’s disease”
Examples are often the best way to see how this works. In December 2016, an exciting headline from the AAAS1The American Association for the Advancement of Science (AAAS), which publishes the very prestigious journals Science, Science Translational Medicine, Science Signaling, Science Advances, Science Immunology, and Science Robotics. made the news: “Cholesterol-fighting drugs lower risk of Alzheimer’s disease.”
The article reports on an observational study2“In fields such as epidemiology, social sciences, psychology and statistics,” Wikipedia notes, “an observational study draws inferences from a sample to a population where the independent variable is not under the control of the researcher because of ethical concerns or logistical constraints.” of 399,979 statin users published in JAMA Neurology. Investigators examined the risk of developing Alzheimer’s disease (AD) among subjects who were “high-exposure” (i.e., high or frequent users)3“Individuals categorized as having high-exposure fell into at least the 50th percentile of days of filled prescriptions in a given year for at least 2 years during 2006, 2007, and 2008,” according to the study. versus “low-exposure” statin-users. Reportedly, among women who were high users of statins, the incidence of AD was 15% lower. Among men, the rate was 12% lower.
The lead author of the study, Julie Zissimopoulos, is quoted as saying, “We may not need to wait for a cure to make a difference for patients currently at risk of the disease. Existing drugs, alone or in combination, may affect Alzheimer’s risk.”
Understandably, with approximately 47.5 million individuals living with dementia worldwide, people are massively worried about the disease and are hopeful that a cure is in sight. With the number set to triple by 2050, people are justifiably desperate for good news.
Learning that you may be able to lower your risk of AD by 15% if you take statins, you may be jumping at the opportunity to “ask your doctor” about Lipitor.
What you may not glean from the article is that the 15% and 12% risk reductions are relative risk reductions. These are the numbers that are almost exclusively reported in the scientific papers and the lay press. They are in desperate need of context that so often remains absent.
The study itself showed that over the course of five years, 2% of people who reportedly didn’t take statins developed AD. People in the “low-exposure” group of statin users are associated with about a 1.6% incidence of AD. For high-exposure users, a 1.5% incidence.
Taking the study at face value, and ignoring issues like healthy user bias, side-effects, unintended consequences, to name but a few,4Investigators try to decrease the potential for noise using various methods. it is suggesting that when you are about 75 years old, you have a 2% risk of developing AD by the time you reach 80. But if you take a lot5That is, you “fell into at least the 50th percentile of days of filled prescriptions in a given year for at least two years,” in the study population. of statins, your risk for developing AD is 1.5%. Your odds go from 2-in-100 to 1.5-in-100.
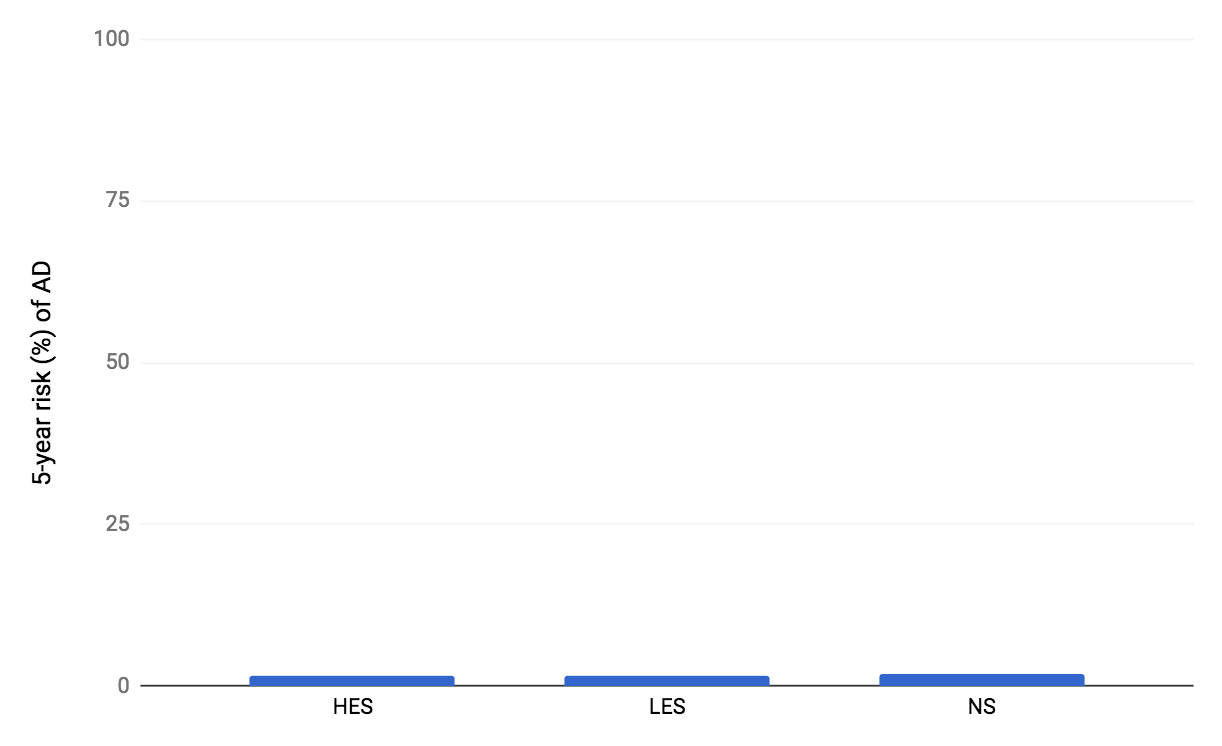
Figure 1. Estimated absolute 5-year risks for developing AD from the Zissimopulous et al., 2017 study. HES indicates high-exposure users. LES indicates low-exposure users. NS indicates non-statin users (i.e., non-users).
But taking the study at face value is perhaps one of the most common thought experiments under the guise of reality that humans engage in: we often don’t take into account the myriad ways in which a study can be flawed. We’re extremely messy creatures. There are so many moving pieces (e.g., people who take statins more frequently than people who don’t may have, or have had, different exercise habits, smoking history, access to healthcare, adherence to other medications, socioeconomic status, education) that we can knowingly and unknowingly measure (but don’t, or can’t, or won’t) that may influence the results. When the differences between groups are especially small, virtually anything not accounted for can distort reality.
According to the study, more adherent statin users had about a 0.1% lower risk for AD compared with their less adherent counterparts, in absolute terms. What’s perhaps most remarkable about this comparison, is the compliance or adherer effect is quite literally what this study tested: the individuals categorized as high-exposure “fell into at least the 50th percentile of days of filled prescriptions in a given year for at least two years,” compared to the other uses (i.e., low-exposure users fell below the 50th percentile) during the first three years of the investigation (starting in 2006), according to the authors. Think about this for a moment.
“Quite simply,” writes Gary Taubes in his New York Times Magazine article, “Do We Really Know What Makes Us Healthy?“, “people who comply with their doctors’ orders when given a prescription are different and healthier than people who don’t.”6This article (“Do We Really Know What Makes Us Healthy?“) is not only on the short-list (scroll to the bottom for a few favorites) of pieces one can read to sharpen his or her critical thinking skills as it pertains to science and health, it also serves as an excellent primer for an upcoming post on the Women’s Health Initiative and Hormone Replacement Therapy. It’s even possible that a healthy-user bias can make a harmful effect appear as if it’s protective.
Let’s use a quick example to see how absolute risk and relative risk is calculated. Imagine an intervention that lowers relative risk by 85% (Figure 2).
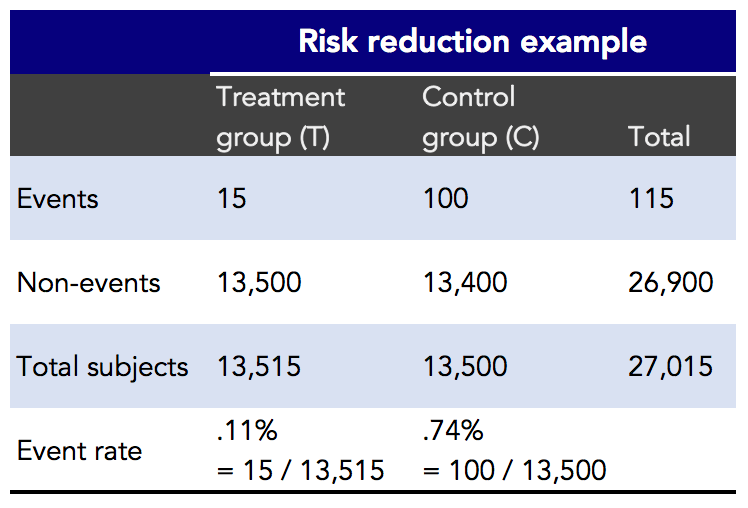
Figure 2. Risk reduction example.
In the risk reduction example, you can see that there were 27,015 subjects in the trial. The intervention, or treatment group, had 15 (adverse) events out of 13,515 subjects. The control group had 100 events out of 13,500 subjects. The event rate reflects the percentage of events that occurred in each group. From these results, let’s see how absolute and relative risk are calculated (Figure 3).
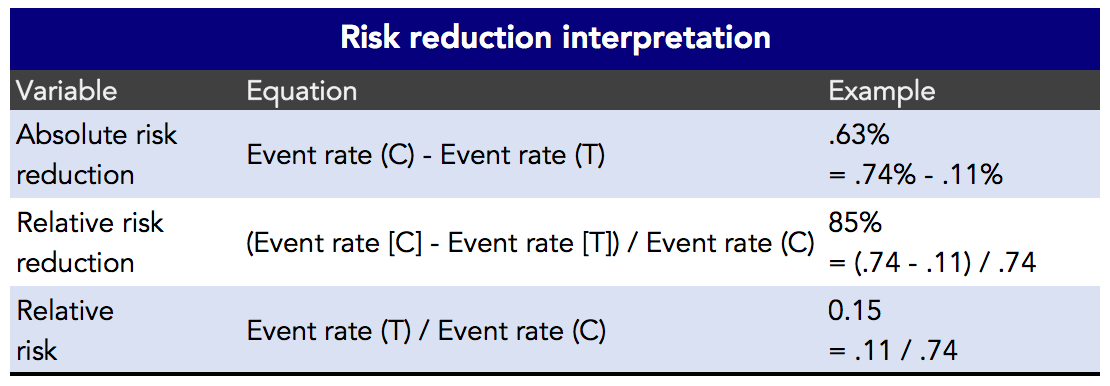
Figure 3. Risk reduction interpretation.
The way most studies interpret and report the results is through relative risk reduction (or increase). Why? Frankly, because it’s more headline-worthy, we suppose. It’s hard to get out of bed to read about a whopping 0.63% reduction in absolute risk when you could be reading about a—wait for it—85% relative risk reduction! In this example (Figure 3), the relative risk reduction is 85%. And, with this particular example, the absolute risk reduction is 0.63%. The absolute risk is quite small, so the relative risk can be misleading. To put this in perspective, in 1950 the epidemiologist Richard Doll believed that the risk for developing lung cancer was 50 times greater for someone who smokes 1.5 packs a day compared to a nonsmoker. In other words, Doll thought that heavy (i.e., > 25 cigarettes/d) smokers were 5,000% more likely to get lung cancer. But even this doesn’t tell the whole story. In absolute terms, studies have suggested that the lifetime risk of lung cancer for a never-smoker might be about 0.5%. For a smoker, the risk is closer to 25%. This is a 50-fold difference that has a very real impact on both public, and individual, health.
Imagine if the risk of getting lung cancer for a never-smoker was 0.005%, or 1-in-20,000, and the risk for a smoker was 0.5%, or 1-in-200. In this case, smokers would be 100 times more likely to get lung cancer than never-smokers (i.e., 10,000% more likely), but the absolute risk difference is 0.5% (i.e., 0.5% – 0.005%). While the smoking risk is very real, and a 100-fold increase is scarier than a 50-fold increase, it’s likely a lifetime smoker would rather hear that he now has a 1-in-200 (i.e., 0.5% absolute risk increase and 10,000% relative risk increase) chance of lung cancer than learning he has a 1-in-4 chance (i.e., 25% absolute risk increase and 5,000% relative risk increase).
Let’s now go back to our more practical example: the observations of statin use and the incidence of AD (Figure 4). Note that this study compared high-exposure vs. low-exposure statin users, but excluded non-users as a control group when calculating relative risk. They did note (Figure 1) that the incidence of AD in nonusers was just under 2% (1.99%) over the same time period.7“Nonusers are likely a weaker control group than statin users with low-exposure in analyzing the association between statin use and AD incidence,” the authors write. “Nonusers are individuals without a hyperlipidemia diagnosis or individuals with undiagnosed hyperlipidemia or diagnosed hyperlipidemia who are not being treated or not adhering to medication.”
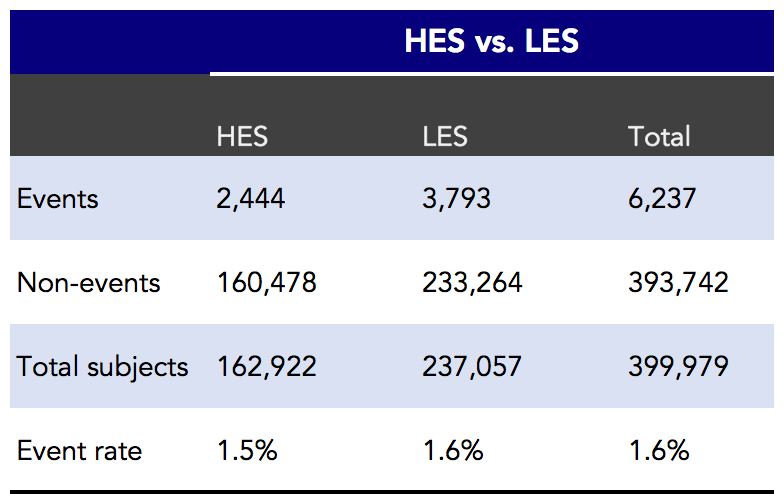
Figure 4. High-exposure statin users (HES) versus low-exposure statin users (LES) and annual risk for AD. Events indicates cases of AD.
More adherent statin users had about a 0.1% lower risk for AD compared with their less adherent counterparts (1.6% – 1.5%), in absolute terms.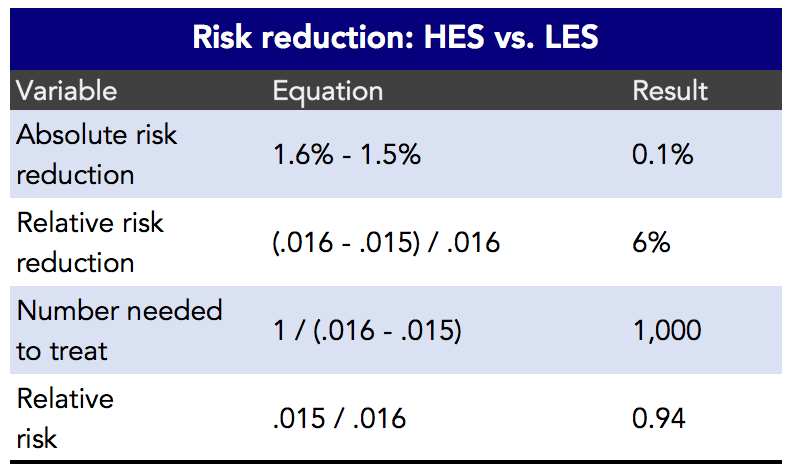
Figure 5. Estimated risk reduction between high-exposure statin users and low-exposure statin users.
It hardly seems justifiable for a newspaper to lead with a headline informing the public that a prospective observational study found an association between two variables of less than two-tenths of one percent (Figure 5), but that’s what they are often reporting, knowingly or unknowingly. And remember, oftentimes, these associations don’t play any causal role (i.e., they don’t have any effect). Always keep absolute risk in mind when you hear about the risk of an event increasing or decreasing.
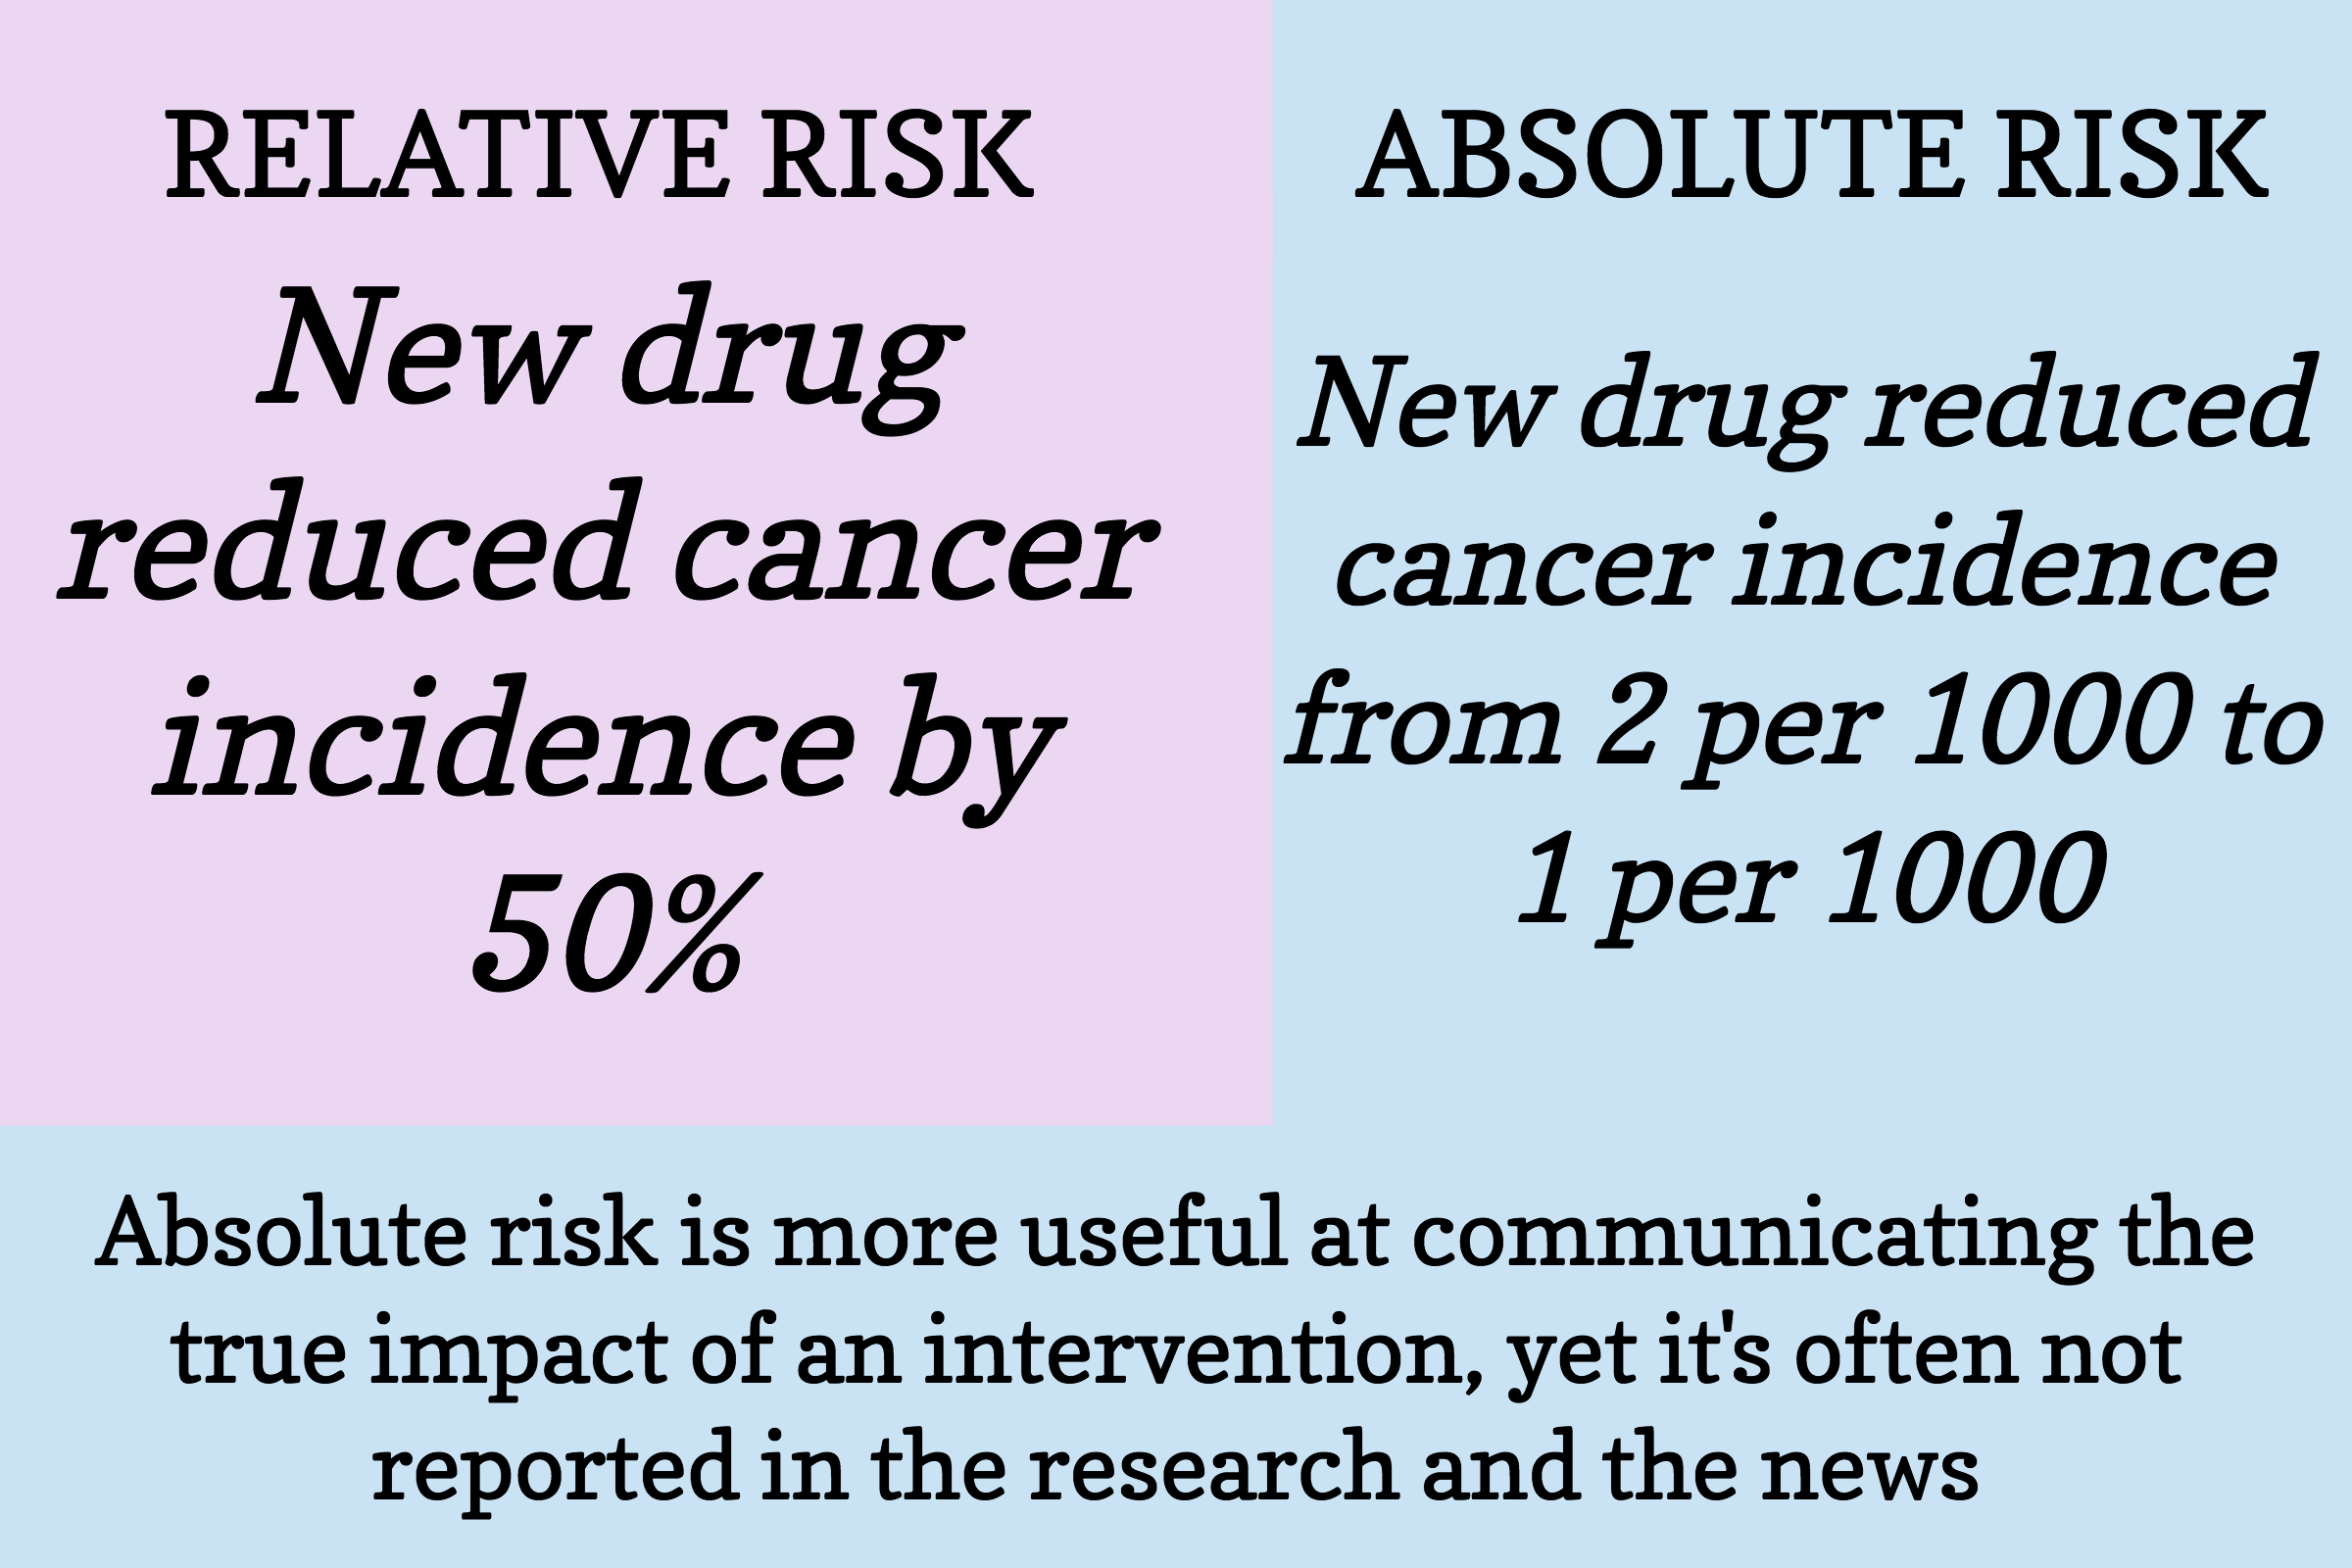
Figure 6. The difference between relative risk and absolute risk.
We’re intentionally belaboring the point that you should seriously question the validity of virtually any study and its implications. It’s all too human to look at the problem and think that we have to act now, we have to do something, we don’t have time to hem and haw. But science is all about the hem and the haw: the hesitation, the indecisiveness (science is never necessarily settled). Criticism is far more useful than praise in science. “The research worker is sometimes a difficult person,” wrote W.I.B. Beveridge in The Art of Scientific Investigation (1957), “because he has no great confidence in his opinions, yet he also is [skeptical] of others’ views. This characteristic can be inconvenient in everyday life.” Indeed.
“Politeness, Francis Crick said over the BBC at the time he got the Nobel prize, is the poison of all good collaboration in science,” writes Horace Freeland Judson in The Eighth Day of Creation: Makers of the Revolution in Biology.
“The soul of collaboration is perfect candor, rudeness if need be. Its prerequisite, Crick said, is parity of standing in science, for if one figure is too much senior to the other, that’s when the serpent politeness creeps in. A good scientist values criticism almost higher than friendship: no, in science criticism is the height and measure of friendship. The collaborator points out the obvious, with due impatience. He stops the nonsense . . .”
Unfortunately, the kind of self-criticism and skepticism necessary to mitigate foolishness (i.e., bending over backwards to communicate all of the ways in which the findings could be wrong) is virtually absent at every level: the “scientists,” peer review, the scientific journals, the media, and “the laymen.” And we include ourselves, your Nerd Safari guides, on this list. It’s too damn hard to always think critically—and we are not wired to do it as humans—but we must always strive for it.
Whether we like it or not, it’s more helpful to be “difficult” people when judging the merits of an argument or hypothesis—even (especially) when it’s our own. It behooves us to understand the difference between relative risk and absolute risk—and to always report both to provide context.
