In 2012, the Journal of the American Medical Association (JAMA) published a study entitled Effects of Dietary Composition on Energy Expenditure During Weight-Loss Maintenance. While I’m guessing most readers have not read this study, I’m pretty sure most of you have heard about the results as it was all over the news this week.
I was fortunate enough to read an embargoed copy two weeks prior to publication with the caveat that I could not speak about it until it was released publicly. Furthermore, I’m friends with one of the reviewers who told me months prior that “a very interesting paper was going to hit a high–impact factor journal very soon.” Completing my disclosure, I had become acquainted with the senior investigator on this study, Dr. David Ludwig at Harvard.
This study sought to test an important question:
When an overweight or obese person loses weight, how does their choice of macronutrients impact their tendency to regain lost weight?
This is important, of course, because as most of us know that while losing weight is difficult, keeping it off is even more difficult. In fact, as the authors point out, only about 15% of people who lose 10% of their bodyweight can maintain the weight loss for up to one year. The obvious question is why?
You’ll recall from this post, that we must always obey the First Law of Thermodynamics. In other words, we accumulate stored energy (e.g., fat mass) when we are in a positive energy balance and we lose stored energy when we are in a negative energy balance.
Energy balance is a function of two variables:
- Energy input – what we eat
- Energy output – what we expend
Furthermore, energy output can be broken down into four sub-components:
- Resting energy expenditure (REE) – the amount of energy expended to stay alive at rest (e.g., energy required for basic cellular function like ion transport and respiration)
- Thermic effect of food (TEF) – the amount of energy required to process and digest food (I also include in this category the amount of energy lost as undigested material in stool)
- Activity energy expenditure (AEE) – the amount of energy expended by exercise and non-exercise movement (I consider these as two forms of expenditure)
The sum of REE, TEF, and AEE is called, appropriately, total energy expenditure (TEE).
Of these, REE is the dominant “sink” of energy output in most people, and it is generally proportional to bodyweight. I’ll cover the importance of this momentarily.
The traditional model of obesity, the so called “calories-in-calories-out” model, says that obesity is caused by the energy input terms exceeding the energy output terms. In the words of one prominent obesity researcher, “While it is mathematically true that someone who has gained weight has consumed more energy than they have expended, using the First Law to explain why someone gains weight is of little help. The First Law is descriptive but not explanative.”
I couldn’t have said that better myself. The mistake most folks make when using the First Law to explain weight gain (versus using the First Law to describe weight gain) is that they lose sight of the fact that these variables – input, REE, TEF, AEE – are linked. They are dependent on each other. They don’t exist in isolation.
Proponents of the Alternative Hypothesis argue that intake (i.e., food) plays a role on hormones and enzymes in the body that have a resulting impact on energy output, and even subsequent input. For example, eating one food over another can increase or decrease appetite, increase or decrease REE, increase or decrease AEE, and even impact TEF. While the effect on each of these may be modest in isolation, even small changes over the course of days can result in significant changes over months or years.
What does all of this have to do with this study?
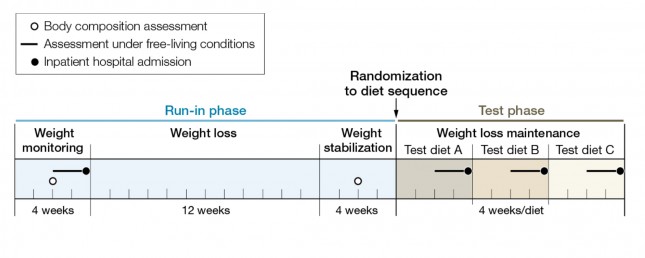
The figure below shows how the study was conducted. This was a prospective design 3-way crossover study of 21 overweight or obese subjects with an average BMI of 34.4. Each subject underwent a 20-week run-in phase, which is very common in weight-reduced studies. During the run-in phase all baseline measurements are collected, including body composition by DEXA, TEE by doubly-labeled water, substrate utilization by respiratory quotient, and plasma levels of various blood markers (e.g., lipids, blood chemistry, hormone levels). No, unfortunately, lipoprotein particles were not counted.
During the 12 week weight loss phase caloric intake was reduced until each subject lost 12.5% of their starting (stable) weight. For the final 4 weeks of the run-in phase energy intake was again calibrated to hold their now-reduced-weight stable.
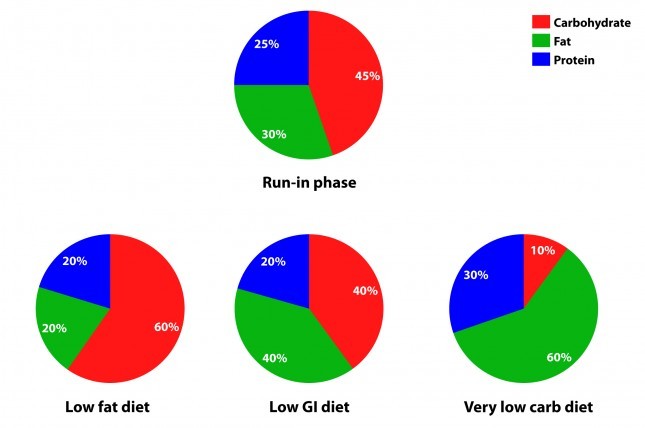
The figure below summarizes the data from Table 1 of the paper, showing the breakdown of macronutrients during the run-in phase and the subsequent 3 dietary interventions, each lasting 4 weeks. Again, each subject did each diet for 4 weeks due to the 3-way cross-over design. In other words, each subject spent a total of 32 weeks in the study (20 weeks of run-in and 3 x 4 weeks of each intervention diet).
How did the diets impact energy expenditure?
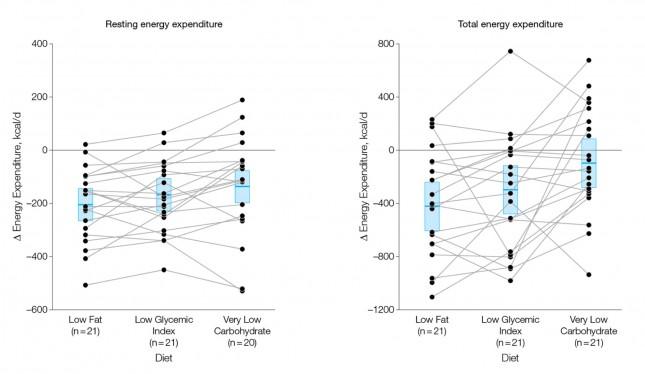
The figure below shows the change in REE and TEE measured for all groups. There was no difference in total physical activity or exercise, so presumably there was no appreciable change in AEE. I could not find a mention of TEF, suggesting it was not measured. These figures are a bit ugly, but they convey helpful information. Each dot represents an individual subject and the lines joining each dot allow you to see the change for each subject across the 3 diets. The blue box shows the mean change (middle of the box) with the 95% confidence interval above and below. The height of the box is therefore two standard deviations.
A few things stand out from these results:
- The group consuming a very low carbohydrate diet had a higher REE and TEE than the low GI group, which had a higher REE and TEE than the low fat group. In other words, the fewer carbohydrates in the diet, the higher the resting and overall expenditure. This is actually the sine qua non of the alternative hypothesis: something beyond the actual number of calories is playing a role in how the body expends energy.
- As expected, given that each subject was starting from a weight-reduced state, the REE was lower for each group, relative to their baseline. REE is highly (though clearly not entirely) dependent on body mass.
- There is enormous variation between subjects by diet type. For example, at least one subject saw a dramatic increase in TEE on the low GI diet versus the other two, while another saw the greatest TEE on the low fat diet. This speaks to a theme I iterate on this blog: be willing to self-experiment until you find what works for you.
How did the diets impact metabolic parameters?
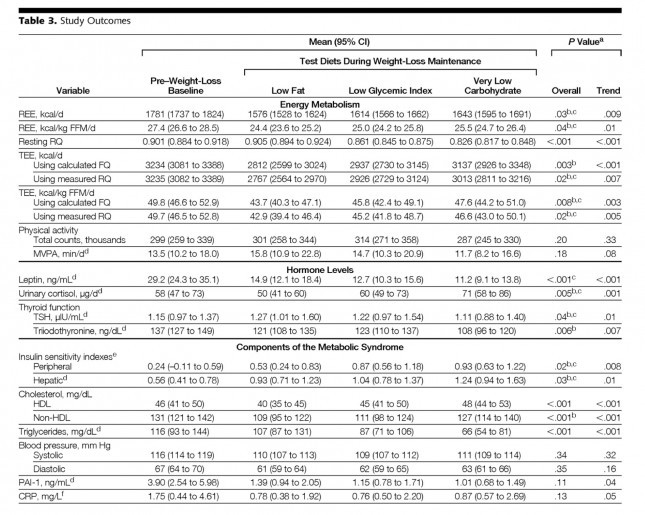
The table below shows the changes in hormone levels and metabolic syndrome biomarkers.
One thing that really jumped out at me was that it is quite likely that not one of the subjects in the study met the formal criteria for metabolic syndrome. MS requires at least 3 of the 5 parameters (blood pressure, waist girth, fasting glucose, HDL-C, and TG) exceed threshold. The thresholds are as follows:
- BP > 140/90 [No subject met this at baseline]
- Waist girth > 40 inches (men), >35 inches [Not reported, but let’s assume at least some subjects met this]
- Fasting glucose > 100 mg/dL [Not reported, but let’s assume at least some subjects met this]
- Fasting TG > 150 mg/dL [No subject met this at baseline]
- HDL-C < 40 mg/dL (men), < 50 mg/dL [No male subject met this, but it’s possible some female subjects did]
This may speak to the age of the subjects, which averaged 30.3 years, but I would have expected a worse set of baseline metabolic parameters. It also speaks to the point that just because someone is obese doesn’t mean they have metabolic syndrome and vice versa.
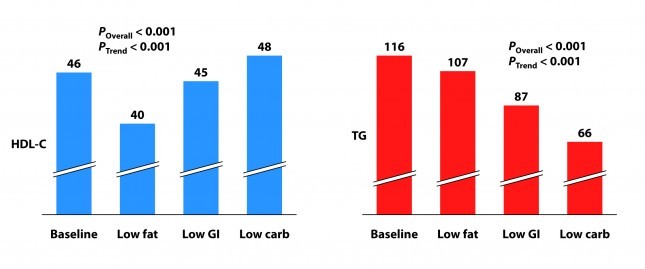
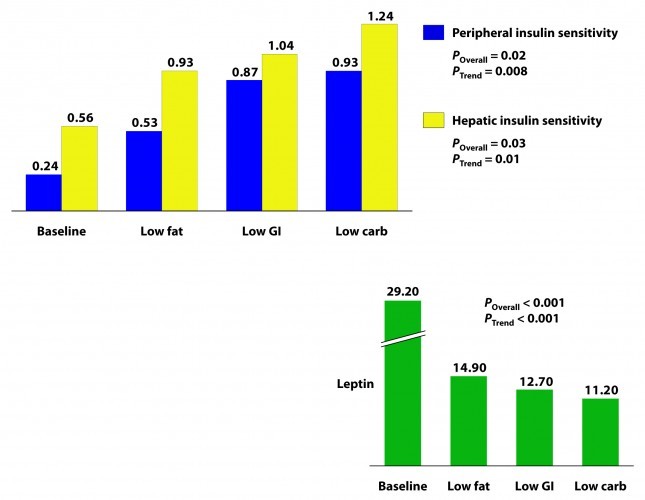
Tables are a bit cumbersome, so I took the liberty of graphing some of these results, mostly because I just can’t resist playing with think-cell (PowerPoint without think-cell is simply a tool for torturing people.)
I’ve explained p-values before, but let me explain the two types of p-values reported above and below.
P_overall is the p-value testing the hypothesis that the mean outcome of the three diets was equal. The smaller this value, the more likely the differences were not due to chance. As a general rule, if the p-value is greater than 0.05 we say the difference is “not significant.” Most use a more stringent requirement of 0.01 to hit the mark of statistical significance.
P_trend is the p-value testing the hypothesis that the mean outcome of the three diets showed a trend from low fat to low GI to low carbohydrate.
Not surprisingly, the low fat group experienced a significant reduction in HDL-C. It’s been documented many times that dietary fat raises HDL-C and dietary carbohydrates reduce HDL-C.
Each group also experienced a reduction in triglyceride (TG) level. Since we know carbohydrates, not fat, raise TG, you may wonder why this was even the case in the low fat group, which actually increased carbohydrate intake. I suspect it was a carbohydrate “quality” issue. I’m guessing the baseline levels reflect more sugar consumption than the low fat phase. Nevertheless, and again not surprisingly, the high fat-low carbohydrate group experienced the greatest improvement in plasma TG levels.
Insulin sensitivity was measured according to a protocol in this paper. The protocol uses time blood draws after an oral glucose challenge. The higher the index, the greater is the insulin sensitivity. Each diet improved both hepatic and peripheral insulin sensitivity and both the overall differences and the trends were significant.
If insulin is the most important hormone regulating fat metabolism and accumulation, leptin is certainly a close cousin. Leptin is a hormone secreted by fat cells that plays an important role in regulating appetite and some metabolic functions. High levels of circulating leptin can be suggestive of leptin resistance which, like insulin resistance, tends to be a marker for metabolic derangement. I’ll write a lot about leptin in subsequent posts. While leptin sensitivity was not directly measured as insulin sensitivity was, the significant reduction in circulating leptin levels suggested it was also improved in all groups, though greatest in the low carbohydrate group.
How did the diets impact inflammation?
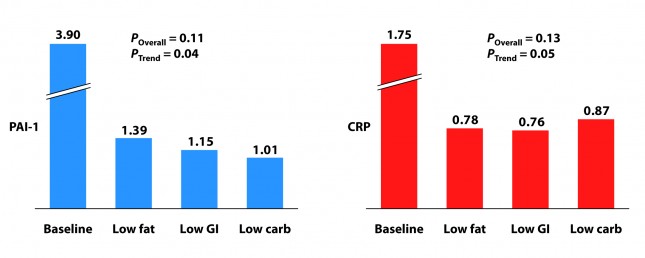
Two markers for inflammation were evaluated in this study, C-reactive protein (CRP) and plasminogen activator inhibitor-1 (PAI-1). Neither is particularly sensitive in the way, say, Lp-PLA2 is (this was discussed in the cholesterol series). Nevertheless, they give us some indication of how much overall inflammation exists in the body.
Each group experienced a significant decline in both PAI-1 and CRP, and there was no significant difference between the groups for either marker. However, the trend was (barely) significant favoring the low carbohydrate group for PAI-1 and favoring the low GI group for CRP. Sorry low fat, you didn’t win either.
I know what you’re thinking because it was the first thought that ran through my mind when I saw this table: What? Is this meaningful or is it an example of statistical chicanery? I’ll let you decide, but I’m pretty sure I know the answer.
Because I know some of you will ask, I will comment in a subsequent post on the changes seen in TSH, T3, and cortisol. These topics deserve a post of their own.
What should have been taken away from this study?
This study reproduced a number of results which have been noted for decades:
- Low carbohydrate, high fat diets reduce TG and raise HDL-C more than other diets.
- Low carbohydrate, high fat diets improve insulin sensitivity more than other diets.
It never hurts to hammer those findings home again, but the really dramatic finding of the study was the impact of macronutrient balance on REE and TEE. At previous count (circa 2011), 81 studies over the past 80 years involving 4,094 subjects for more than 1.2 million subject-days have attempted to ask this question – many of them attempting to “prove” that all calories are created equally. While none (i.e., not one) have refuted the alternative hypothesis, most of them had enough methodologic limitations that it was difficult to know for certain if the type of food – rather than the number of calories – was playing an important role.
This study, while still limited (e.g., short duration, small sample size), makes one of the more compelling cases that all calories are not created equally.
What was taken away from this study?
The embargo on this paper was lifted at 4:00 pm EDT on Tuesday, June 26, 2012. Within about 30 minutes I was being bombarded with news stories that, if you hadn’t read the study, as virtually no one actually does, would suggest that the low carbohydrate diet was the “worst” of the three diets tested. This was not universally true, in fairness to the media, but there was no shortage of this sort of commentary:
USA Today
…the authors note a downside to the low-carb diet: it appears to raise some risk factors for heart disease.
Marion Nestle, a nutrition professor at New York University, says longer studies conducted among people in their own environments, not with such controlled meals, have shown “little difference in weight loss and maintenance between one kind of diet and another.”
George Bray, an obesity researcher at Pennington Biomedical Research Center in Baton Rouge who has also studied this topic and who wrote the accompanying editorial in JAMA, says that other studies “show that you can do well on any diet as long as you stick to it. Adherence is the major key for weight loss and maintenance. There is no magic in any diet.”
The New York Times
…the low-carb diet “also had marked problems. It raised levels of CRP (c-reactive protein), which is a measure of chronic inflammation, and cortisol, a hormone that mediates stress.”
The Wall Street Journal
…the low-carb diet had the biggest boost in total energy expenditure, burning about 300 calories more per day than those on the low-fat diet — about the same as an hour of moderate exercise. But that bump came at a cost: increases in cortisol, a stress hormone, and a measure of inflammation called CRP, which can raise the risk of developing heart disease and diabetes.
Some of these comments were patently false (e.g., “the low carbohydrate diet raised levels of CRP” according to the New York Times), reflecting utter incompetence, but most of them commit a different journalistic sin: They miss the forest while machinating on one leaf.
Tragically, most people (unfortunately this includes physicians, dietitians, and politicians) have neither the time nor scientific discipline to wade through these studies and understand their implications. Instead, they rely on “reputable” journalists to translate for them.




Hey all,
Not sure where else to add this, but I’d be interested to hear your thoughts on this ‘news’ piece regarding gut bacteria/obesity.
https://www.bbc.co.uk/news/health-22458428
Have you read/explored this area at all?
I thought of this thread and the NuSci initiative while reading this article in the WSJ today… https://online.wsj.com/article/SB10001424127887323398204578488290293116774.html?mod=WSJ_hp_EditorsPicks
Fascinating that there is a huge debate going on regarding fluoridated water but very little (if any) science! We’ve been doing this for 50 years but I’m not sure we can definitively answer the question on the pros/cons of ingesting fluoride for tooth decay. Conclusion…we need more NuSci-initiatives.
Also for those that missed Dr. Attia last weekend…
https://online.wsj.com/article/SB10001424127887323372504578466992305986654.html?KEYWORDS=peter+attia#articleTabs%3Darticle
I found a free journal that cites a number of references to flow-mediated dilation (FMD) as a means of assessing risk from diet. https://animalscience.psu.edu/files/pdf/AT03-6-1-03.pdf .
Here is a reference that indicates that reusing cooking fat as opposed to using fresh fat may increase risk https://content.onlinejacc.org/article.aspx?articleid=1125686 .
Fatty acids increase vasodilation https://content.onlinejacc.org/article.aspx?articleid=1126611 .
Many low fat proponents use FMD as their supporting logic. These sources would suggest that the topic is open for debate.
Interesting, Mike. Thanks for sharing.
I found your blog this morning, and I’m trying to wrap my brain around it. It’s pretty hard to think of going against the grain in terms of diet and healthy eating in popular culture. I am wondering… I’m not heavy. In fact, I would be classified as thin by most people. I think perhaps I could lose some fat based on my (somewhat inaccurate, likely) body fat scale, but it’s not apparent to most. I run long distance, am 44 and my cholesterol was very low a few years ago– in the range of “too low,” although I haven’t been able to find out much about what that could mean. My blood pressure is always low, as is my resting heart rate. Last year, I found out that I had anemia (since corrected with supplements) and my that I needed levothyroxine, as well. About 10 days ago I ran another ultramarathon, and in my recovery quest I began wondering about inflammation and healing, which is how I found your site. What I’m wondering is… do you think that a person who is not trying to lose weight and who typically “carbo loads” prior to races (and, truth be told, other times as well) is also going to see particular health benefits as well with higher good fats and low carbs? I felt like I had a fairly healthy diet (low added sugar, fruits and veggies) but not I’m wondering if I could be healthier, faster and have less creakiness in recovery if I considered upping my fats. It has never occurred to me. I have had what might be arthritis in my left hip for about 3 years, and so I deal with that kind of inflammation (?) off and on. I’m becoming suspicious that I have followed the wrong path in eating less meat and saturated fats and more carbs. Ugh. It’s not a good realization.
Dear Dr. Attia
I was an obese 180 at 5’4″. I had always been fit and slender, competed on the swim team, spent hours in the gym, etc… At about 29 years old I started to develop a layer of fat that no amount of stair master would burn off and over the years the layer got thicker and thicker so by the time I was 40 I was obese, had no energy and was depressed all the time. I went to doctors who gave me the whole-grain, avoid red meat and fats mantra and I believed them. When my blood numbers started going in to the high risk areas of cholesterol and triglycerides I got really frightened. My dad’s family doesn’t seem to survive to 60, most are obese and dead of heart disease and cancer. I put everything I had in to diet and exercise and went back three months later. To my horror the numbers had gotten worse and I hadn’t lost any weight. The doctor said that maybe I was cheating and not recording the cheats. He looked at me like I was a liar. I really did not know what to do. Luckily, my type 1 diabetic cousin came to stay with me to help while my husband was ill and he brought with him a mountain of information about insulin; what it is and does. It took a few weeks to pound it in to my head but I eventually decided that maybe there was no reason not to try this “paleo” diet but went against everything I knew. We went through my pantry and he explained about glycemic indexes and we ended up throwing out most everything. The first month was horrible but after 6 months I had dropped 35 pounds and my blood numbers fell to normal ranges. I now don’t even look at bread and I automatically scan menus looking for whole fish or chicken etc… I continue to improve.
This is a testimonial I am sure you hear often but really only sets the stage for my actual question. How do you avoid the anger towards the establishment? I feel like I was deliberately poisoned for profit. I am losing nearly all respect for the food and medical communities, especially the FDA. People at work ask how I lost weight. I tell them organic paleo diet. Veggies, fish, meat, eggs, nuts, etc… I tell them I dont watch fat calories and I practically drink coconut cream (god I love that stuff) and eat avacadoes almost every day. They say “but that is so unhealthy”. One lady said she couldn’t go on that diet because she was a type 2 diabetic and her doctor recommended a whole grain plan. I feel like I am spiralling into a very black rage. You are at the epicenter of all this and you see and know more than I do. How do you look at all these sick and dying people that are being lied to by “experts” and not feel the anger and helplessness? A quick investigation reveals these concepts were know over a hundred years ago but basically buried and discredited by lobby groups for wheat and corn growers, sugar, soft drinks and edible oils industries with major representatives sitting on the boards at the FDA. The science may not be “finished” but its not like there isn’t any. That type 2 I mentioned recently fell over because she got disoriented with vertigo and has lost sensation in her feet. She hit her head on the way down and was in the hospital for 3 weeks where they probably stuffed her full of bread and orange juice. How do you maintain your sanity?
To your last question, Jennifer… I’m not sure, but having folks you like to commiserate with sure helps. Thank you for sharing your story with me and the other readers.
Peter –
The lesson I take from this study, if I care about REE or TEE, is not that I should be on a low-carb diet. There’s too much individual variation for that to be the logical conclusion. Rather, because of that variability, I should conclude: (1) that diet can be important, (2) that it might be important for me, and (3) that I should personally test different diets to find out.
If I were trying to create a food pyramid for everyone, then the averages are important. Or if I were buying food for the Army, then perhaps I should let the average effects guide me. But otherwise, who cares how the diets affect others? I’m not eating for them. All any of us should care about is how each diet affects us, individually. (I suspect you agree.)
In other words, here we have researchers hoping for nice, tight data — with large variations between groups and small variations within groups. (Nothing like a home run, with both statistical and clinical differences. Of course, as an individual I should be fine with that too — so long as it gives me important information I can use.)
And I suspect researchers are frustrated when the opposite happens — when large variations within groups make the between-group differences statistically less significant, or insignificant. No researcher likes unexplained variations. But sometimes these unexplained variations can be just as valuable to us, as individuals.
Take this study as an example. What if we had the same individual variations, but the between-group averages were the same (no difference at all in the averages among the diets). It would be absurd to conclude that the diets had no significant effect on REE or TEE. On the contrary, the logical conclusions for the individual would be the same — that diets can matter, and I should find out which diet works well for me.
To summarize my point: In their fervor to find statistical differences (e.g., between/among groups), are researchers sometimes missing the more important clinical (or I want to say “personal”) significance their findings might have to us as individuals?
I suspect it would be hard to draw those conclusions with this study, from the individual’s perspective, if they hadn’t used a crossover design. Then the differences might remain completely unexplained.
As NuSI takes on similar studies, I hope you consider using crossover designs whenever possible. In a sense, it doubles the opportunity for important findings. (If the differences between groups are not statistically or clinically significant, then the differences within groups still might be, when viewed from the individual’s perspective.)
Thanks!
All good points.
Thank you for this post, and keep up the good work!
Peter,
Long time follower of your blog. Thanks for al the work and continuous education that you provide. Just finished reading “The China Study”. Would you be able to point me in the direction of some objective interpretation of this study. I found the author to very biased through the read and I am looking for some other perspectives to say the least. Thanks.
Best appraisals I’ve seen of the China study (not to be confused with The China Study) are by Denise Minger and Mike Eades. Easy to find on line if you search their names and content.
Hey Pete,
When does a journalist begin to provide a disservice to his/her readers?
When he picks up the pen!
All kidding aside, I really appreciate the objectiveness in the work you’ve been doing with NUSI.
Fortunately there are some good ones out there.
Thank you Peter for your phenomenal knowledge and interpretation. I am learning so much from your posts. Not only about the content of the study, but also the deeper terminology used in studies. I will be sharing this in the community and the MDs in my family. Onwards and upwards my friend!
Thank you, Karuna.
I was wondering when you might be getting to the subsequent post on the changes seen in TSH, T3, and cortisol. I just found your blog today and can see I am going to very busy reading. Very appreciative of all of the information here as it is put together extremely well. Thank you and again I am looking forward to reading your posts.
Is it possible that there was an agenda behind the analysis and policy recommendations? Where nefarious or not, it seems that they research and ignored or discarded research has been selectively interpreted and exaggerated to push a carbohydrate diet, hard to believe this was accidental, as there is big money to be made in the large scale production of various carbohydrate products.
Always possible…
I’m trying to find information about LCHF for gestational diabetes. I’d love to see this kind of analysis of this study https://care.diabetesjournals.org/content/early/2015/07/27/dc15-0515.abstract. (I realize that 40% carbohydrate is not very low carb.)
I read this per a friend’s suggestion. I have absolutely no idea what I just spent the last 30 minutes reading. Back to my oatmeal.
Hi Dr. Attia, insanely useful blog, thanks so much! Can you comment or link me to the blog you mentioned you would cover regarding the T3 TSH etc of this study?
best,
DAve
Hey Peter,
I have been having weight loss success on a ketogenic/VLCHF diet (I find it relatively easy to stick to) and seem to share your phenotype. But it seems to me that the author of this study continues to push the GI index as well, saying “LCHF is too hard to stick to long-term” and “most people do not need to restrict carbs to this level to see weight loss.” What do you think is the scientific truth in both of those statements? There is a new book where low-GI carbs are reintroduced in phase 2 after a LCHF beginning phase. I counted on Amazon a significant number of people who reviewed the diet negatively, saying it didn’t work for them. My hunch is that (for most of the ones who followed it properly) the diet’s failure was the reintroduction of significant carbs, regardless of GI. But you’re the doctor, so I defer to you on the issue…
In your experience do you think most of the human population can tolerate a reintroduction of low-GI carbs and maintain good bio markers/weight loss or is this once again “missing the forest for the trees,” and carbs must be limited overall, regardless of GI, for a dominant subset of the population?
Hey Peter –
Did you see the Ioannidis article in JAMA July 26 , 2016? Some very interesting reflections on the whole Theranos case. I was surprised by his take on the issue of self testing. Sometimes more and more data can be a problem .
Hi Peter,
What do you think of Stephan Guyenet’s take on the study? — https://wholehealthsource.blogspot.com/2016/07/nusi-funded-study-serves-up_6.html
Thanks!