July 3, 2012

Understanding science

Good science, bad interpretation

Read Time 9 minutes

In 2012, the Journal of the American Medical Association (JAMA) published a study entitled Effects of Dietary Composition on Energy Expenditure During Weight-Loss Maintenance. While I’m guessing most readers have not read this study, I’m pretty sure most of you have heard about the results as it was all over the news this week.

I was fortunate enough to read an embargoed copy two weeks prior to publication with the caveat that I could not speak about it until it was released publicly. Furthermore, I’m friends with one of the reviewers who told me months prior that “a very interesting paper was going to hit a highimpact factor journal very soon.”  Completing my disclosure, I had become acquainted with the senior investigator on this study, Dr. David Ludwig at Harvard.

This study sought to test an important question:

When an overweight or obese person loses weight, how does their choice of macronutrients impact their tendency to regain lost weight?

This is important, of course, because as most of us know that while losing weight is difficult, keeping it off is even more difficult.  In fact, as the authors point out, only about 15% of people who lose 10% of their bodyweight can maintain the weight loss for up to one year.  The obvious question is why?

You’ll recall from this post, that we must always obey the First Law of Thermodynamics.  In other words, we accumulate stored energy (e.g., fat mass) when we are in a positive energy balance and we lose stored energy when we are in a negative energy balance.

Energy balance is a function of two variables:

  1. Energy input – what we eat
  2. Energy output – what we expend

Furthermore, energy output can be broken down into four sub-components:

  1. Resting energy expenditure (REE) – the amount of energy expended to stay alive at rest (e.g., energy required for basic cellular function like ion transport and respiration)
  2. Thermic effect of food (TEF) – the amount of energy required to process and digest food (I also include in this category the amount of energy lost as undigested material in stool)
  3. Activity energy expenditure (AEE) – the amount of energy expended by exercise and non-exercise movement (I consider these as two forms of expenditure)

The sum of REE, TEF, and AEE is called, appropriately, total energy expenditure (TEE).

Of these, REE is the dominant “sink” of energy output in most people, and it is generally proportional to bodyweight.  I’ll cover the importance of this momentarily.

The traditional model of obesity, the so called “calories-in-calories-out” model, says that obesity is caused by the energy input terms exceeding the energy output terms.  In the words of one prominent obesity researcher, “While it is mathematically true that someone who has gained weight has consumed more energy than they have expended, using the First Law to explain why someone gains weight is of little help.  The First Law is descriptive but not explanative.”

I couldn’t have said that better myself.  The mistake most folks make when using the First Law to explain weight gain (versus using the First Law to describe weight gain) is that they lose sight of the fact that these variables – input, REE, TEF, AEE – are linked.  They are dependent on each other.  They don’t exist in isolation.

Proponents of the Alternative Hypothesis argue that intake (i.e., food) plays a role on hormones and enzymes in the body that have a resulting impact on energy output, and even subsequent input.  For example, eating one food over another can increase or decrease appetite, increase or decrease REE, increase or decrease AEE, and even impact TEF.  While the effect on each of these may be modest in isolation, even small changes over the course of days can result in significant changes over months or years.

What does all of this have to do with this study?

The figure below shows how the study was conducted.  This was a prospective design 3-way crossover study of 21 overweight or obese subjects with an average BMI of 34.4.  Each subject underwent a 20-week run-in phase, which is very common in weight-reduced studies.  During the run-in phase all baseline measurements are collected, including body composition by DEXA, TEE by doubly-labeled water, substrate utilization by respiratory quotient, and plasma levels of various blood markers (e.g., lipids, blood chemistry, hormone levels).  No, unfortunately, lipoprotein particles were not counted.

During the 12 week weight loss phase caloric intake was reduced until each subject lost 12.5% of their starting (stable) weight.  For the final 4 weeks of the run-in phase energy intake was again calibrated to hold their now-reduced-weight stable.


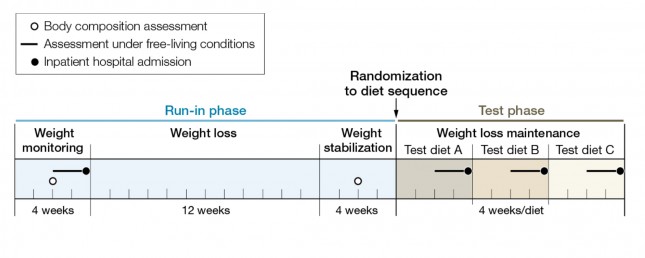
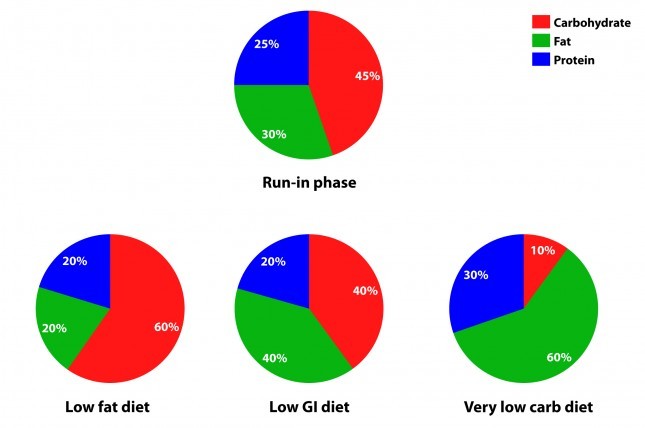
The figure below summarizes the data from Table 1 of the paper, showing the breakdown of macronutrients during the run-in phase and the subsequent 3 dietary interventions, each lasting 4 weeks.  Again, each subject did each diet for 4 weeks due to the 3-way cross-over design.  In other words, each subject spent a total of 32 weeks in the study (20 weeks of run-in and 3 x 4 weeks of each intervention diet).


How did the diets impact energy expenditure?

The figure below shows the change in REE and TEE measured for all groups.  There was no difference in total physical activity or exercise, so presumably there was no appreciable change in AEE.  I could not find a mention of TEF, suggesting it was not measured.   These figures are a bit ugly, but they convey helpful information.  Each dot represents an individual subject and the lines joining each dot allow you to see the change for each subject across the 3 diets.  The blue box shows the mean change (middle of the box) with the 95% confidence interval above and below.  The height of the box is therefore two standard deviations.


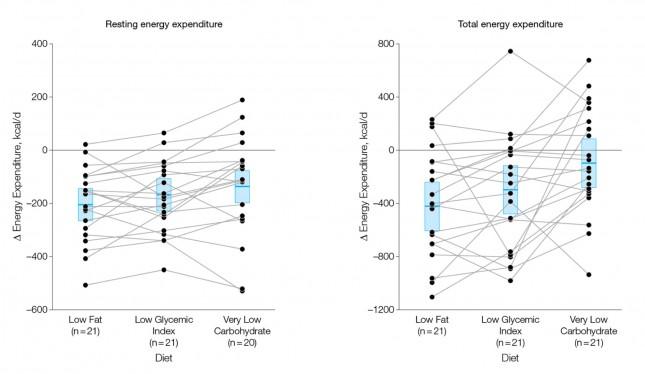
A few things stand out from these results:

  1. The group consuming a very low carbohydrate diet had a higher REE and TEE than the low GI group, which had a higher REE and TEE than the low fat group. In other words, the fewer carbohydrates in the diet, the higher the resting and overall expenditure.  This is actually the sine qua non of the alternative hypothesis: something beyond the actual number of calories is playing a role in how the body expends energy.
  2. As expected, given that each subject was starting from a weight-reduced state, the REE was lower for each group, relative to their baseline.  REE is highly (though clearly not entirely) dependent on body mass.
  3. There is enormous variation between subjects by diet type.  For example, at least one subject saw a dramatic increase in TEE on the low GI diet versus the other two, while another saw the greatest TEE on the low fat diet.  This speaks to a theme I iterate on this blog: be willing to self-experiment until you find what works for you. 

How did the diets impact metabolic parameters?

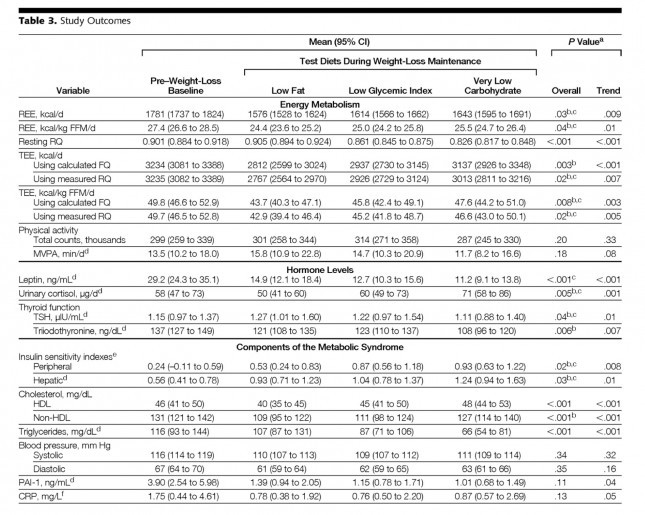
The table below shows the changes in hormone levels and metabolic syndrome biomarkers.

One thing that really jumped out at me was that it is quite likely that not one of the subjects in the study met the formal criteria for metabolic syndrome.  MS requires at least 3 of the 5 parameters (blood pressure, waist girth, fasting glucose, HDL-C, and TG) exceed threshold.  The thresholds are as follows:

  1. BP > 140/90 [No subject met this at baseline]
  2. Waist girth > 40 inches (men), >35 inches [Not reported, but let’s assume at least some subjects met this]
  3. Fasting glucose > 100 mg/dL [Not reported, but let’s assume at least some subjects met this]
  4. Fasting TG > 150 mg/dL [No subject met this at baseline]
  5. HDL-C < 40 mg/dL (men), < 50 mg/dL [No male subject met this, but it’s possible some female subjects did]

This may speak to the age of the subjects, which averaged 30.3 years, but I would have expected a worse set of baseline metabolic parameters. It also speaks to the point that just because someone is obese doesn’t mean they have metabolic syndrome and vice versa.


Tables are a bit cumbersome, so I took the liberty of graphing some of these results, mostly because I just can’t resist playing with think-cell (PowerPoint without think-cell is simply a tool for torturing people.)

I’ve explained p-values before, but let me explain the two types of p-values reported above and below.

P_overall is the p-value testing the hypothesis that the mean outcome of the three diets was equal.  The smaller this value, the more likely the differences were not due to chance.  As a general rule, if the p-value is greater than 0.05 we say the difference is “not significant.”  Most use a more stringent requirement of 0.01 to hit the mark of statistical significance.

P_trend is the p-value testing the hypothesis that the mean outcome of the three diets showed a trend from low fat to low GI to low carbohydrate.


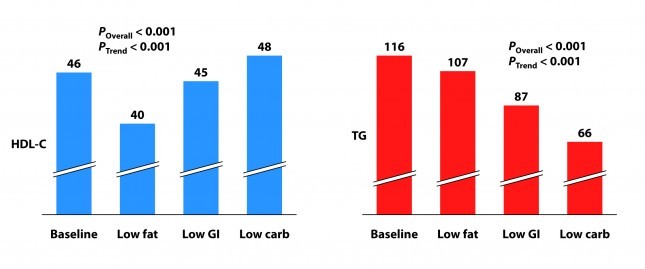
Not surprisingly, the low fat group experienced a significant reduction in HDL-C.  It’s been documented many times that dietary fat raises HDL-C and dietary carbohydrates reduce HDL-C.

Each group also experienced a reduction in triglyceride (TG) level.  Since we know carbohydrates, not fat, raise TG, you may wonder why this was even the case in the low fat group, which actually increased carbohydrate intake.  I suspect it was a carbohydrate “quality” issue.  I’m guessing the baseline levels reflect more sugar consumption than the low fat phase.  Nevertheless, and again not surprisingly, the high fat-low carbohydrate group experienced the greatest improvement in plasma TG levels.


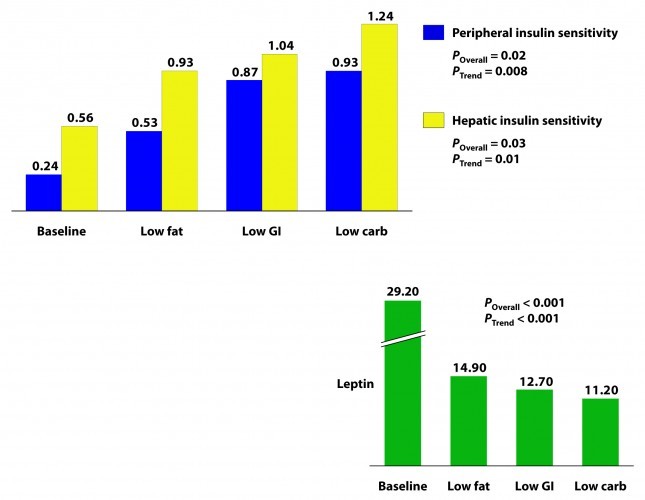
Insulin sensitivity was measured according to a protocol in this paper.  The protocol uses time blood draws after an oral glucose challenge.  The higher the index, the greater is the insulin sensitivity.  Each diet improved both hepatic and peripheral insulin sensitivity and both the overall differences and the trends were significant.

If insulin is the most important hormone regulating fat metabolism and accumulation, leptin is certainly a close cousin.  Leptin is a hormone secreted by fat cells that plays an important role in regulating appetite and some metabolic functions.  High levels of circulating leptin can be suggestive of leptin resistance which, like insulin resistance, tends to be a marker for metabolic derangement.  I’ll write a lot about leptin in subsequent posts.   While leptin sensitivity was not directly measured as insulin sensitivity was, the significant reduction in circulating leptin levels suggested it was also improved in all groups, though greatest in the low carbohydrate group.

How did the diets impact inflammation?

Two markers for inflammation were evaluated in this study, C-reactive protein (CRP) and plasminogen activator inhibitor-1 (PAI-1).  Neither is particularly sensitive in the way, say, Lp-PLA2 is (this was discussed in the cholesterol series). Nevertheless, they give us some indication of how much overall inflammation exists in the body.


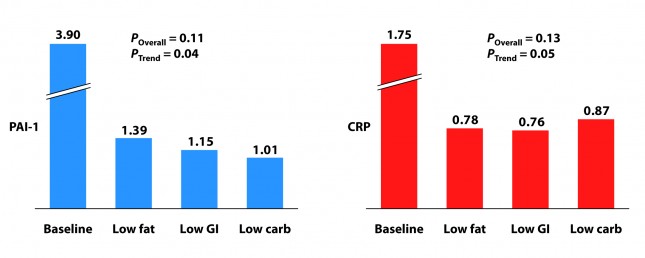
Each group experienced a significant decline in both PAI-1 and CRP, and there was no significant difference between the groups for either marker.  However, the trend was (barely) significant favoring the low carbohydrate group for PAI-1 and favoring the low GI group for CRP.  Sorry low fat, you didn’t win either.

I know what you’re thinking because it was the first thought that ran through my mind when I saw this table:  What?  Is this meaningful or is it an example of statistical chicanery?  I’ll let you decide, but I’m pretty sure I know the answer.

Because I know some of you will ask, I will comment in a subsequent post on the changes seen in TSH, T3, and cortisol.  These topics deserve a post of their own.

What should have been taken away from this study?

This study reproduced a number of results which have been noted for decades:

  1. Low carbohydrate, high fat diets reduce TG and raise HDL-C more than other diets.
  2. Low carbohydrate, high fat diets improve insulin sensitivity more than other diets.

It never hurts to hammer those findings home again, but the really dramatic finding of the study was the impact of macronutrient balance on REE and TEE.   At previous count (circa 2011), 81 studies over the past 80 years involving 4,094 subjects for more than 1.2 million subject-days have attempted to ask this question – many of them attempting to “prove” that all calories are created equally.  While none (i.e., not one) have refuted the alternative hypothesis, most of them had enough methodologic limitations that it was difficult to know for certain if the type of food – rather than the number of calories – was playing an important role.

This study, while still limited (e.g., short duration, small sample size), makes one of the more compelling cases that all calories are not created equally.

What was taken away from this study?

The embargo on this paper was lifted at 4:00 pm EDT on Tuesday, June 26, 2012.  Within about 30 minutes I was being bombarded with news stories that, if you hadn’t read the study, as virtually no one actually does, would suggest that the low carbohydrate diet was the “worst” of the three diets tested.  This was not universally true, in fairness to the media, but there was no shortage of this sort of commentary:

USA Today

…the authors note a downside to the low-carb diet: it appears to raise some risk factors for heart disease.

Marion Nestle, a nutrition professor at New York University, says longer studies conducted among people in their own environments, not with such controlled meals, have shown “little difference in weight loss and maintenance between one kind of diet and another.”

George Bray, an obesity researcher at Pennington Biomedical Research Center in Baton Rouge who has also studied this topic and who wrote the accompanying editorial in JAMA, says that other studies “show that you can do well on any diet as long as you stick to it. Adherence is the major key for weight loss and maintenance. There is no magic in any diet.”

The New York Times

…the low-carb diet “also had marked problems. It raised levels of CRP (c-reactive protein), which is a measure of chronic inflammation, and cortisol, a hormone that mediates stress.”

The Wall Street Journal

…the low-carb diet had the biggest boost in total energy expenditure, burning about 300 calories more per day than those on the low-fat diet — about the same as an hour of moderate exercise. But that bump came at a cost: increases in cortisol, a stress hormone, and a measure of inflammation called CRP, which can raise the risk of developing heart disease and diabetes.

Some of these comments were patently false (e.g., “the low carbohydrate diet raised levels of CRP” according to the New York Times), reflecting utter incompetence, but most of them commit a different journalistic sin: They miss the forest while machinating on one leaf.

Tragically, most people (unfortunately this includes physicians, dietitians, and politicians) have neither the time nor scientific discipline to wade through these studies and understand their implications.  Instead, they rely on “reputable” journalists to translate for them.

Disclaimer: This blog is for general informational purposes only and does not constitute the practice of medicine, nursing or other professional health care services, including the giving of medical advice, and no doctor/patient relationship is formed. The use of information on this blog or materials linked from this blog is at the user's own risk. The content of this blog is not intended to be a substitute for professional medical advice, diagnosis, or treatment. Users should not disregard, or delay in obtaining, medical advice for any medical condition they may have, and should seek the assistance of their health care professionals for any such conditions.

281 Comments

  1. If a R/Q is .70 on a high fat low carbohydrate diet does that imply an increase in the VO2 max by an equivalent ratio? Ken

  2. Hi Peter & fellow eating academics,

    Did you see Bill Harris’ latest lecture on LecturePad on n-6 fatty acids? I just watched it, and now I’m quite puzzled: for a while I’ve heard that n-6 PUFAs are bad, and should be limited. Now I see this research that suggests otherwise. The problem is that most of the cited evidence is either observational or in non-humans, although with some RCTs toward the end. What did you think?

    I noted that when Harris talked about blood lipids it was in terms of total/HDL-C, or LDL-C; it would of course be more interesting to know the relationship between LA and LDL-P!

    • Bill has become my teacher on this topic, and I’ll be doing a series (don’t worry…it’s won’t be nearly as long as the cholesterol series!) on PUFA, where I’ll cover this topic, and others, in great detail.

    • i saw this too, and it is confusing. I have thought that if LDL-P is at goal than the amount of sat fat in the diet is not relevant. Was also under the belief that polys have a greater chance of oxidizing and if they comprise a large % of lipids that via any number of particles enter the artery wall, a greater chance of an inflammatory response may ensue. Will be glad to hear Peter’s take on this when he gets to it before we all start substituting poultry for meat!

  3. Saw this response to the JAMA study in the NY Times: https://www.nytimes.com/2012/07/10/health/nutrition/q-and-a-are-high-protein-low-carb-diets-effective.html?src=recg

    Gina Kolata still towing the “calorie is a calorie” line, finding an obesity expert to tell us low-carb is just hocus-pocus. After reading the article, I wonder if Dr. Hirsch even read the study. The period when the dieters were on weight loss was a standard low-cal, moderate carb and fat diet. So, Hirsch’s comment about losing water weight does nothing to explain why the TEE went up on a very low-carb maintenance diet. They didn’t lose weight, that’s why it’s called maintenance. Given my own experience, I wonder if their body composition changed? Could a higher lean body mass explain some of the increase? I can’t find any body comp numbers from the maintenance phase.

  4. Hi Peter,

    A few questions that I’ll post in different comments (and if my etiquette is off, please redirect).

    First, I like your choice in colors on the pie charts — Green (good) for Fat, and Red (bad) for Carbs. Was this intentional? 🙂

  5. Next, not my idea, but haven’t seen this comment on this post: With a range of 300 kcal/day difference in TEE, one would think that would have an impact on weight at some point. After only 28 days (and 8400 kcal total), I suppose that 2-3 pounds of weight loss wouldn’t really be significant/meaningful — is this your take?

    Instead of a 4-week phase, a 4-month phase (120 days and 36000 kcal) might produce a weight difference of 10 pounds — which might be significant and meaningful, wouldn’t you think?

    • Correct. The delta in TEE over such a short period of time is the reason they did not report on weight changes. Let me point out, they DID see trends in weight changes according to the differences in TEE, but they were not statistically significant over such a short period of time.

    • Also, there is no reason to expect that changes in REE and TEE occurred immediately after the diets changed. One should reasonably expect that any accruals of body mass differences would be attenuated significantly , both up and down, during the periods of metabolic adaptation to each new diet. Combine that issue with routine variations in body mass due to variable water retention, the small sample size, and the short durations of each diet.

      Yet, some comments in other forums criticize the study because differential weight loss results were not reported. Such comments are not reasonable criticism of this particular study.

      • There were differences in weight, but they were not reported because they lacked significance. Had the study been longer than 4 weeks, it’s quite likely it would have shown significance.

  6. In your discussions with Dr. Westman about whether people on ketogenic diets with high LDL-P may not have the same high risk as the rest of the population with high LDL-P, it seems to me that such a ketogenic diet could be called a confounding variable. Regardless of the label, being in a ketogenic “state” seems like only one of many possible “states” where the global model (correlation) may no longer hold. For example, perhaps in a “low sugar, high low-GI” state, the model doesn’t hold, or perhaps in a “high sugar, high fat” state, the model doesn’t hold (perhaps *under*predicting risk).

    I think what makes this particularly interesting (and personal to each individual), is that given a Bayesian prior of a certain state that an individual is in, and given their LDL-P (or other biomarker), how does that person’s risk look once these states are considered.

    I get that studies (observational and clinical?) do make adjustments for gender, age, smoking, etc., but I suspect these are more (linear) regression oriented than they are state oriented (or even quintile- or decile-oriented).

    In a hypothetical (and extreme) study, it would be great to somehow do a mathematical cluster analysis of what millions of people actually ate, clustering them into say several dozen clusters — and then assess risk by cluster. So, if I happen to eat a “fastfood: burger, fries, but only water to drink” cluster, I might have one set of risk; while if I was in an “Eenfelt LCHF” or a “WheatBelly” cluster, there would be different set of risk.

    This last paragraph leaves me wondering, given the Bayesian prior of what I eat (and maybe who I am), how much can general population studies really help me improve my health (unless of course, I’m the poster boy for the population tested)?

    • Yes, I agree. Ketosis is but one state where the model is less applicable. Technically, any state other than the state where the results were generated would call into the question the dogma.

  7. Peter, thanks for the replies. Just got my Health Diagnostic Lab results back 🙂 , and there is a 30 mg/dL between the Non-HDL-C (calculated) result and the LDL-C Direct. On previous posts, you’ve described all the cholesterol carrying particles, but is this difference (typically) mostly attributed to VLDL-C or a combination?

  8. Hi Peter,
    Have you seen this in the NYTimes? Much worse than anything Bittman might have written. Of course someone who has been researching obesity for nearly sixty years might not want to admit the errors of past ways. I had to fire off an e-mail to the author, Gina Kolata. Maybe Gary Taubes could speak with his sometimes colleagues at the Times and give them a tutorial.

    https://www.nytimes.com/2012/07/10/health/nutrition/q-and-a-are-high-protein-low-carb-diets-effective.html

    Martin

    • Yes, pretty strange (and shockingly incorrect). Gary and I, for unrelated reasons, were speaking with David Ludwig today. I suspect he’ll be writing a letter to the NYT to, at the VERY least, correct the huge errors in this response to Gary’s op-ed.

  9. Yes, Gina’s at it again over at the Times. A friend sent me a link. I almost didn’t open because I feared it was her saying something stupid again, but I did and it was. Surprise that they’ve turned off comments. I sent her this email:

    “You’re kidding, right? You accepted the notion that there was magic in that study because people on low carb lose water weight? First of all, any water weight loss would have happened months ago in the initial stages of weight loss, PRIOR to being randominzed into the treatment arms. Secondly, it was a weight maintenance study!!!!! Nobody lost any weight once they were randomized into the treatment arms. The purpose of the study was to see if different diets protect better against weight regain during maintenance. Did you even read the study for heaven’s sake?

    Non-scientific people who are trying to be well and lose weight send me your blogs all the time for comment, and without exception I just roll my eyes and have to spend time correcting the misinformation you put out there.”

  10. Martin, I also saw that response by Dr. Jules Hirsch. After doing some research, it seems that Gina Kolata (and Dr. Hirsch) is one of the entrenched “calorie-is-a-calorie” establishment. They have a long-running feud with Gary Taubes dating back to her amateurish review of his book Good Calories, Bad Calories back in 2007.

    the following blog post by Dr. Michael Eades explains the rift, and explains the ridiculous “study” that they keep referring to:

    https://www.proteinpower.com/drmike/low-carb-library/gary-taubes-strikes-back/

    I agree with Dr. Attia here, Dr. Hirsch’s way of denying the results of the recent study (because it doesn’t match his decades-long crusade) is shockingly wrong. Peter has more knowledge of this in his pinky finger than I do in general, but even I read it and was like “that makes absolutely no rational or biological sense whatsoever”. it was a sad attempt by Dr. Hirsch as he doubles down on the wrong side of his cognitive dissonance.

    the worst part is that it’s getting so many reads in the NYT… again muddying people’s minds with false and discordant information.

  11. Correction to my previous post and email to NYTimes:

    Ms. Kolata,

    Earlier today I wrote you regarding my frustration with your representation of the above referenced study. I see, though, that I erred in believing that I was being sent a blog post by your colleagues who do “Well”. I apologize for that error, but the level of badness of this piece by you sounded just like the Well blog. I should have been tipped off to my error by your inclusion of Hirsch, who IIRC, is often your go-to guy on your dietary pieces, but I missed it. I would think that Hirsch would be particularly interested in the findings of Ludwig, as the increase in energy expenditure found in the LC group – some to a greater level than previous to weight loss, would address one of Hirsch’s foundational problems with dieting; that is, the difficulty in sustaining weight loss due to reductions in energy expenditure imparted by that weight loss. That the two of you discussed this study as though the findings related to the weight loss itself has left me and others in the field dumbfounded.

    • No, Peter, there are no comments turned on for this piece (wonder why). The only way is via email to the writer. Dr. Ludwig’s response will probably be handled as a letter to the editor.

  12. Peter,
    A paper that nicely documents a very interesting dietary hypothesis has recently appeared on Dovepress from Ian Spreadbury of Queens University, Canada. It posits that inflammatory microbiota of the small intestine are promoted by the dense acellular carbohydrates (e.g. sugar and grains) in western diets, and that this may be the primary cause of leptin resistance:

    https://t.co/yLYIhGV4

    • It’s interesting and I don’t doubt that gut flora changes with carb consumption thus inducing some problems — ulcers, for instance, peridontal disease, etc. — but the question is whether this is the *mechanism* that’s driving obesity (i.e., fat accumulation). It’s an extra layer of complications over the endocrinology and metabolism. I realize it’s currently very interesting to hypothesize inflammation as the cause of insulin resistance, but it is still difficult to find much experimental work linking inflammation to insulin resistance causally. The two are certainly associated. The other point to keep in mind, the author seems to be trying to get dietary fat involved based on rodent experiments, but I don’t think what happens in rodents is particularly relevant to humans. Pick a different animal model of disease — pigs, for instance, or cattle — and you get a different environmental trigger of the obesity/diabetes phenotype.

      So certainly inflammation is involved, and I have little doubt that our diets make it worse, but I still think this is an additive problem and not the primary driver. Of course, what I think vs. what someone else thinks is irrelevant. Until we start doing the right kind of clinical trials in humans, we might as well be discussing religion or politics.

    • Thank you for the thoughtful reply.

      An important condition to add to your list of ulcers and periodontal disease – before any “etc.” – is the LC diet’s impact on GERD. Before transitioning an diet to LC four months ago, for the previous decade I had not been able to make it – at an extreme max – beyond 48 hours without a dose of Prilosec. About a month ago, I was able to easily end this PPI dosing cold turkey, using only a few doses of sodium bicarbonate during a 10 day transition period. Since then I have had zero GERD symptoms and my rate of weight loss now seems to be even faster.

      Is my now functioning stomach acid system engaging with my gastric biosome, thereby reducing related inflammation, thereby reducing leptin resistance, and thereby further reducing my appetite? Heck if I know. All I do know is that my appetite seems to be significantly further reduced.

      • I don’t know either, but I know some scientists who have the tools to study this rigorously, and I hope to get them involved in NuSI studies.

  13. Peter, while statins are used to lower cholesterol, we as have learned that LDL-P is more important than cholesterol, so where does this leave statins? Do statins have an impact on LDL-P? Or maybe more importantly, is the best mechanism for lowering high LDL-P the use of statins? Does the HMG-CoA reductase process that produces cholesterol also produce LDL particles? If so, that would be pretty convenient.

  14. Hey man I enjoy your blog.
    about 5 months ago i made a effort to get into better shape. I am 6’1 tall and weighed close to 230lbs. I joined a gym and and cut all sugar (the best I could) out of my diet. I then started lowering my carb intake .In about three months I dropped to 195lbs while continuing to increase my strenght. a Right now I eat only good carbs and consume allot of protein. My goals are to get stronger in the power and olympic lifts. I do HIT training about three times a week and weight training about 4 times a week. Im thinking trying out a ketosis state. I am wondering would ketosis (and the limiting of protein) be smart for my current goals of increasing strength? Or should I keep up a moderate carb count and higher protein count?

    • Joe, “discussing” is putting it mildly. This is called journalistic sloppiness at its finest. Virtually all of it is incorrect, and Ms. Kolata didn’t even fact check it with Dr. Ludwig. Keep an eye open for his response.

  15. Dr. Attia, was referred to your site last night and am now hooked! I was wondering if you were aware of any diminishing-returns effects of low-carbohydrate diets? Weight-loss seems to be quite drastic in those with a waistline of, say, 36-inches, but do you think someone carrying 8lbs of ‘extra’ fat will have difficulty losing it on a diet alone? I know Gary Taubes talks about losing weight without exercising but he doesn’t address this particular issue.

    • Very tough to say without knowing a lot more, Gustavo. Sure, you’ll typically see a greater response in those with more fat to lose, but this is not a universal truth.

  16. Let’s talk about the statistics for a minute. You mentioned chicanery regarding the CRP and PAI-1 in your post, and you are correct. They’ve done 3 stat tests here: the overall difference test (a necessary, but limited, test – tells you that there are differences across groups, but does not tell you which groups are different from which); if the overall difference test is significant, they did post-hoc pair-wise tests of every possible pair-wise comparison (3 in total: lc v. lg, lc v. lf, lg v. lf), using a Bonferroni adjustment, which is fine; then this trend test. It is not clear how they constructed that trend test, and they do not provide enough info in the paper to judge the validity of the test (this may be obfuscation, or perhaps just lack of attention to detail).

    As might be expected, the devil is in the details, more specifically, the footnotes in Table 3. They report the p-value for the overall difference test, and then the pair-wise test results are reported in footnotes b and c. You’ll see that for several outcomes, the low glycemic diet does not differ from either of the other 2, but presumably the low carb and low fat diets do differ. You can verify this by comparing means for a particular diet to the CIs for the other two diets – generally, if the mean for one is *inside* the CI for another, then they are NOT different from each other (statistically; though sometimes, if the numbers are close, you’ll get p-values of 0.03 or 0.04 or so). This is your basic, ANCOVA-type approach for analyzing experimental data – you compare the groups of interest to see if they differ. The trend test seems inappropriate here, even though we don’t really know how it was constructed. Sounds like they tried to force what may have been up to 6 different sequences of diet progression into an artificial, single sequence trend, which doesn’t seem appropriate.

    Now lets look at the tests that matter with respect to PAI-1 and CRP: PAI-1 improved in each diet when compared to baseline; however, the groups simply do not differ from each other, despite the borderline significant ‘trend’ effect (which is essentially meaningless without some more information about how it was constructed). You’ll note that the means for each diet all overlap with the CIs for the other 2 diets, and the overall effect is not even significant. Furthermore, CRP did not change relative to baseline (all the diet means are inside the baseline CI), for any of the diets; AND, more importantly, CRP does not differ across the groups, even in terms of the far less stringent overall difference test (p = 0.13). For the authors to call out this effect in the Comment section discussing CRP is kind of silly; for the press to obsess on it is simply ludicrous.

    I look forward to your post on cortisol though, because that one did indeed appear to look the worst for low carb.
    -Chris

    • Hi Chris,

      Good points, but actually we *can* know exactly how they constructed the trend test and precisely what it is testing (see my comment on this from July 5). The authors state in the paper that they “constructed a test for linear trend across diets, proceeding from highest to lowest glycemic load … assuming equal spacing.” The last part of this is hidden in the footnote for Table 2. This test is conducted using a contrast in a linear model, where a contrast is simply a linear combination of the model parameters (in this case, the model-estimated means for each diet) such that the contrast coefficients sum to zero. In this case, the appropriate contrast coefficients for testing linear trend with equal spacing are -1, 0, 1, or any multiple thereof (e.g., using -0.5, 0, 0.5 would lead to exactly the same test statistic). That is, the contrast for linear trend takes -1 times the mean for the LF diet, 0 times the mean for the LGI diet, and 1 times the mean for the LC diet… this is just a pairwise comparison between the LF and LC diets! But the authors said that they wouldn’t do such pairwise comparisons unless the overall null hypothesis could be rejected, which was not the case for CRP. AND, they said that when they would do pairwise comparisons, they’d use a Bonferroni correction… they didn’t for CRP. As such, their data provide NO EVIDENCE for a difference between diets with respect to mean CRP. None. They should never have even discussed this, per their own pre-specified analysis plan.

  17. I have to admit that this idea of the microflora in the gut and their effect on obesity is one I have been wondering about a great deal. I really think this concept makes an important leap to explain several unanswered questions in the obesity debate.

    With DNA analysis we are now becoming aware of the role of the literally trillions of bacterial cells that inhabit our body most of which were previously unknown because they cannot be cultured in the lab.

    https://www.nytimes.com/2012/06/14/health/human-microbiome-project-decodes-our-100-trillion-good-bacteria.html?hpw

    One important question is that we always speak of peoples genetic differences in their propensity to obesity, but humans of different races, for instance, have a genetic make up that is more than 99% identical. What about the genetic make up of the human biome? Here we can perhaps have important species completely wiped out by an improper diet. While human genetics may vary only slightly the human biome could vary greatly between individuals. Further, as the above reference article points out, the beginnings of the human biome are passed from mother to sterile child at birth, creating a kind of quasi-heredity.

    And as in the bacteria that cause dental caries, the article referenced by g2sb above (thank you!) points out another very interesting idea. The insulin/obesity connection does not consider that in the paleo diet, or the diet without processed foods, all sugars, fats, carbohydarates or proteins are found within cells and not as pure compounds. This goes beyond such notions as the glycemic index as the abstract points out. The thesis questions whether the flora in the gut can be considered “the forgotten organ” and an organ that is susceptible to being radically changed by our diet, especially pure sugars encountered outside of cells, for instance. This I think goes beyond just the notion of inflammation.

    Peter, thank you so much for tolerating and even reading my posts. I am aware that they sometimes verge on rants, and I certainly do not want you to feel I am trying to hijack this very important forum.

  18. Peter, the mention of gastric ulcers above in the thread reminded me of the story of Barry Marshall and of what you are up against in your battle to overturn years of bad science. I guess your extreme regimen of diet and exercise might be considered by some as analogous to drinking a Petri dish containing cultured H. pylori.

    • Yes, this example is one of my favorites — and resulted not only in a Nobel Prize, but a fundamental way a disease was treated. Unfortunately, this was (and is) a much easier problem to treat, as it’s simply treated by a single pill.

  19. In the same topic as this I would value your investigation on the latest Prospective Cohort Study: Low Carbohydrate-High Protein Diet and Incidence of Cardiovascular Diseases in Swedish Women. I seems they have neglected to factor in for a Low Carbohydrate-Moderate Protein-High Fat Diet?

Facebook icon Twitter icon Instagram icon Pinterest icon Google+ icon YouTube icon LinkedIn icon Contact icon