In 2012, the Journal of the American Medical Association (JAMA) published a study entitled Effects of Dietary Composition on Energy Expenditure During Weight-Loss Maintenance. While I’m guessing most readers have not read this study, I’m pretty sure most of you have heard about the results as it was all over the news this week.

I was fortunate enough to read an embargoed copy two weeks prior to publication with the caveat that I could not speak about it until it was released publicly. Furthermore, I’m friends with one of the reviewers who told me months prior that “a very interesting paper was going to hit a highimpact factor journal very soon.”  Completing my disclosure, I had become acquainted with the senior investigator on this study, Dr. David Ludwig at Harvard.

This study sought to test an important question:

When an overweight or obese person loses weight, how does their choice of macronutrients impact their tendency to regain lost weight?

This is important, of course, because as most of us know that while losing weight is difficult, keeping it off is even more difficult.  In fact, as the authors point out, only about 15% of people who lose 10% of their bodyweight can maintain the weight loss for up to one year.  The obvious question is why?

You’ll recall from this post, that we must always obey the First Law of Thermodynamics.  In other words, we accumulate stored energy (e.g., fat mass) when we are in a positive energy balance and we lose stored energy when we are in a negative energy balance.

Energy balance is a function of two variables:

  1. Energy input – what we eat
  2. Energy output – what we expend

Furthermore, energy output can be broken down into four sub-components:

  1. Resting energy expenditure (REE) – the amount of energy expended to stay alive at rest (e.g., energy required for basic cellular function like ion transport and respiration)
  2. Thermic effect of food (TEF) – the amount of energy required to process and digest food (I also include in this category the amount of energy lost as undigested material in stool)
  3. Activity energy expenditure (AEE) – the amount of energy expended by exercise and non-exercise movement (I consider these as two forms of expenditure)

The sum of REE, TEF, and AEE is called, appropriately, total energy expenditure (TEE).

Of these, REE is the dominant “sink” of energy output in most people, and it is generally proportional to bodyweight.  I’ll cover the importance of this momentarily.

The traditional model of obesity, the so called “calories-in-calories-out” model, says that obesity is caused by the energy input terms exceeding the energy output terms.  In the words of one prominent obesity researcher, “While it is mathematically true that someone who has gained weight has consumed more energy than they have expended, using the First Law to explain why someone gains weight is of little help.  The First Law is descriptive but not explanative.”

I couldn’t have said that better myself.  The mistake most folks make when using the First Law to explain weight gain (versus using the First Law to describe weight gain) is that they lose sight of the fact that these variables – input, REE, TEF, AEE – are linked.  They are dependent on each other.  They don’t exist in isolation.

Proponents of the Alternative Hypothesis argue that intake (i.e., food) plays a role on hormones and enzymes in the body that have a resulting impact on energy output, and even subsequent input.  For example, eating one food over another can increase or decrease appetite, increase or decrease REE, increase or decrease AEE, and even impact TEF.  While the effect on each of these may be modest in isolation, even small changes over the course of days can result in significant changes over months or years.

What does all of this have to do with this study?

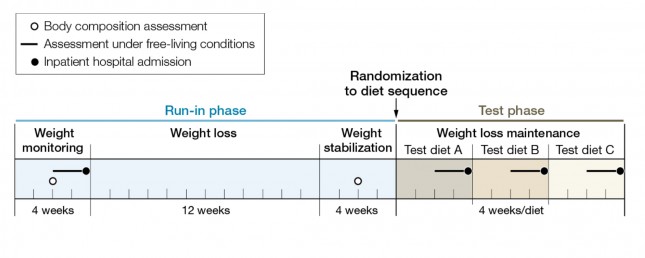
The figure below shows how the study was conducted.  This was a prospective design 3-way crossover study of 21 overweight or obese subjects with an average BMI of 34.4.  Each subject underwent a 20-week run-in phase, which is very common in weight-reduced studies.  During the run-in phase all baseline measurements are collected, including body composition by DEXA, TEE by doubly-labeled water, substrate utilization by respiratory quotient, and plasma levels of various blood markers (e.g., lipids, blood chemistry, hormone levels).  No, unfortunately, lipoprotein particles were not counted.

During the 12 week weight loss phase caloric intake was reduced until each subject lost 12.5% of their starting (stable) weight.  For the final 4 weeks of the run-in phase energy intake was again calibrated to hold their now-reduced-weight stable.
 

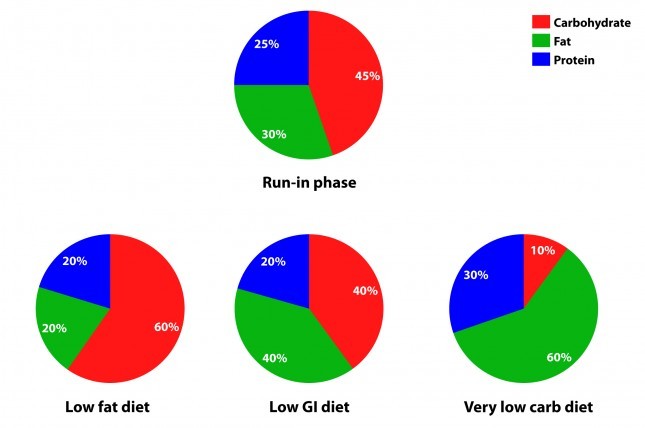
The figure below summarizes the data from Table 1 of the paper, showing the breakdown of macronutrients during the run-in phase and the subsequent 3 dietary interventions, each lasting 4 weeks.  Again, each subject did each diet for 4 weeks due to the 3-way cross-over design.  In other words, each subject spent a total of 32 weeks in the study (20 weeks of run-in and 3 x 4 weeks of each intervention diet).
 

How did the diets impact energy expenditure?

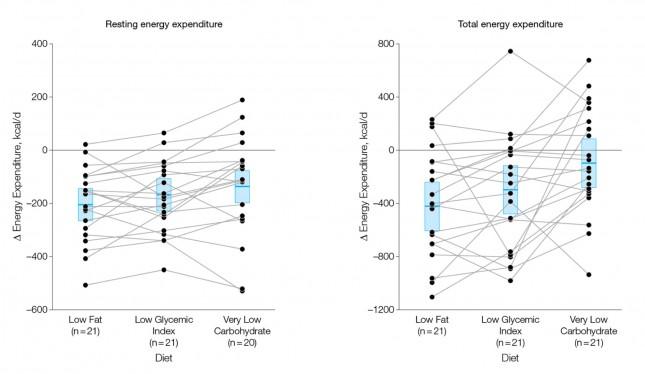
The figure below shows the change in REE and TEE measured for all groups.  There was no difference in total physical activity or exercise, so presumably there was no appreciable change in AEE.  I could not find a mention of TEF, suggesting it was not measured.   These figures are a bit ugly, but they convey helpful information.  Each dot represents an individual subject and the lines joining each dot allow you to see the change for each subject across the 3 diets.  The blue box shows the mean change (middle of the box) with the 95% confidence interval above and below.  The height of the box is therefore two standard deviations.


A few things stand out from these results:

  1. The group consuming a very low carbohydrate diet had a higher REE and TEE than the low GI group, which had a higher REE and TEE than the low fat group. In other words, the fewer carbohydrates in the diet, the higher the resting and overall expenditure.  This is actually the sine qua non of the alternative hypothesis: something beyond the actual number of calories is playing a role in how the body expends energy.
  2. As expected, given that each subject was starting from a weight-reduced state, the REE was lower for each group, relative to their baseline.  REE is highly (though clearly not entirely) dependent on body mass.
  3. There is enormous variation between subjects by diet type.  For example, at least one subject saw a dramatic increase in TEE on the low GI diet versus the other two, while another saw the greatest TEE on the low fat diet.  This speaks to a theme I iterate on this blog: be willing to self-experiment until you find what works for you. 

How did the diets impact metabolic parameters?

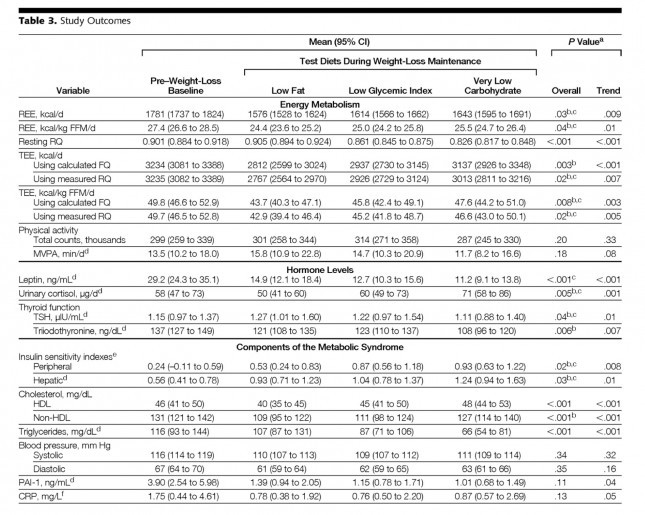
The table below shows the changes in hormone levels and metabolic syndrome biomarkers.

One thing that really jumped out at me was that it is quite likely that not one of the subjects in the study met the formal criteria for metabolic syndrome.  MS requires at least 3 of the 5 parameters (blood pressure, waist girth, fasting glucose, HDL-C, and TG) exceed threshold.  The thresholds are as follows:

  1. BP > 140/90 [No subject met this at baseline]
  2. Waist girth > 40 inches (men), >35 inches [Not reported, but let’s assume at least some subjects met this]
  3. Fasting glucose > 100 mg/dL [Not reported, but let’s assume at least some subjects met this]
  4. Fasting TG > 150 mg/dL [No subject met this at baseline]
  5. HDL-C < 40 mg/dL (men), < 50 mg/dL [No male subject met this, but it’s possible some female subjects did]

This may speak to the age of the subjects, which averaged 30.3 years, but I would have expected a worse set of baseline metabolic parameters. It also speaks to the point that just because someone is obese doesn’t mean they have metabolic syndrome and vice versa.
 

Tables are a bit cumbersome, so I took the liberty of graphing some of these results, mostly because I just can’t resist playing with think-cell (PowerPoint without think-cell is simply a tool for torturing people.)

I’ve explained p-values before, but let me explain the two types of p-values reported above and below.

P_overall is the p-value testing the hypothesis that the mean outcome of the three diets was equal.  The smaller this value, the more likely the differences were not due to chance.  As a general rule, if the p-value is greater than 0.05 we say the difference is “not significant.”  Most use a more stringent requirement of 0.01 to hit the mark of statistical significance.

P_trend is the p-value testing the hypothesis that the mean outcome of the three diets showed a trend from low fat to low GI to low carbohydrate.
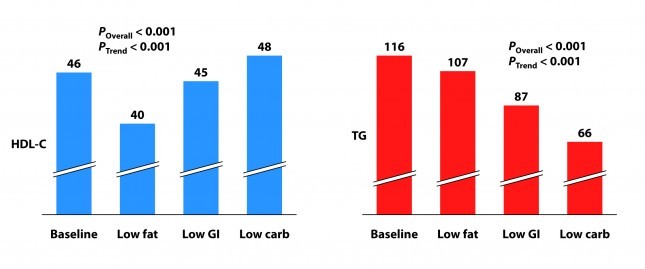
 

Not surprisingly, the low fat group experienced a significant reduction in HDL-C.  It’s been documented many times that dietary fat raises HDL-C and dietary carbohydrates reduce HDL-C.

Each group also experienced a reduction in triglyceride (TG) level.  Since we know carbohydrates, not fat, raise TG, you may wonder why this was even the case in the low fat group, which actually increased carbohydrate intake.  I suspect it was a carbohydrate “quality” issue.  I’m guessing the baseline levels reflect more sugar consumption than the low fat phase.  Nevertheless, and again not surprisingly, the high fat-low carbohydrate group experienced the greatest improvement in plasma TG levels.
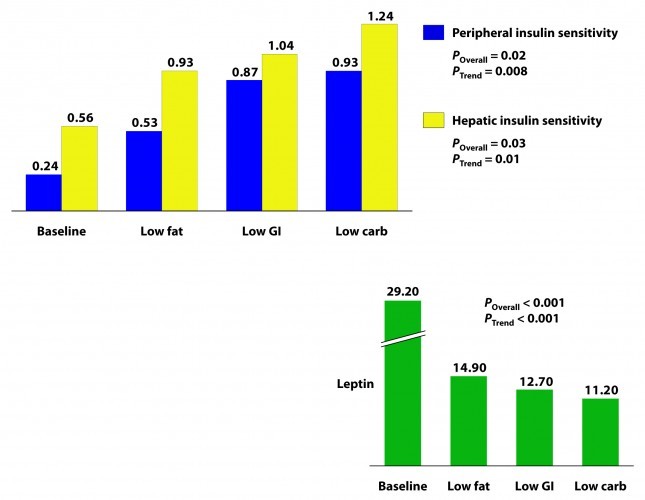


Insulin sensitivity was measured according to a protocol in this paper.  The protocol uses time blood draws after an oral glucose challenge.  The higher the index, the greater is the insulin sensitivity.  Each diet improved both hepatic and peripheral insulin sensitivity and both the overall differences and the trends were significant.

If insulin is the most important hormone regulating fat metabolism and accumulation, leptin is certainly a close cousin.  Leptin is a hormone secreted by fat cells that plays an important role in regulating appetite and some metabolic functions.  High levels of circulating leptin can be suggestive of leptin resistance which, like insulin resistance, tends to be a marker for metabolic derangement.  I’ll write a lot about leptin in subsequent posts.   While leptin sensitivity was not directly measured as insulin sensitivity was, the significant reduction in circulating leptin levels suggested it was also improved in all groups, though greatest in the low carbohydrate group.

How did the diets impact inflammation?

Two markers for inflammation were evaluated in this study, C-reactive protein (CRP) and plasminogen activator inhibitor-1 (PAI-1).  Neither is particularly sensitive in the way, say, Lp-PLA2 is (this was discussed in the cholesterol series). Nevertheless, they give us some indication of how much overall inflammation exists in the body.
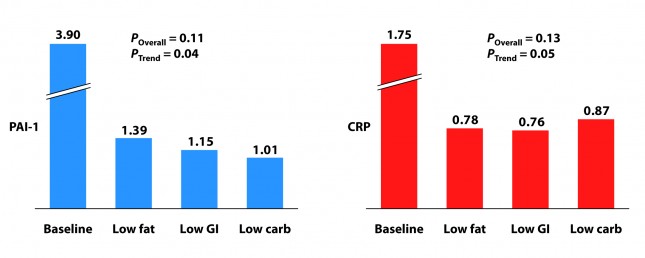
 

Each group experienced a significant decline in both PAI-1 and CRP, and there was no significant difference between the groups for either marker.  However, the trend was (barely) significant favoring the low carbohydrate group for PAI-1 and favoring the low GI group for CRP.  Sorry low fat, you didn’t win either.

I know what you’re thinking because it was the first thought that ran through my mind when I saw this table:  What?  Is this meaningful or is it an example of statistical chicanery?  I’ll let you decide, but I’m pretty sure I know the answer.

Because I know some of you will ask, I will comment in a subsequent post on the changes seen in TSH, T3, and cortisol.  These topics deserve a post of their own.

What should have been taken away from this study?

This study reproduced a number of results which have been noted for decades:

  1. Low carbohydrate, high fat diets reduce TG and raise HDL-C more than other diets.
  2. Low carbohydrate, high fat diets improve insulin sensitivity more than other diets.

It never hurts to hammer those findings home again, but the really dramatic finding of the study was the impact of macronutrient balance on REE and TEE.   At previous count (circa 2011), 81 studies over the past 80 years involving 4,094 subjects for more than 1.2 million subject-days have attempted to ask this question – many of them attempting to “prove” that all calories are created equally.  While none (i.e., not one) have refuted the alternative hypothesis, most of them had enough methodologic limitations that it was difficult to know for certain if the type of food – rather than the number of calories – was playing an important role.

This study, while still limited (e.g., short duration, small sample size), makes one of the more compelling cases that all calories are not created equally.

What was taken away from this study?

The embargo on this paper was lifted at 4:00 pm EDT on Tuesday, June 26, 2012.  Within about 30 minutes I was being bombarded with news stories that, if you hadn’t read the study, as virtually no one actually does, would suggest that the low carbohydrate diet was the “worst” of the three diets tested.  This was not universally true, in fairness to the media, but there was no shortage of this sort of commentary:

USA Today

…the authors note a downside to the low-carb diet: it appears to raise some risk factors for heart disease.

Marion Nestle, a nutrition professor at New York University, says longer studies conducted among people in their own environments, not with such controlled meals, have shown “little difference in weight loss and maintenance between one kind of diet and another.”

George Bray, an obesity researcher at Pennington Biomedical Research Center in Baton Rouge who has also studied this topic and who wrote the accompanying editorial in JAMA, says that other studies “show that you can do well on any diet as long as you stick to it. Adherence is the major key for weight loss and maintenance. There is no magic in any diet.”

The New York Times

…the low-carb diet “also had marked problems. It raised levels of CRP (c-reactive protein), which is a measure of chronic inflammation, and cortisol, a hormone that mediates stress.”

The Wall Street Journal

…the low-carb diet had the biggest boost in total energy expenditure, burning about 300 calories more per day than those on the low-fat diet — about the same as an hour of moderate exercise. But that bump came at a cost: increases in cortisol, a stress hormone, and a measure of inflammation called CRP, which can raise the risk of developing heart disease and diabetes.

Some of these comments were patently false (e.g., “the low carbohydrate diet raised levels of CRP” according to the New York Times), reflecting utter incompetence, but most of them commit a different journalistic sin: They miss the forest while machinating on one leaf.

Tragically, most people (unfortunately this includes physicians, dietitians, and politicians) have neither the time nor scientific discipline to wade through these studies and understand their implications.  Instead, they rely on “reputable” journalists to translate for them.

Become a premium member

MEMBERSHIP INCLUDES

  • Exclusive Ask Me Anything episodes
  • Best in class podcast Show Notes
  • Premium Articles on longevity
  • Full access to The Qualys podcast
  • Quarterly Podcast Summary episodes

Related Content

Free Article

Oldies-But-Goodies, December 2024 Edition

AMA

Red light therapy: promising applications, mixed evidence, and impact on health and aging

Ep. #326 (AMA #65)

QPS

Peter’s key takeaways on bone health, calorie restriction, gene editing and more

Ep. #325

Disclaimer: This blog is for general informational purposes only and does not constitute the practice of medicine, nursing or other professional health care services, including the giving of medical advice, and no doctor/patient relationship is formed. The use of information on this blog or materials linked from this blog is at the user’s own risk. The content of this blog is not intended to be a substitute for professional medical advice, diagnosis, or treatment. Users should not disregard, or delay in obtaining, medical advice for any medical condition they may have, and should seek the assistance of their health care professionals for any such conditions.

281 Comments

  1. Esther says:

    Thank you so much for this!
    I had heard about this one through a source that stressed the inflammation and declared the low GI diet the winner.
    It is good to have an overview that gives the actual findings in a readable format.

    1. Peter Attia says:

      Make sure you share it with your source, please.

  2. RokShox says:

    “Energy balance is a function of two variables:
    1.Energy input – what we eat
    2.Energy output – what we expend”

    3. What we store as fat.

    What is so hard to understand about the energy partitioning argument? It’s infuriating. If your body is fat-building, it will rob calories to make fat at the expense of available energy. How many times does this have to be explained to you?

    1. Peter Attia says:

      Sorry to be infuriating to you, but I think I should be infuriated by *you*. If you’d actually look at the post I wrote on this, you’d note that E_s (the change in stored energy – i.e., fat mass) = E_in – E_out. All you’ve done (I think) is rearrange the equation to state 0 = E_s – E_in + E_out.
      Congratulations on using first grade algebra to rearrange a simple equation. Excellent value add. And I like that you were able to do this while being repeatedly and consistently rude. Do you think being insulting impresses me?

    2. greensleeves says:

      “3. What we store as fat.”

      What is interesting is that when a certain very prominent nutritionist from New York was here in SF recently talking about her new book on why calories count, she explicitly denied any role for uncoupling, partitioning, or insulin. As best as I could make out her opinion, it appeared she would deny that chemical reactions in breaking down protein or building fat lose energy for the body. No energy can be lost or gained, she seemed to say, so any claims that uncoupling “loses” energy available to the body is false and bad biochemistry. Everything you eat is burned or stored as fat. Nothing is diverted into heat or other chemical reactions. I was a little astonished at this, since I was not aware the body was somehow exempt from what I was taught are the basic rules of chemical reactions. But this is apparently the mainstream belief and to argue otherwise will only get you dismissed as someone ignorant of chemistry and basic physics. 🙁

    3. RokShox says:

      My apologies for my crass comment. I was in the middle of conducting an experiment on ethanol metabolism.

  3. Renaud says:

    Nice post, thanks.

    A lot of things would be way clearer if only we had things measured just after weight stabilisation phase.

    Maybe 1 month is not enough time to be fully keto-adapted, and adaptation could have be faster/slower depending on the preceding diet in the crossover (lots of questions arise from possible crossover effect too). This is equaly true for low-fat adaptation, and probably less for low GI (wich is very close to junk standard in mixing ratios of carb/fat). Anyway, 1 month is respectable and way better than 1 week !

    The study is good at providing interesting clues, and very good at raising questions.

    1. Peter Attia says:

      All great points, Renaud.

  4. Scott Russell says:

    Any thoughts on the (slightly) elevated cortisol levels? While this makes sense physiologically, I wonder if you have any thoughts on the long term implications, if any.

    1. Peter Attia says:

      Another post…

    2. Aaron H. says:

      They aren’t “elevated levels of cortisol.” They are reductions in cortisol that are just negligibly less than the reduction on the other diets. And with a p factor of just 0.05 it puts them right on the border of statistical significance.

    3. Vasco Névoa says:

      My CRP and Cortisol went noticeably DOWN with LCHF… I’m very curious as to why the contrary was observed in the study.

      1. Peter Attia says:

        CRP did go down in them, also. As far as cortisol, I’ll get into this later, but there are probably some issues with the timing of this.

  5. Gretchen says:

    Two things that haven’t been discussed:

    1. The baseline was before the weight loss. So all results reflect both the effect of weight loss and the diets used for that weight loss as well as the different diets used during maintenance. It’s too bad they didn’t have baselines before each of the three test diets, but the study was complex enough and they might have figured they couldn’t afford that.

    2. LC diet resulted in burning an excess 300 calories a day, but there were no significant differences in weight. The 300 cal per day for 4 weeks would be 8400 cal during those 4 weeks, or, using the figure of 3500 cal per pound, 2.4 pounds. Now, daily weight often fluctuates by more than this amount because of fluid changes, so it would be difficult to detect in this short-term study. But is it also possible that the people on the LC diet, which carb-craving subjects might consider too restrictive, ate a few crackers or whatever and didn’t report it, despite the extensive efforts by the researchers to control intake. (This wasn’t a food-questionnaire study; all food was provided and researchers tried to make sure it was all eaten.)

    The detailed Methods are available as supplementary material for anyone wanting to delve into them.

    1. Peter Attia says:

      Gretchen, I still can’t access the eMethods section on-line, just the “regular” Methods section, which isn’t giving me enough information. Your first point makes a lot of sense. The run-in phase, while still high in carbs almost certainly “cleaned up” the diets (e.g., no sugar). To your second point, duration really hurts us here. There is so much water movement in the first few weeks that’s it’s quite difficult, even with DEXA, to fully elucidate the changes in body composition. Kevin Hall has probably got more experience with this than most.

      Bottom line, a study like this needs be repeated with more subjects for a longer period of time. It’s going to happen.

    2. Gretchen says:

      Peter, Is there a supplement other than “Data Supplement,” a PDF? I had no trouble downloading that.

      1. Peter Attia says:

        Ahhh, the supplement link is working. I was trying to get it through the eMethods hyperlink, which was (and is) not…

  6. Kurt says:

    Excellent analysis. The graphs are a great way of showing the nature of the results in a meaningful way for non-experts.

    I actually read the paper and found that as usual the mainstream media focused on incorrect interpretation of the rather insignificant minutiae of the CRP and cortisol levels rather than the main result. Part of the blame for in my view, is that the researchers used the minor differences in the inflammatory markers to form an opinion the the low GI diet was preferable to low carb high fat diet. Although I am not an expert, it appears that all markers are well within accepted normal ranges, and in particular, the post diet CRP figures were in the very low range for all protocols. The short duration of the study may also be a significant factor and a longer study may find different results over time.

    I was also pleased that you pointed out that there were variances in the REE and TEE response among he test subjects and you have correctly interpreted this as “individual results may vary”. However your graphical treatment of the means and SDs clearly shows the overall conclusion of the paper. Another well known “calorie is a calorie” blogger tried to cherry pick the individual results as proof that the overall result was not true.

    It will be interesting to see if in the not to distant future someone can put together a larger and longer study with the same level of quality and replicate the results.

    1. Peter Attia says:

      …Enter NuSI…

  7. Keith says:

    Thanks Peter. Really appreciate your work. Just a statistical quibble… The blue box actually shows the mean and the 95% confidence level for the mean rather than the standard deviation of the data which is much greater. One extreme interpretation therefore is the possibility of no effect for these parameters as I can draw a horizontal line through each of the blue boxes! That’s statistics for you! Also not sure whether the change in energy output was reflected in weight change or is that obvious?

    1. Peter Attia says:

      Good catch, Keith! Thank you. Noted and corrected. Yes, this needs to be bigger.

  8. lorraine says:

    As one who has read the study and has also been answering questions all week about it, thank you for an excellent discussion of the paper in this post. Your histograms greatly enhance some of the data (but don’t tell Dr. Ludwig I said so).

    I shouldn’t have been, but was, blown away by the media – and expert – interpretations of the CRP outcomes. For heaven’s sake is all I could say. They just cannot give it up on the notion that anything with fat in it is going to kill you with the big one, but quote a CRP outcome in another context, and all you’ll hear is how meaningless and non specific it is (my clients still fight with their doctors to order one). But here, LC increases your risk for heart disease because of clinically nonsignificant changes in CRP.

    I figured the MS biomarkers were a function of age. I think the oldest Subject was 40, and their exclusion criterion eliminated anybody who would have been on meds; ie, with disease. Speaking of which, it’s illustrative of just how hard it is to run a good study to examine their exclusions. They started their screen with almost 700 potential Ss to get a non-confounded group of 21. It doesn’t excuse all the bad science, but it does reflect on just how hard it is to get well controlled human studies. I hope this study can serve as a launch for another follow-up with bigger N’s and longer treatments (and older Ss).

    I noted your intention to speak separately about the thyroid numbers, but I didn’t think they changed all that much although on first view they do fit the trend that more carb in the diet requires more thyroid hormone. My thyroid numbers are ridiculous on VLC – TSH is down to .0016 – so much so that I won’t even show a doc! (But I feel awesome).

    Thanks again for all your work here. While all of your posts deserve widespread dissemination, this one is something that folks outside our little biology-geek club are talking about, and this post is really accessible.

    1. Peter Attia says:

      Thanks, Lorraine. Hope you can share this with a friend next time they try to warn you…

  9. Michele says:

    Dear Peter,
    “As difficult as it is to do excellent science, it turns out it’s even more difficult to interpret and communicate good science.”

    I can’t wait to see how NuSI will change that communication. I can’t wait because alone with the help of your blog, as well as your feedback on my little carbohydrate intolerance presentation, I managed to convince my father that the more he experiments with reducing or altogether eliminating carbs from his diet, the better he can control his type II diabetes. He’s due for a doctor visit soon to see if he can go from insulin shots to pills. Of course, it would be best if he didn’t need extra insulin at all but, for me, this a fantastic step in the right direction.

    Thanks for, at least on this small individual level, helping me interpret and communicate good science.

    1. Peter Attia says:

      Can’t wait to share it.

  10. Joshua says:

    Nice writeup. I suspect confirmation bias on my part, but what struck me the most was the lack of perspective that most of the “news” articles had regarding the efficacy of the low carb diet in dropping weight. Even if there is slightly more inflammation in a low-carb diet, the health (mental and physical) effects of a lower weight are critical.

    I’d also like to know what kinds of food constituted the 3 diets. One of the things I’m hoping to see out of NuSI is the study of effects of different kinds of low-carb diets. It’s all about perspective though – I read a similar criticism of the study from a low-fat proponent who thought that the low-fat diet still had too much fat.

    1. Peter Attia says:

      Yes, I was hoping to see this also, but as of my writing it the eMethods section was not up on the JAMA website. I’ll ask Dr. Ludwig when we speak next week.

  11. Marilyn says:

    Thanks for this!!! All this is so very interesting and helpful. I don’t know what’s the answer to the “road ahead” thing. In my own small-town tiddley-wink world, I was once interviewed by the local newspaper. When the article came out, it bore no resemblance to what I had said. I learned two things by that experience: 1) never believe anything I read in the news, and 2) if the newspaper wants an article, write it out word for word and hand it to them. That worked pretty well for me here. Unfortunately, that’s not so easily done with the larger news operations.

    1. Peter Attia says:

      Yes, I’ve unfortunately been reminded of this too often.

    2. Jillm says:

      Our neighbour was quoted in the local newspaper. He wasn’t even interviewed. He knew nothing about the article until a friend told him.

  12. Victoria says:

    Did the subjects receive the three diets in different orders? If they did, I wonder if that had an impact on how they reacted to them. For example, if a person coming off of the run-in phase went on the low fat diet first, the increase in carbohydrate may have set them up for a different response to a low carb diet than they would have had if they went on the low carb or low GI diet first.

    1. Peter Attia says:

      They did, and this is a good point. In fact, it’s quite likely that doing a low-fat diet after the other 2 would show a more favorable response than the reverse. This study was not powered to detect such an effect, though.

  13. FrankG says:

    Many thanks for adding your reading of this significant study Dr Attia. It is a wedge in the dam of “a calorie is a calorie” and hopefully all agree that it merits further investigation.

    I particularly picked up on this paragraph… “Proponents of the Alternative Hypothesis argue that intake (i.e., food) plays a role on hormones and enzymes in the body that have a resulting impact on energy output, and even subsequent input. For example, eating one food over another can increase or decrease appetite, increase or decrease REE, increase or decrease AEE, and even impact TEF. While the effect on each of these may be modest in isolation, even small changes over the course of days can result in significant changes over months or years. …the sentence in bold (my emphasis) is I think, key to moving us forward. Too much of what is written seems to focus only what we ate at this meal, or how much energy we expended at the the gym today; without stopping to look at the bigger picture over many weeks, months or years. Yes I may consciously control what I eat at this meal — possibly even weighing and measuring everything like a good CICO follower — but in the long term my body makeup is a result of biochemistry, more so than of conscious behaviour.

    1. Peter Attia says:

      Well said.

    1. Peter Attia says:

      Ha! Tim, you’re stealing my thunder. I was planning to do the deep-dive on this one next week. Would folks prefer this topic or back to cholesterol?

    2. Mike A. says:

      I’d like to vote for getting the cholesterol series to the finish line. I’m planning on seeing a cardiologist to discuss primary prevention and I want to be armed with as much information as possible. 🙂 My guess is that most of *your* readers are already suspicious of media reports on nutrition studies; however, I think your detailed explanations on cholesterol and related matters are invaluable and I haven’t found comparable resources elsewhere.

      There needs to be a support group for impatient Eating Academy readers.

      1. Peter Attia says:

        Appreciate your input.

    3. lorraine says:

      Peter, you can title that post “Dreadful Science, Good Interpretations” given the comments left at the article. My favs are Dr. Yoni Freedhoff, “That’s. Not. Low. Carb”, and the quote attributed to ex-editor of BMJ “Medical journals will soon be wrapping up next week’s fish and chip”. Ha!

    4. Keith says:

      Yes. Nice to see Zoe Harcombe go in with both barrels.

  14. Colleen says:

    What, if anything, do you make of the fact that on the VLC diet protein was increased from 20 to 30%? Is this the logical result of eating more meat or something else? I’ve seen other commentary arguing this was an important factor on the increased TEE. Love the science and real analysis. Thanks.

    1. Peter Attia says:

      It’s a good question, but I won’t know the answer until I speak with Dr. Ludwig (as far as why). I don’t believe, however, this difference resulted in the increased TEE, as Bray et al., failed to pick up this difference in their study earlier this year which varied protein intake.

    2. Vasco Névoa says:

      Upping protein a little when doing very low carb is a nice way of keeping blood glucose levelled without resorting to extreme ketosis. They probably did this by design?…
      But I’m just as curious to find if that extra gluconeogenesis doesn’t show up in the energy charts.

      1. Peter Attia says:

        They were not monitoring B-OHB levels, so I actually suspect the LC group was not in ketosis due to the protein load (about 200-220 gm/day) and even the carb load (about 90 gm/day). It would have been great to have seen a fourth (ketogenic) arm.

    3. Andy says:

      Cortisol seems to be related to levels of dietary protein – see the following link https://www.ncbi.nlm.nih.gov/pubmed/6270500 Therefore it’s perhaps not surprising that a diet with 50 % more protein than the other diets (i.e 30% for the low carb, high protein diet versus 20% for the low fat and low GI diet) should have higher cortisol readings. Shame they couldn’t have limited protein in the low carb diet to 20% as well, thus minimising the likelihood of dumb press articles (if such a thing is ever possible……)

      1. Peter Attia says:

        I’ll have to check this study out. Agree that they should have held protein constant across all 3 groups for sure. 20% for everyone and then all manipulation on F vs. C.

  15. Sam Y says:

    Regarding energy output, is there a fourth category, food that is excreted but not digested?

    Is it possible that in a higher fat diets the body absorbs an amount of fat that is determined by some hormone/enzyme driven equilibrium and the rest just passes through?

    1. Peter Attia says:

      Yes, re-read point 2, below:

      Furthermore, energy output can be broken down into four sub-components:

      1. Resting energy expenditure (REE) – the amount of energy expended to stay alive at rest (e.g., energy required for basic cellular function like ion transport and respiration)
      2. Thermic effect of food (TEF) – the amount of energy required to process and digest food (I also include in this category the amount of energy lost as undigested material in stool)
      3. Activity energy expenditure (AEE) – the amount of energy expended by exercise and non-exercise movement (I consider these as two forms of expenditure)

      The sum of REE, TEF, and AEE is called, appropriately, total energy expenditure (TEE).

    2. Vasco Névoa says:

      I’ve always been curious as to how we regulate dietary fat absorption. We seem to do it so perfectly well, excreting the excess calories effortlessly, while the same simply isn’t true of carbohydrate.
      Unfortunately there are ample resources clarifying carbohydrate metabolism but I can’t find any detailing fat digestion and metabolism.
      Can anyone point me to a place where I can find out what happens to the excess fat we eat?

      1. Peter Attia says:

        It depends on the type of fat and the hormonal environment. We can certainly store plenty of extra dietary fat under the “wrong” conditions.

    3. Rob L. says:

      I am also wondering if the classic energy balance equation is flawed. Could energy that we consume be leaving the body in other ways? I ask this due to the following observations:

      *people on ultra-low carb, high fat diets often eat significantly more calories and still lose weight
      *excess glucose in the blood (and perhaps ketone bodies, I don’t know) are excreted in the urine ie. diabetics
      *there is a “fecal fat test” which leads me to believe that under certain conditions, fat is excreted in the feces
      *the claim that fiber consumption decreases the caloric value of a meal by 20%

      These are all additional methods that “energy” could be leaving the body besides fat production, exercise and basal metabolism.

      1. Peter Attia says:

        This is all accounted for by the First Law. Read the previous posts I’ve written on this topic. TEF accounts for these changes. There is no magic if you draw the boundary conditions correctly.

  16. Robert Newman says:

    hi Peter,
    Of course I want you to get into both topics, but I find the diet-composition stuff very useful in the Intro Biology class I teach. Students are interested, have all sorts of pre-conceptions, are often confused by conflicting “stories” they have heard, and this is a fantastic place to push them toward critical thinking, evaluation of evidence (or at least expose them to the idea that not all that they read or hear should be assigned equal value), etc. So my vote would be to continue with the diet composition theme to “flesh” it out.
    BTW, I actually ask the students to try to design a study that would allow them to test the effect of diet composition on weight loss. At least it gets them thinking about what things they need to be thinking about.
    Thanks for your very insightful communications.

    1. Peter Attia says:

      Robert, your students are lucky to have you as a teacher. The great ones do what you’re doing — get the students to think, not regurgitate.

  17. fatblond says:

    I look forward to the post on elevated cortisol levels. I wonder if it has something to do with the short duration of the the test phase, i.e. four weeks. On a lo carb diet your body is going through adaption to ketosis, which for new inductees can take a while. Your own personal history discussed this. As these were obese patients you can likely bet they were carb heavy prior to the test and not lo carbers. As a result, during the four week phase, their bodies were likely producing cortisol at some point for gluconeogenisis to raise their blood sugar until they were adapted to ketones. In a longer study, I wonder if the corisol levels would fall, remain the same, or if there is some other reason to have “slightly” elevated cortisol levels.

    1. Peter Attia says:

      Absolutely. Robb Wolf has spoken a great deal about this. Very important point.

    2. Afifah says:

      I too am dying to read your post on cortisol Peter.
      I am doing a series of public presentations on food and health and the next one is on STRESS. I can tell you, it is stressing me out more than the previous ones, as there is such a dearth of sound or detailed information out there regarding cortisol levels and the effects of various dietary factors.
      I am a LCHF faithful, and have been eating this weay for four years. The whole family has become entirely grain free and use animal fats and organic animal meats, eggs, dairy products and veg, but there is too little proper information out there for me to make any firm statements or recommendations regarding the effects of these foods on cortisol.
      And, would it matter what cortisol levels are, whether higher or lower than ‘standard’ patterns, if the individual in question feels fine and dandy and not flat or stressed out?
      I have been working on this all week and am still going round in circles.
      Love your work Peter, thank God for people like you, and all you other commenters, you all educate me, so thank you.
      Afifah (England)

  18. Thomas Dayspring aka "Dr Lipid" says:

    Peter, as you know what any diet does to any plasma cholesterol level is potentially meaningless: more important would be what the diet does to lipoprotein particle numbers and with respect to HDL, what is does to HDL proteomics, lipidomics and functionality, none of which correlate well with HDL-C. Also CRP is a risk factor associated with atherosclerosis and other diseases but it is very still debatable whether it is a causal agent. The drug Vioxx or rofecoxib (removed from the market) significantly lowers CRP but is assopciated with atherosclerotic risk. So neither I or anyone else can conclude what the low carb CRP rise might mean in the long term

    1. Peter Attia says:

      Excellent points, Tom. I just finished reading that LDL-P, LDL-C, hs-CRP study which reiterates this point. Will write about it in the next cholesterol post.

  19. Hallie says:

    Please do more on this topic.