Last week we talked about how we can often conflate the frequency and severity of accidents. We may mistakenly believe that the chances of dying are greater in the air than on the road because the severity of aviation accidents can be devastating. Compare that to automotive accidents where the probability of dying in a given automotive accident is about one half of 1 percent. Here’s the rub, unfortunately: nearly 18,000 automotive accidents occur every day in the US, on average. This frequency multiplied by the low severity still amounted to nearly 37,000 automotive fatalities in 2018. To put this difference into perspective, between 2000 and 2018 there were 778 fatalities from US scheduled air travel. Over the same time span, there were 723,530 automotive fatalities—almost 1,000 times greater than the number of fatalities from scheduled air travel.
These numbers should scare anyone. If I die in the next 10 years, the most probable “murder weapon” is my vehicle or another vehicle on the road. Is there anything I can do to lower the chances of dying in a car or from a car? Of course, never stepping foot in a car again would drastically lower my chances, but there are trade-offs in life. Before I get into my risk-reduction strategy, a few statistics are in order to inform it. Also, a caveat: for this analysis, I’m only interested in the driver and what he or she can do to lower the risk of death. I care a lot about pedestrians and other occupants in the vehicle, but to do this analysis, I must remove them from the equation.
Of all drivers killed in US automotive accidents in 2017, 18% occurred on a freeway. This is actually lower than I expected. I think this speaks to a more controlled environment where an interstate must meet federal standards and includes fully controlled access (i.e., entering and exiting is confined to on and off ramps) and a median width of at least 50 feet.1This control of access importantly requires what is called grade separation, meaning interstates should not have any intersections. Interstates, specifically, account for 13% of driver deaths, while freeway and expressway crashes make up the other 5%. For those wondering about the nomenclature, it’s a little messy, but interstate highways must conform to the most stringent safety standards, followed by freeways (most interstates are freeways) which also include fully controlled access, while expressways may only be partially-controlled; they have a very limited number of at-grade intersections. Despite the differences, for simplicity, I’ll refer to this category simply as “freeway” from now on.
Perhaps the biggest reason why we don’t see more fatal crashes on freeways is that there are no intersections on them (with a few exceptions). In fact, there are more drivers killed in intersections (20%) than on freeways.
After accounting for freeways (18%) and intersections and junctions (20%), we’re still left with more than 60% of drivers killed in automotive accidents left accounted for.
It turns out that drivers killed on rural roads with 2 lanes (i.e., one lane in each direction divided by a double yellow line) accounts for a staggering 38% of total mortality. This number would actually be higher, except to keep the three categories we have mutually exclusive, we backed out any intersection-related driver deaths on these roads and any killed on 2-lane rural roads that were classified as “freeway.” So, to recap, 3 of out every 4 deaths in a car occur on the freeway, at an intersection/junction, or on a rural road with a single lane in each direction.
Let’s double-click on each one of these categories and see if we can answer two very important questions:
- What driving error resulted in the fatality?
- Who is most likely to be at fault and what was the underlying cause of the error? (One way to think about this question is through the lens of manslaughter versus accidental suicide—was the driver effectively killed by someone else making a mistake, or by a mistake they made?)
If we can answer these questions, we may gain insight into what we can do to lower our risk of death (and the death of others) while driving.
In the cases where drivers are killed on freeways, 31% of them have alcohol in their system and nearly 85% of these drivers were over the legal limit of 0.08 g/dL. Furthermore, 29% of all driver deaths involved speeding, and just under 1 in 10 involved distracted driving. It’s difficult to get mutually exclusive and collectively exhaustive data here, and there are often multiple related factors. For example, it’s not uncommon for a driver to die on a freeway while speeding and over the legal limit of alcohol.
The primary conditions that lead to fatalities, then, are: alcohol, speeding, and distraction leading to a loss of control or contact with another vehicle.
Who is likely to be at fault on a freeway, the driver that was killed, or another driver on the road? It’s not exactly clear from the data, but that doesn’t change our strategy.
Why? I think the steps below make it clear.
Rule #1: Consider the conditions above as your not-to-do list to reduce the risk of accidental suicide: Do not drive with alcohol in your system, even if you are (or think you are) below the legal limit. Do not speed. Do not text and drive. Do not get behind the wheel if you are sleep-deprived.
Rule #2: Assume others are not adhering to Rule #1. In particular, assume one person awoke today with the explicit instruction to kill you with their car. If you knew this, how vigilant would you be? How much more closely would you pay attention to each other driver around you? That person swerving around or braking too late? That person looking at their phone? That person speeding up behind you? Look for the killer. Be vigilant at all times, and make sure today is not his day.
§
Let’s move to the next category of fatalities—intersections and T-junctions.
I learned something from one of my best friends in high school who is a long haul truck driver. Talk about someone having a front-row seat to vehicular manslaughter. He told me many years ago that when approaching an intersection, with the right of way, he always looks left first, then right, before entering. Why? The data below show you what his intuition suggested and his experience crystalized.
Let’s start with intersections. A driver is most likely going to be struck near the driver’s side by another vehicle, otherwise known as a broadside or T-bone crash. Figure 1 illustrates the different crash scenarios. If a driver is heading through an intersection, with the right of way, the most common cause of his death is the driver on his left, where both cars cross paths, as scenario #2 in Figure 1 most clearly depicts.
Scenario #5, in which two cars go straight through the intersection, has the highest severity. While the figure shows the vehicle heading left to right struck by the one heading up, it’s often the case where the vehicle heading up is struck by the other heading left to right, running a traffic signal or stop sign.
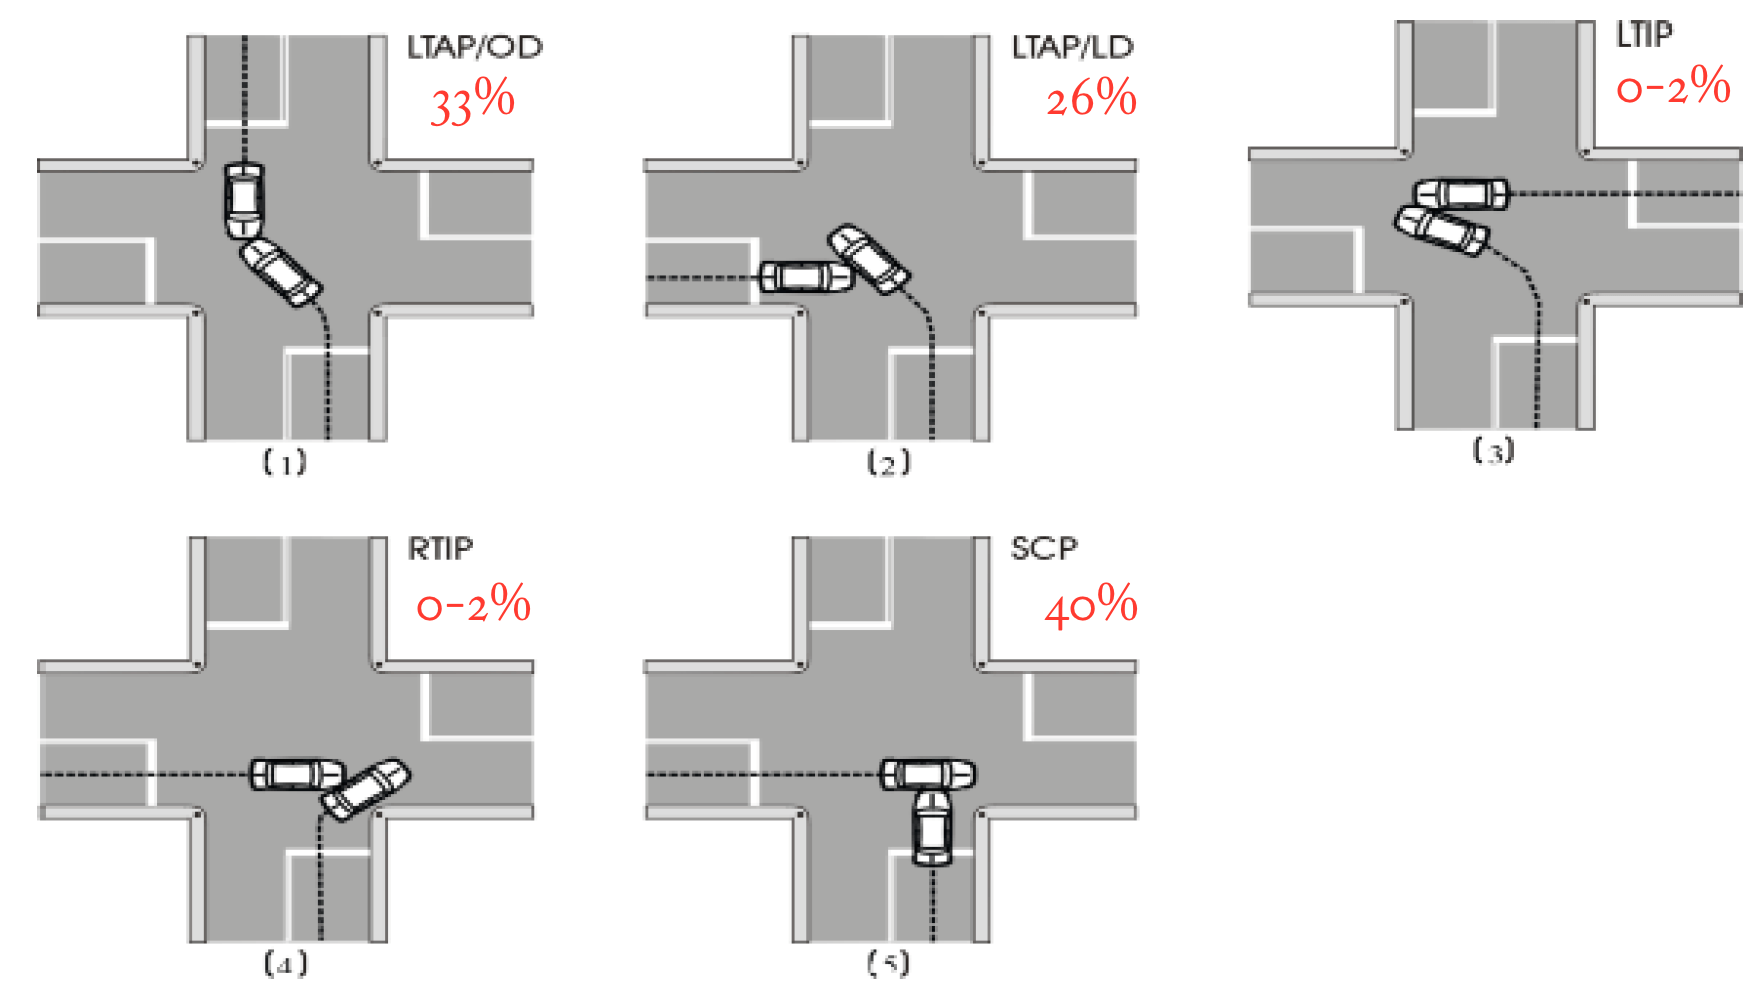
Figure 1. Schematics of, and percent of fatal crashes, Common Crossing Path Crash Scenarios. Fatal crashes include intersections and T-junctions. Figure from the US Department of Transportation.
Legend:
(1) Left Turn Across Path – Opposite Direction Conflict (LTAP/OD)
(2) Left Turn Across Path – Lateral Direction Conflict (LTAP/LD)
(3) Left Turn Into Path – Merge Conflict (LTIP)
(4) Right Turn Into Path – Merge Conflict (RTIP)
(5) Straight Crossing Paths (SCP)
Who is most likely to be at fault when a fatal driver crash occurs at an intersection? It’s often the driver that dies who is the one not at fault. They’re more likely to be obeying the rules of the road, with the right of way, when someone blows a stop sign or traffic light and strikes the victim on the driver’s side, or at an angle.
However, the fault is often shifted to the driver in fatalities occurring at T-junctions. In this case, the driver that’s going to be killed reaches the junction (i.e., traveling up the stem of the “T”) where the road intersects, and proceeds to make a turn before it is safe to do so and is most often struck on the left side by the car traveling in the lateral direction (i.e., heading left-to-right on the horizontal line of the “T”) with the right of way. This type of accident resembles scenario #2 in Figure 1. The second most common way to get killed is when traveling right-to-left on the “T” and turning left into the stem of the “T” and the vehicle is struck by another heading in the opposite direction. This accident looks like scenario #1 in Figure 1 (you need to rotate the figure 90 degrees left in your mind’s eye for it to match my “T” description for it).
§
Lastly, let’s turn our attention to the final, and largest, category of deaths. Determining who’s more likely at fault in driver deaths on 2-lane rural roads may be a little bit harder to pinpoint, but we have some clues. In about 10% of drivers killed in this category, prior to the crash, also referred to as the pre-crash critical event, another vehicle heading in the opposite direction crossed the left lane (i.e., the double yellow line) into the victim’s lane. I think it’s safe to assume that the other driver was responsible for the crash.
However, more often (17% of cases), a driver that is killed on this type of road is the one crossing the lane to his left and encroaching on the opposite lane of travel as the pre-crash critical event. In drivers killed on 2-lane rural roads, 50% involved a driver not wearing a seat belt. Close to 40% have alcohol in their system and nearly 90% of these drivers were over the legal limit of 0.08 g/dL. About one-third involved speeding, and 16% did not have a valid driver’s license. I think this suggests that driver error plays a larger role rather than another driver at fault. At the least, it suggests that there are some simple things we can do to lower the driver death rate. Which brings me to the larger point of this post.
What are some of the things you can do to improve your chances of not becoming a statistic on the road?
The first thing you should do is understand what you should not do.
- Speeding is the biggest related factor, involving an estimated 30% of all drivers killed.
- Next is being under the influence of alcohol (as well as drugs or medications, the most common being stimulants, that may make drivers more aggressive and reckless, and cannabinols, that may slow coordination, judgment, and reaction times), where 33% have at least some alcohol in their system and nearly 90% of these drivers were over the legal limit of 0.08 g/dL.
- After that comes distracted driving (8%), which of course involves the use of mobile phones, failure to keep in the proper lane or running off the road (7%), failure to yield the right of way (7%), and careless driving (6%). I would argue that all of these factors are a form of careless driving (with the exception of some of the crashes involving running off the road).
These are not mutually exclusive factors. I would also argue that the numbers on distracted and drowsy driving (the latter not included above because it’s reportedly involved in only 2% of driver deaths) are underestimated and don’t capture the influence of texting in the case of the former, and the impact of poor sleep in the latter, except in the most extreme cases.
How can you drive more carefully? The best place to start is to look at the factors in the list above and take an honest inventory. As I discussed in the previous email, while there’s no assurance that what I do in a car will keep me alive, I think I can reduce the odds of that happening, beyond simply avoiding these factors, as important as they are. But, and here’s the key point, assume someone like this person is on the road at all times, and his sole purpose is to kill you. He’s a serial killer and uses his vehicle as his murder weapon. His killing statistics eerily resemble the overall fatal crash statistics. He does a lot of his killings at intersections, but isn’t shy about hopping on the freeway and taking people out there, too.
On the freeways, he may suddenly leave his lane and enter yours within inches of your front bumper, or he’s side by side trying to make contact with your vehicle. Be on the lookout for this maniac.
At intersections, he really likes being on your left and he loves running red lights and stop signs. If you’re going through a green light or a road that intersects with stop signs, look left before you enter and cross the intersection. If you’re at a red light that turns green or proceeding through a stop sign, first look left to make sure the killer isn’t there.
On rural 2-lane roads, he’s been known on occasion to travel in the opposite direction of his victim, leave his lane and force his distracted victims, who traveled these roads so many times they think they can drive them in their sleep, into an avoidance maneuver that results in them driving off the road and rolling their vehicle. This is where you need to remind yourself that even though you’ve driven these roads countless times without a scratch, it does not give you a pass to be more complacent and lose your focus.
Remind yourself every day to take these measures every time you get behind the wheel. Most of these are obvious and you’ve heard them before, but if you look at the data, my hope is that it makes the steps you can take more tangible.
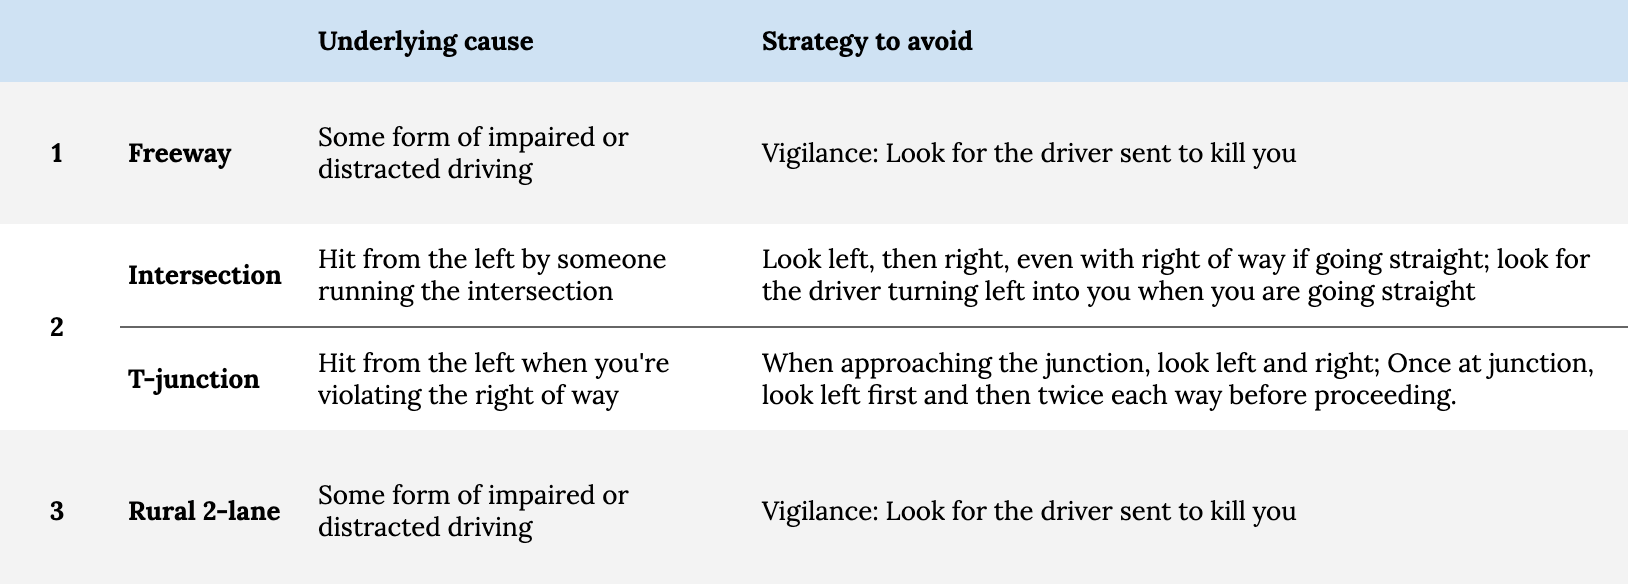
Here in Table 1, I summarize the primary locations of US automotive fatalities, the underlying causes, and most importantly, the steps you can take to reduce your risk of succumbing to them beyond the obvious (Rule #1, above, the so-called not-to-do list).
Table 1. Common causes of driver deaths and additional strategies to reduce their risk.
Before closing this morbid email, one of my patients, who is himself a very frequent helicopter passenger, sent me his rules of engagement for safer flying after reading last week’s email. With his permission, I’m listing them here.
- Always fly a twin engine. Two engines are better than one. Statistically, yes, and obvious.
- Always “try” to get two pilots. Not because one might have a heart attack (also possible) but to help for visual aid. Watch next time you are in the New York harbor. One pilot is always frantically looking around to avoid the heavy traffic.
- If on a crowded helicopter – and they don’t weigh everyone – ask why? It’s actually mandatory on the best-run helicopters.
- Always ask for instrument capable pilot and guidance systems.
- Always try to avoid bad weather with limited visibility.
– Peter


Some 59% of intersection crashes involved cars turning left. In 1959, FBI Director J. Edgar Hoover’s car was struck from behind while turning left, so he told his driver never turn left. How to do that?
Road design could replace stoplight intersections with rotaries. Cross streets could force to enter turning right and then reversing at rotaries. I noticed that on Mexican highways, cross street cars must turn right and then make a U-turn at designated breaks (sometimes in special lanes) instead of cloverleafs (much more expensive but safer?).
In Taiwan, scooters at lights, instead of turning left, are given an area at the head of the cross street, and so can turn right into that area and wait for the light to turn to proceed across the intersection safely.
Hoover’s driver wrote a humorous book about it but didn’t relate his plan driving from Dallas to Austin. Road design has improved. However, if your car is hit turning left you might have the same feeling.
In Montreal, left turns on city arterial streets are generally banned from 7-22h. In addition to being safer for drivers, this is a big win for people on foot, as permissive left turns (eg on solid green without a flashing arrow giving protected priority) are among the most cognitively demanding manoeuvres a driver can make. Drivers’ attention is typically focused on assessing oncoming traffic to find a safe gap for their left turn, with little cognitive capacity left over for scanning the sidewalk and crosswalk for people walking.
I live in London and drive for work and see a plethora of accidents on the roads. Mainly uber drivers that get paid so miserably, they need to work 10-16hr days to get some xtra after paying their costs. Its not just the fact they dont know the city or junctions etc…. its mainly sleep deprevation and they shouldnt be allowed on the roads. Unfortunately, when the company offer the government a backhander and sign behind closed doors, the public have to suffer the consequences, as usual.
Terrific! I spend a lot of time listening and reading your offerings. I feel as though I’m getting a PhD in survival.
By the way, your comment on squats being the most important exercise and my daily addition of them to my exercise routine have made for huge improvements in my knees, gait, and mountain biking. Still going strong at 76 in New Mexico. By the way how about a segment or podcast focusing on older folks.
ICYMI every one of his podcasts is directly or indirectly about aging.
Wow, Peter this was so good! I was already doing some of the things you wrote about, but now there is even more for me to be aware of. Thank you so much!
Thank you for the interesting and informative article. I have a concern. “Speeding is the biggest related contributor, involving an estimated 30% of all drivers killed.” I don’t see how you arrived at the conclusion that speeding is a related contributor. You earlier stated that “29% of all driver deaths involved speeding”, but I don’t see how that implies that speeding was a related contributor to the death.
Probably about 90% of the drivers who die in traffic accidents are right handed, but I don’t conclude that being right-handed contributed to their death.
You also didn’t indicate what percentage of drivers are speeding at any given time. Maybe it’s just being in California, but when I’m on the freeway it seems that far more than 30% of the drivers are speeding. If, say, 50% of freeway drivers were speeding at any given time, but only 30% of drivers killed were speeding, one might suspect that speeding reduces fatalities (on freeways). And, if 30% of all freeway drivers were speeding at any given time, the same as the percentage of drivers killed while speeding, it would seem parsimonious to suspect no correlation between speeding and getting killed.
This is a very intelligent critique, in terms of analyzing the math and the difference between correlation and cauastion, but it’s based on a mistaken premise. When NHTSA says “29% of all driver deaths *involved* speeding,” they don’t just mean that 29% of all dead drivers *were* speeding, but that speed was judged by the police or NHTSA investigators as a causal factor in the crash or the fatality.
Mikal – I think if the driver died because another driver was “speeding”, then yes, it was a death caused by speeding.
My concern is that “speeding” is so loosely and variously defined that the official statistics are sub-optimal.
Your statistical reasoning is very good Wayne 🙂
Reminded me of this HBS article (https://digital.hbs.edu/platform-rctom/submission/just-like-derek-zoolander-ups-drivers-cant-turn-left/) where 90% of turns taken by UPS trucks are right turns.
I don’t think you can conclude from these statistics that speeding causes accidents. You first need to know how often people are speeding. Assuming people speed 30% of the time, it’s only natural speeding is involved in accidents 30% of the time.
Great post.
Were you able to consider weather conditions and visibility as factors in crashes? In my experience the vast majority of drivers do not seem to adjust their behavior to their circumstances. When visibility and stopping distances are greatly reduced drivers should slow down and give more space. They don’t seem to.
Could visibility also be a factor on rural roads? Many of these roads twist and turn and also probably have little or no lighting. Is there any data on day vs night crashes?
Very informative and potentially life saving article. However, I would suggest you refrain from using the term accident. Crash, wreck, or collision are more appropriate terms to use. And for the comments on speeding, speed doesn’t necessarily kill, but sudden deceleration does. Decelerating from 60 to zero into a tree is much different that 20 to zero.
Fantastic post. It’s extremely relevant to me right now as flights out of a smaller but closer airport are typically much more expensive, but at what point does the extra risk involved in a 2.5 hour highway trip to the larger, cheaper airport become “worth the risk”? It’s a whole extra set of variables and yes, one should be willing to spend a relatively unlimited amount of extra money to be safer, but how much is that? $300? $1,000? (these are actual differences based on actual trips I’m planning for the year, pretty crazy). It also depends how often you travel, with how many people, how particularly dangerous is this strip of highway… etc. etc. Wondering if anyone has considered such situations, especially in light of this excellent article.
Great post. On a more accurate estimate of accidents involving sleep deprivation: I’m here going to be lazy by just quoting the Wikipedia summary, but it accurately summarizes the cited study: “Between October 2010 and December 2013, researchers at the AAA Foundation conducted a study in which they continuously monitored 3513 drivers from six locations across the United States, using in-vehicle cameras and other equipment to objectively assess driver sleepiness using the PERCLOS measure, which is the percentage of time that the driver’s eyes are closed over a defined time period.[11] Of 701 crashes the researchers studied, drowsiness was a factor in 8.8%-9.5%, including 10.6%–10.8% of crashes that led to significant property damage, deployment of the airbag, or injury. No fatal crashes occurred over the course of the study, however, so the researchers were unable to reliably estimate drowsy driving’s contributions to fatalities.[11]”
https://aaafoundation.org/prevalence-drowsy-driving-crashes-estimates-large-scale-naturalistic-driving-study/
One more thing: this article mentions once that “In drivers killed on 2-lane rural roads, 50% involved a driver not wearing a seat belt,” but never mentions seat belts again. Per NHTSA:
——————————————
Of the 37,133 people killed in motor vehicle crashes in 2017, 47% were not wearing seat belts. In 2017 alone, seat belts saved an estimated 14,955 lives and could have saved an additional 2,549 people if they had been wearing seat belts. …
If you buckle up in the front seat of a passenger car, you can reduce your risk of:
Fatal injury by 45% (Kahane, 2015)
Moderate to critical injury by 50%
If you buckle up in a light truck, you can reduce your risk of:
Fatal injury by 60% (Kahane, 2015)
Moderate to critical injury by 65% (NHTSA, 1984)
https://www.nhtsa.gov/risky-driving/seat-belts
————————————————-
Note also that wearing a seat belt reduces one’s risk of death no matter what your state as a driver or the state of other drivers on the road may be, and only has to be done once as a habit at the beginning of the trip, unlike the difficult task of constant vigilance required to play the “spot the vehicular murderer on the road” game.
Good article – except for your speeding conclusions, as pointed out by several other people here.
I would like to point at the speeding statistics you are quoting are probably from state sources and are sub-optimal. Official accident reports allow the reporting officer to nominate “speed” as a contributing factor. That is where your numbers are coming from. Accident reports where “speed” is the only contributing factor are not that common.
You should understand that, in these accident reports, “speed” is not always, and possibly not even mostly, the same as “speed in excess of the posted limit”.
The officer filling out the report actually doesn’t know at what speed the accident happened, and he doesn’t have time or resources to find out (most car’s computer systems will cough up the info, given time and manufacturer support when needed). The officer “guesstimates” the speed, and some officers are better at that than others.
Further, if it was possible to filter out reports where the speed was lower than the posted limit + 10% then the number of speed-related fatalities would be much lower. Joe Public assumes that “speeding” means something like “going a lot faster than the posted limit. Joe P. would not regard 65 mph in a 60 zone as “speeding”.
Some statistical notes:
Your airplane versus car accident rate stats are slightly misleading. They follow the airline industries line (mostly).
(a) You are comparing ALL road fatalities (private cars, trucks, school buses, commercial passenger buses etc) to ONLY “778 fatalities from US scheduled air travel”.
“Scheduled air travel” is the very safest segment of air travel, with air traffic control, mandatory safety checks, layers and layers of highly trained and paid personnel.
A fairer comparison would be “US commercial air travel” versus “US commercial road travel” (ie, buses, taxies, Uber, Lyft, couriers, ambulances, police and trucks).
(b) On any given day some 1.5 million people take a commercial flight in the USA. On that same day around 150 million Americans make a car, bus, taxi, Uber etc journey. There are 100 times more people travelling by car, so 100 times more fatalities should be expected.
(c) Yes, you didn’t fall for the airlines “fatalities per million miles” statistics. Very wise.
A fairer comparison than that highly misleading statistic would be “fatalities per trip”. One reason it is fairer is that, once you board a plane you must complete the trip. There is no “I will get out here because I think I’ve reached the million mile fatality limit”.
““Scheduled air travel” is the very safest segment of air travel, with air traffic control, mandatory safety checks, layers and layers of highly trained and paid personnel.
A fairer comparison would be “US commercial air travel” versus “US commercial road travel” (ie, buses, taxies, Uber, Lyft, couriers, ambulances, police and trucks).”
I don’t think that’s quite reasonable for what we’re trying to look at. To a traveler, driving a car and taking a flight are two common, relatively expedient transportation methods that are often substitutes. In any event “ambulances, police and trucks” are certainly NOT common passenger transport methods, and my understanding is that taxi/Uber/Lyft crash statistics and fatalities are suggestive of not being substantially different than private passenger vehicles.
Without access to the actual data, I have to ask here: Are these likelihoods controlled for distance traveled?
It makes intuitive sense to me that death on two-lane non-urban roads is high, because most of my commute for years took place on just such roads – if I’m going to die in traffic, it seems likely that it’ll happen on a road I am actually on and not somewhere else 🙂
Another factor I would like to see mentioned, would be time of day as it affects crashes/fatalities. I live in a small town, where it seems we lose a dozen drivers every summer, late-late at night, due to “single car accident, driver ejected”. And most of these are younger persons, down to high school age – out late at night, trying to get back to the house after a night partying/drinking.
NHTSA says “Two-thirds of all motor vehicle fatalities between the hours of midnight and 3 a.m. occurred in alcohol-impaired-driving crashes, and more than half (55%) of drivers involved in fatal crashes at those hours, were alcohol-impaired.”, and I would imagine this skews even higher on the two-land country roads you talk about in the article. I don’t know how to get data broken down by both time and accident type from the data, but any local ambulance driver will tell you the best way to maximize you chances are to avoid drunk-night: any night after midnight, and Friday and Saturday nights after 6pm generally.
* from my ancient restaurant days, I would also put monday evenings down in a high risk time. Especially in high-finance, wealthy areas, Monday was always a hard drinking night. Without any evidence, I put it down to the stress of going back to work after the weekend. Purely anecdotal, but you usually see bars/restaurants start drinking specials on Tuesday night, so there might be something to it.
As a traffic engineer I pleased to see someone outside my profession calling attention to the toll traffic fatalities have on society.
But, I think you’re missing one of the main factors. According to the IIHS, roughly 45% of falal accident victims were not wearing a seatbelt. The best safety measure is one of the easiest measures and we’ve known that for over 50 years.
Great post. I’m going to forward it to my kids – when I taught them to drive I told them to watch out for idiots – unfortunately the roads provide a lot of examples of all of these behaviors frequently – it’s actually amazing there aren’t more fatalities. But really, your approach is right – you really have to assume their is another driver out there who is trying to kill you.
I live in a rural-ish area with lots of two lane roads (plus with lots of hills, so if someone is drifting across the double yellow, sometimes you crest a hill to find them a foot or two in your lane coming right at you). There have been some head on collisions (sadly, fatal) but even more common (and equally fatal) is, as you suspect, an inexperienced driver (whether drifter or driftee) jerks the wheel to the right to avoid the collision with the other driver and hits a tree (in most places, there are woods right next to the road – in some cases, there will be a huge tree trunk just an inch or two from the two lane roadbed). It’s hard to address – you can watch your speed, but you can’t crawl up every hill. The best I can tell my kids is don’t be shy about honking, and don’t overcorrect into a tree (easier said than done).
sorry, “there is” not “their is”…
“Of course, never stepping foot in a car again would drastically lower my chances, but there are trade-offs in life.”
1. Well, there certainly are trade-offs, but let’s not turn this into a false binary. It’s not simply a matter of driving or not. You probably could drive LESS and still enjoy a very meaningful reduction in risk. Simply consider what driving you’re doing and whether it’d be possible to drive less to achieve the same result.
For instance, I’ve dramatically cut down on my driving by moving into an apartment building with a directly connected Whole Foods, a gym on the same block, within a 10 minute walk of work. I use Walmart’s unlimited delivery subscription service and Amazon for most other necessities. As a result, I’ve cut my 16,000 miles of driving down to 3,000 miles. That’s got to be a very substantial risk reduction. I also enjoy substantially more free time as a result.
Everyone will be different, but simply being more mindful of when and why we’re driving, as well as considering how much driving we have to do when deciding where to live can probably produce significant improvements in terms of risk, time and possibly money. I don’t really care about the planet, but there’s that too.
2. As other’s have pointed out, seatbelts provide a huge reduction in risk. The car you drive also can dramatically change your risk of serious injury or death. There’s a dramatic range of crash test performance between vehicles, possibly changing risk by an order of magnitude or more between the safest and least-safe NEW vehicles available today. I’d suggest looking at informedforlife.org for their picks, which combines ratings across agencies for the best choice.
A DWI probably costs the average person around 5-10000 dollars by the time the lawyers, court costs, and associated treatment is paid for. Speeding on the other hand, is merely a 100-200 ticket. If speeding is a leading cause of death in traffic accidents, the state should probably punish speeders as harshly as people driving under the influence. I have been riding a motorcycle for about 25 years and was taught to always check intersections and assume everyone on the road is trying to kill me.