
Want to catch up with other articles from this series?
- The straight dope on cholesterol – Part I
- The straight dope on cholesterol – Part II
- The straight dope on cholesterol – Part III
- The straight dope on cholesterol – Part IV
- The straight dope on cholesterol – Part V
- The straight dope on cholesterol – Part VI
- The straight dope on cholesterol – Part VII
- The straight dope on cholesterol – Part VIII
- The straight dope on cholesterol – Part IX
Previously, in Part I, Part II, Part III, Part IV and Part V of this series, we addressed these 7 concepts:
#1 — What is cholesterol?
#2 — What is the relationship between the cholesterol we eat and the cholesterol in our body?
#3 — Is cholesterol bad?
#4 — How does cholesterol move around our body?
#5 – How do we measure cholesterol?
#6 – How does cholesterol actually cause problems?
#7 – Does the size of an LDL particle matter?
(Not so) quick refresher on take-away points from previous posts, should you need it:
- Cholesterol is “just” another fancy organic molecule in our body but with an interesting distinction: we eat it, we make it, we store it, and we excrete it – all in different amounts.
- The pool of cholesterol in our body is essential for life. No cholesterol = no life.
- Cholesterol exists in 2 forms – unesterified or “free” (UC) and esterified (CE) – and the form determines if we can absorb it or not, or store it or not (among other things).
- Much of the cholesterol we eat is in the form of CE. It is not absorbed and is excreted by our gut (i.e., leaves our body in stool). The reason this occurs is that CE not only has to be de-esterified, but it competes for absorption with the vastly larger amounts of UC supplied by the biliary route.
- Re-absorption of the cholesterol we synthesize in our body (i.e., endogenous produced cholesterol) is the dominant source of the cholesterol in our body. That is, most of the cholesterol in our body was made by our body.
- The process of regulating cholesterol is very complex and multifaceted with multiple layers of control. I’ve only touched on the absorption side, but the synthesis side is also complex and highly regulated. You will discover that synthesis and absorption are very interrelated.
- Eating cholesterol has very little impact on the cholesterol levels in your body. This is a fact, not my opinion. Anyone who tells you different is, at best, ignorant of this topic. At worst, they are a deliberate charlatan. Years ago the Canadian Guidelines removed the limitation of dietary cholesterol. The rest of the world, especially the United States, needs to catch up. To see an important reference on this topic, please look here.
- Cholesterol and triglycerides are not soluble in plasma (i.e., they can’t dissolve in water) and are therefore said to be hydrophobic.
- To be carried anywhere in our body, say from your liver to your coronary artery, they need to be carried by a special protein-wrapped transport vessel called a lipoprotein.
- As these “ships” called lipoproteins leave the liver they undergo a process of maturation where they shed much of their triglyceride “cargo” in the form of free fatty acid, and doing so makes them smaller and richer in cholesterol.
- Special proteins, apoproteins, play an important role in moving lipoproteins around the body and facilitating their interactions with other cells. The most important of these are the apoB class, residing on VLDL, IDL, and LDL particles, and the apoA-I class, residing for the most part on the HDL particles.
- Cholesterol transport in plasma occurs in both directions, from the liver and small intestine towards the periphery and back to the liver and small intestine (the “gut”).
- The major function of the apoB-containing particles is to traffic energy (triglycerides) to muscles and phospholipids to all cells. Their cholesterol is trafficked back to the liver. The apoA-I containing particles traffic cholesterol to steroidogenic tissues, adipocytes (a storage organ for cholesterol ester) and ultimately back to the liver, gut, or steroidogenic tissue.
- All lipoproteins are part of the human lipid transportation system and work harmoniously together to efficiently traffic lipids. As you are probably starting to appreciate, the trafficking pattern is highly complex and the lipoproteins constantly exchange their core and surface lipids.
- The measurement of cholesterol has undergone a dramatic evolution over the past 70 years with technology at the heart of the advance.
- Currently, most people in the United States (and the world for that matter) undergo a “standard” lipid panel, which only directly measures TC, TG, and HDL-C. LDL-C is measured or most often estimated.
- More advanced cholesterol measuring tests do exist to directly measure LDL-C (though none are standardized), along with the cholesterol content of other lipoproteins (e.g., VLDL, IDL) or lipoprotein subparticles.
- The most frequently used and guideline-recommended test that can count the number of LDL particles is either apolipoprotein B or LDL-P NMR, which is part of the NMR LipoProfile. NMR can also measure the size of LDL and other lipoprotein particles, which is valuable for predicting insulin resistance in drug naïve patients, before changes are noted in glucose or insulin levels.
- The progression from a completely normal artery to a “clogged” or atherosclerotic one follows a very clear path: an apoB containing particle gets past the endothelial layer into the subendothelial space, the particle and its cholesterol content is retained, immune cells arrive, an inflammatory response ensues “fixing” the apoB containing particles in place AND making more space for more of them.
- While inflammation plays a key role in this process, it’s the penetration of the endothelium and retention within the endothelium that drive the process.
- The most common apoB containing lipoprotein in this process is certainly the LDL particle. However, Lp(a) and apoB containing lipoproteins play a role also, especially in the insulin resistant person.
- If you want to stop atherosclerosis, you must lower the LDL particle number.
- At first glance it would seem that patients with smaller LDL particles are at greater risk for atherosclerosis than patients with large LDL particles, all things equal.
- “A particle is a particle is a particle.” If you don’t know the number, you don’t know the risk.
- To address this question, however, one must look at changes in cardiovascular events or direct markers of atherosclerosis (e.g., IMT) while holding LDL-P constant and then again holding LDL size constant. Only when you do this can you see that the relationship between size and event vanishes. The only thing that matters is the number of LDL particles – large, small, or mixed.
Concept #8 – Why is it necessary to measure LDL-P, instead of just LDL-C?
In the growing list of reasons why I used to refer to myself as “chick-repellant” in college, I have a confession to make: I find the topic of statistical concordance and discordance to be so exciting, I sometimes have a hard time containing myself. This may explain the paucity of girlfriends in college. Let me use an example to illustrate the distinction between these terms. Let’s say you want to predict the change in home prices in the following year (I used to model this for a living). There are at least a dozen parameters linked to this, including: GDP growth, unemployment, interest rates (both short term and long term, though to different degrees), housing inventory (i.e., how many houses are on the market), housing absorption (i.e., how quickly houses go from being on the market to being sold), major stock indices, and consumer confidence. Historically, from the mid-1990’s until about the fourth quarter of 2006, this worked like clockwork. While each of these variables had differing strengths of predicting changes in home prices, they all moved together. For example, when GDP growth was robust, unemployment was low, interest rates were modest, housing inventories were about 60 to 90 days, etcetera. All of these variables pointed to a predictable change in home values.
Around Q42006 (i.e., last 3 months of 2006), one of these variables began to deviate from the others. The details aren’t important, but the point is one variable began to suggest home prices would fall while the others all pointed to a continued rise. Prior to Q42006 these parameters were said to be concordant – they all predicted the same thing – either up or down. By 2007, they became discordant – one variable said the sky was falling while others said everything was fine.
This was true on the “micro” level, too. [What I described above is called “macro” level.] As a lender, it should be very important to know the risk of each and every loan you make (clearly this was part of the root problem in the age of mass securitization). Will this person pay the loan back or will they default?
Same game here, but now a new set of even greater variables. As a lender, if I want to know if YOU will default, I will want to know a lot of things about you, such as your agency credit risk scores, your bank account activity, payroll activity, how much you’re borrowing relative to the value of your house, where your house is located, and about 50 other things (literally).
Not surprisingly, the same thing that happened on the macro side happened on the micro side. It became difficult to predict who would default and would not default because there were so many variables to consider and lenders didn’t know which ones were still predictive. The models that predict default are very sensitive to the balance of these inputs. When all of the variables are concordant, their accuracy is prophetic, as was the case from the mid-1990s until late 2006. When some variables become discordant with each other, especially variables that were historically concordant with each other, really bad stuff happens, as became evident to me, personally, one Thursday afternoon in November 2007. It became clear the sky was about to fall. And, of course, it did.
What does real estate have to do with atherosclerosis?
Fortunately, predicting heart disease is a little easier than predicting changes in home prices. It’s not perfect, of course, but it’s pretty good. Why is it not perfect? For one thing, we can’t do the “perfect” experiment. The “perfect” experiment would look something like this:
Take 100,000 people and randomize them into four matched groups, A, B, C, and D. Wave a magic wand (you can see why this experiment hasn’t been and won’t be done) and give the folks in Group A an LDL particle concentration of, say, 700 nmol/L; those in Group B you give 1,200 nmol/L; those in Group C you give 1,600 nmol/L; and those in Group D get 2,000 nmol/L.
In our dream world, due to the randomization process, these four groups would be statistically identical in every way except one – they would, thanks to our magic wand, have a different number of LDL particles. We would follow them without further intervention for 10 years and then compare their rates of heart disease, stroke, and death.
There are some areas in medicine where we can do such experiments. But, we can’t do this experiment for this question. Even when we do the next best thing — give people a drug that lowers their LDL-P and measure the impact of this intervention — there is always a chance we’ve done something in addition to “just” lowering LDL-P. If you’ve been reading this series, you no doubt know my thoughts on this: while other factors are likely to be involved the pathogenesis of atherosclerosis (e.g., endothelial “health”, normal versus abnormal inflammatory response) the primary driver of atherosclerosis is the number of apoB trafficking lipoproteins in circulation, of which LDL particles are the vast majority.
The data below should further clarify this association.
What do concordant LDL-C and LDL-P values look like?
Among the two largest studies tracking the association between cholesterol and atherosclerotic mortality are the Framingham study and the MESA trial (the two largest trials were AMORIS and INTERHEART). The figure below, which I’ve graciously borrowed from Jim Otvos, shows the risk stratification of LDL-C (top) and LDL-P (bottom) from the Framingham study and MESA trial, respectively. As you can see, conveniently, LDL-C values in mg/dL are about 10x off from LDL-P values in nmol/L. In other words, in the Framingham population, the 20th percentile value of LDL-C was 100 mg/dL, while the MESA trial found the 20th percentile of the population to have an LDL-P concentration of 1,000 nmol/L. As you will see by the end of this post, this “rule of the thumb” should never be used to infer LDL-P from LDL-C.
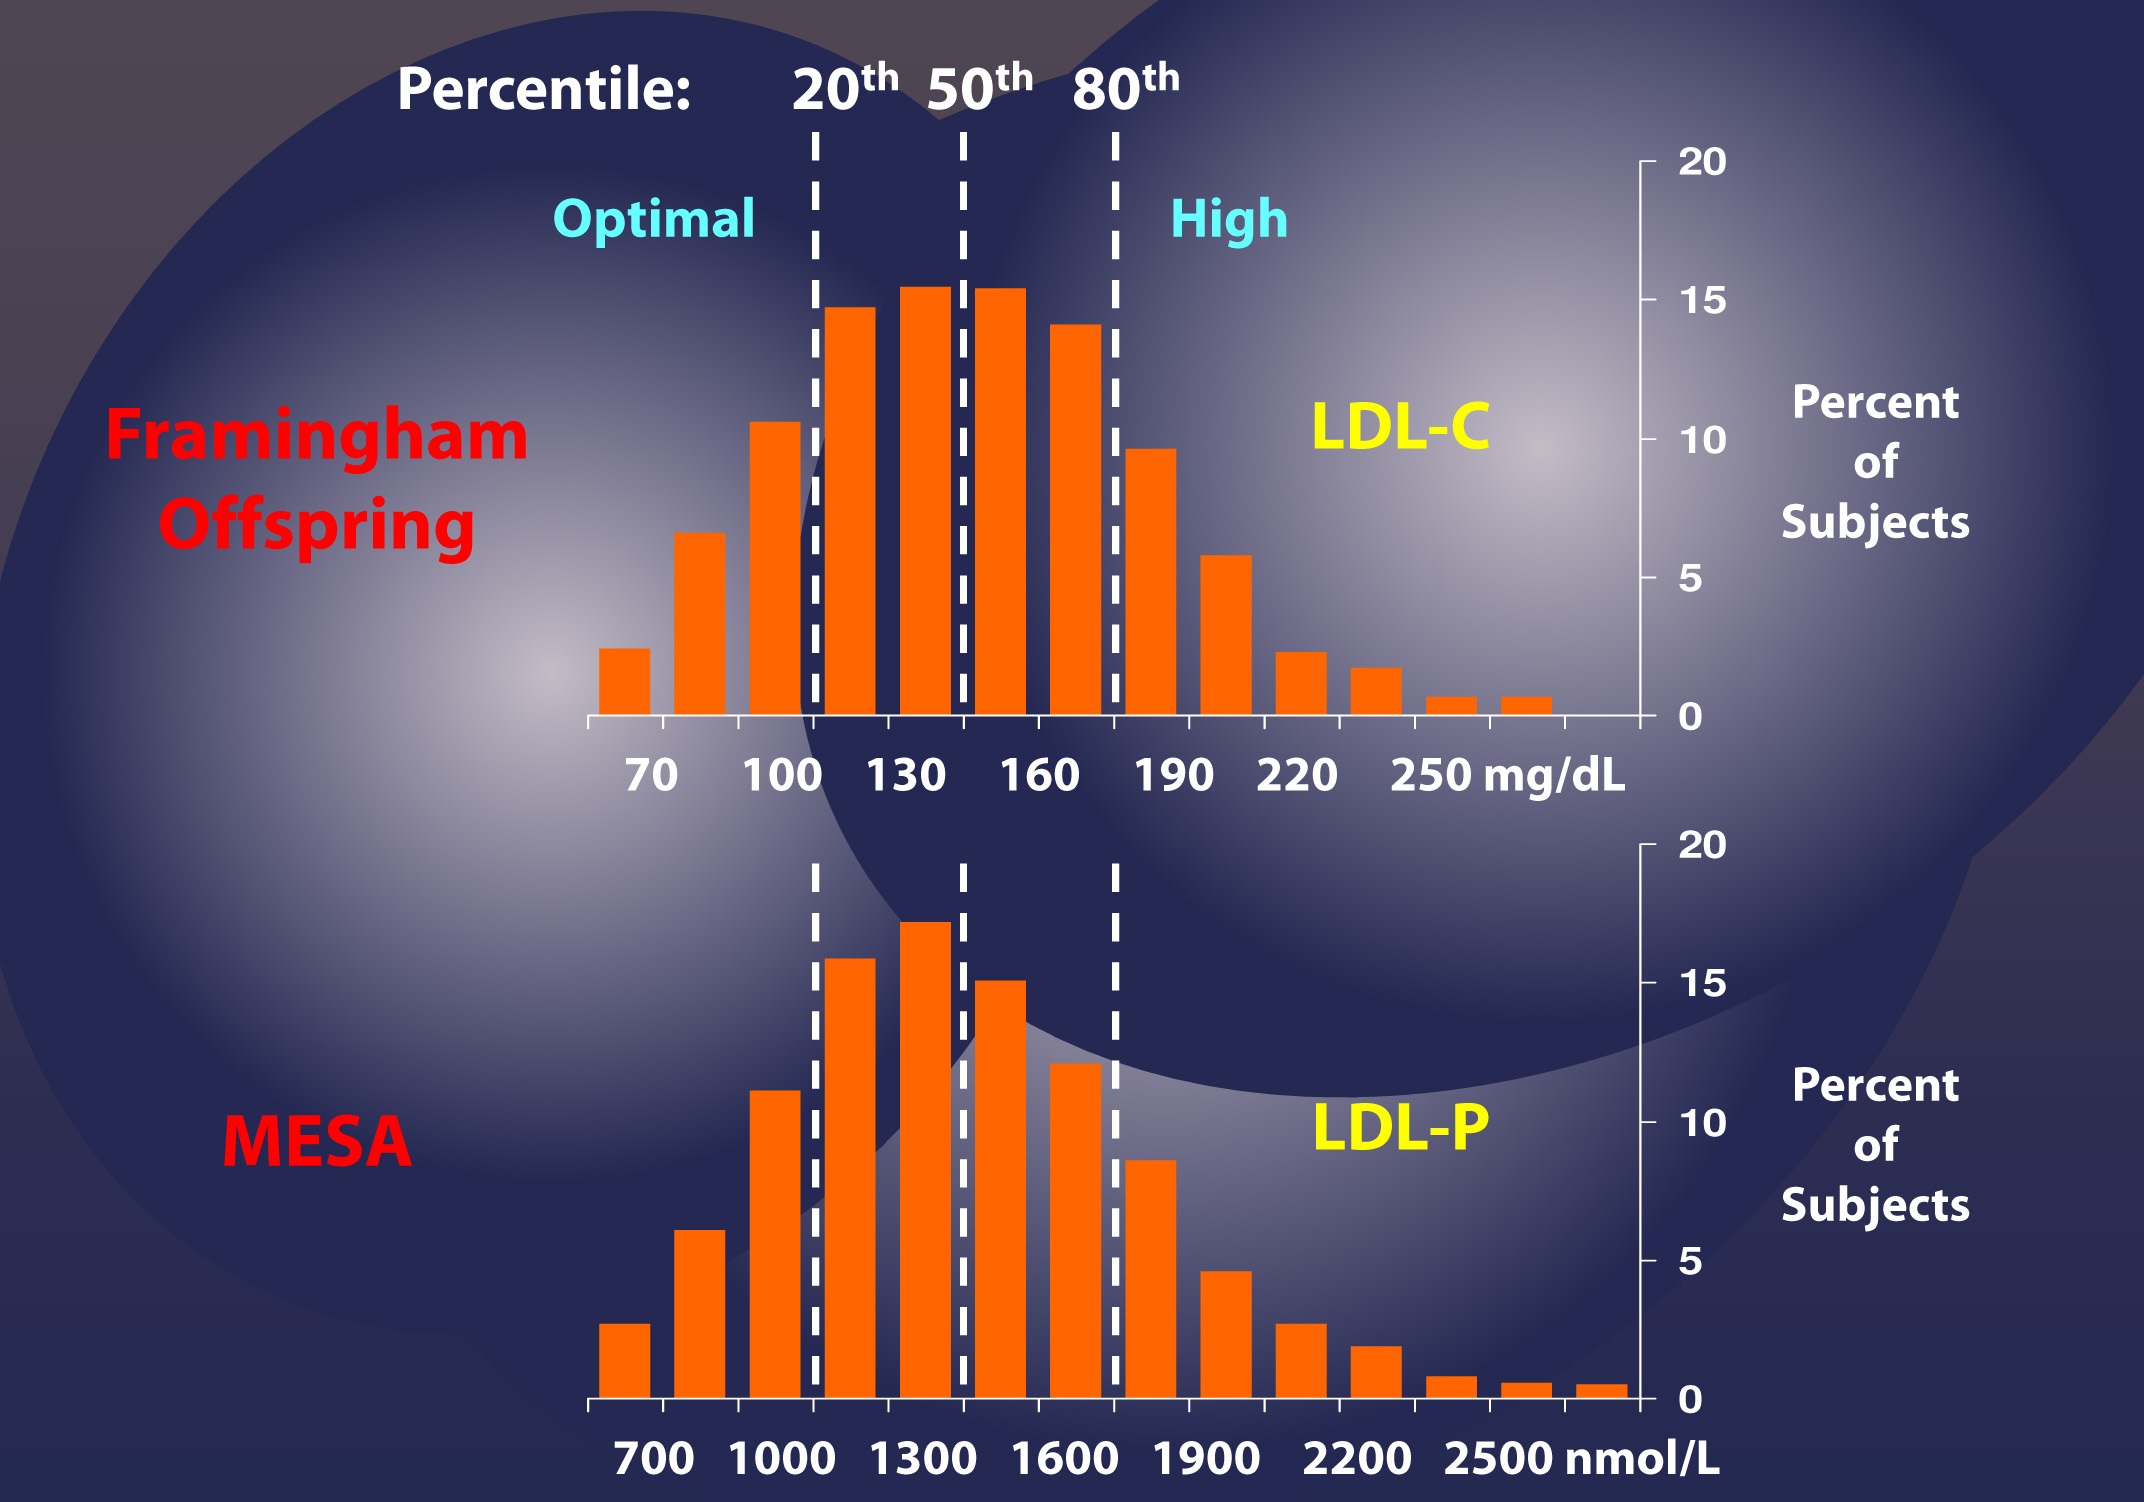
If this were always the case – that is, if LDL-C and LDL-P were always concordant – we could conclude that LDL-C and LDL-P would be of equal value in predicting heart disease. Obviously this is not the case, or I wouldn’t be making such a fuss over the distinction. But how bad is it?
What do discordant LDL-C and LDL-P values look like?
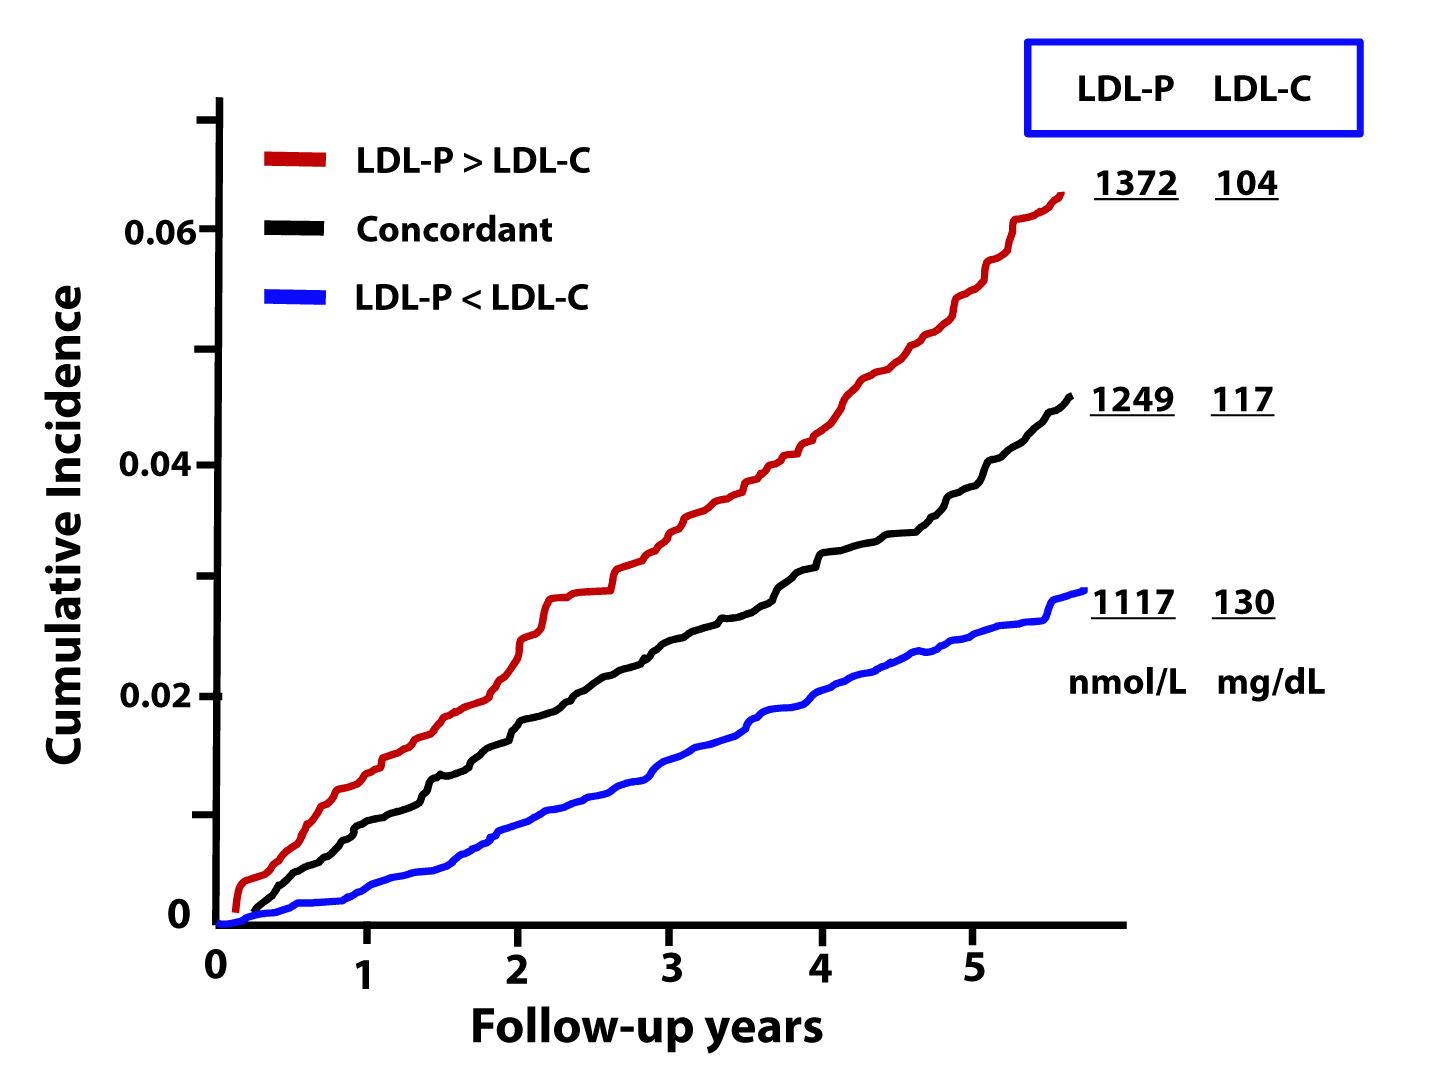
The figure below, from the Journal of Clinical Lipidology, shows the cumulative incidence of cardiovascular events (e.g., myocardial infarction, death) over time in three sub-populations:
- Those with concordant LDL-P and LDL-C (black line);
- Those with discordant LDL-P and LDL-C (LDL-P>LDL-C, shown by the red line);
- Those with discordant LDL-P and LDL-C (LDL-P<LDL-C, shown by the blue line).
This analysis was done using a Cox proportional hazard model and was adjusted for age, sex, and race. The steeper the line the more people in that sub-population died or experienced adverse cardiac events relative to other sub-populations. In other words, the folks in the red group had the worst outcomes, followed by the folks in the black group, followed by the folks in the blue group.
What can we infer from these data?
First, we confirm what I alluded to above. Namely, that a non-zero percent of the population do not have LDL-C and LDL-P values that predict the same level of risk. However, and perhaps more importantly, we get another look at an important theme of this series: LDL-P is driving atherosclerotic risk, not LDL-C. If LDL-P and LDL-C were equally “bad” – even when discordant – you would expect the blue line to be as steep as the red line (and both to be steeper than the black line). But this is not the case.
Let’s look at these data parsed out another way. Below we see the four possible subgroups, from the top:
- Not low LDL-P, low LDL-C (red line);
- Not low LDL-P, not low LDL-C (yellow line);
- Low LDL-P, low LDL-C (black line); and
- Low LDL-P, not low LDL-C (blue line).
Note that “low” is defined below the 30th percentile and “not low” is defined as greater than 30th percentile for each variable. This figure is even more revealing than the one above. Again, it demonstrates the frequency of discordance (about 20% in this population with these cut-off points), and it shows the importance of LDL-P’s predictive power, relative to that of LDL-C.
In fact, though not statistically significant, the highest risk group has high LDL-P and actually has low LDL-C (I’ll give you a hint of why, below) while the lowest risk group has low LDL-P and not-low LDL-C. *This is not a typo.

The highest risk and lowest risk groups are those with discordant LDL-C and LDL-P. The high risk group has high LDL-P and low LDL-C, while the lowest risk group has high LDL-C with low LDL-P. Only a minority of physicians would know that there is a segment of the population with elevated LDL-C who are at low risk! The same conclusion will be drawn from the next study.
Let’s look at an even longer-term follow up study, below. This study followed a Framingham offspring cohort of about 2,500 patients over a median time period of almost 15 years in each of the four possible groups (i.e., high-high, high-low, low-high, and low-low) and tracked event-free survival. In this analysis the cut-off points for LDL-P and LDL-C were the median population values of 1,414 nmol/L and131 mg/dL, respectively. So “high” implies above these values; “low” implies below these values. Kaplan-Meier survival curves are displayed over a 16 year period – the steeper the slope of the line the worse the outcome (survival).
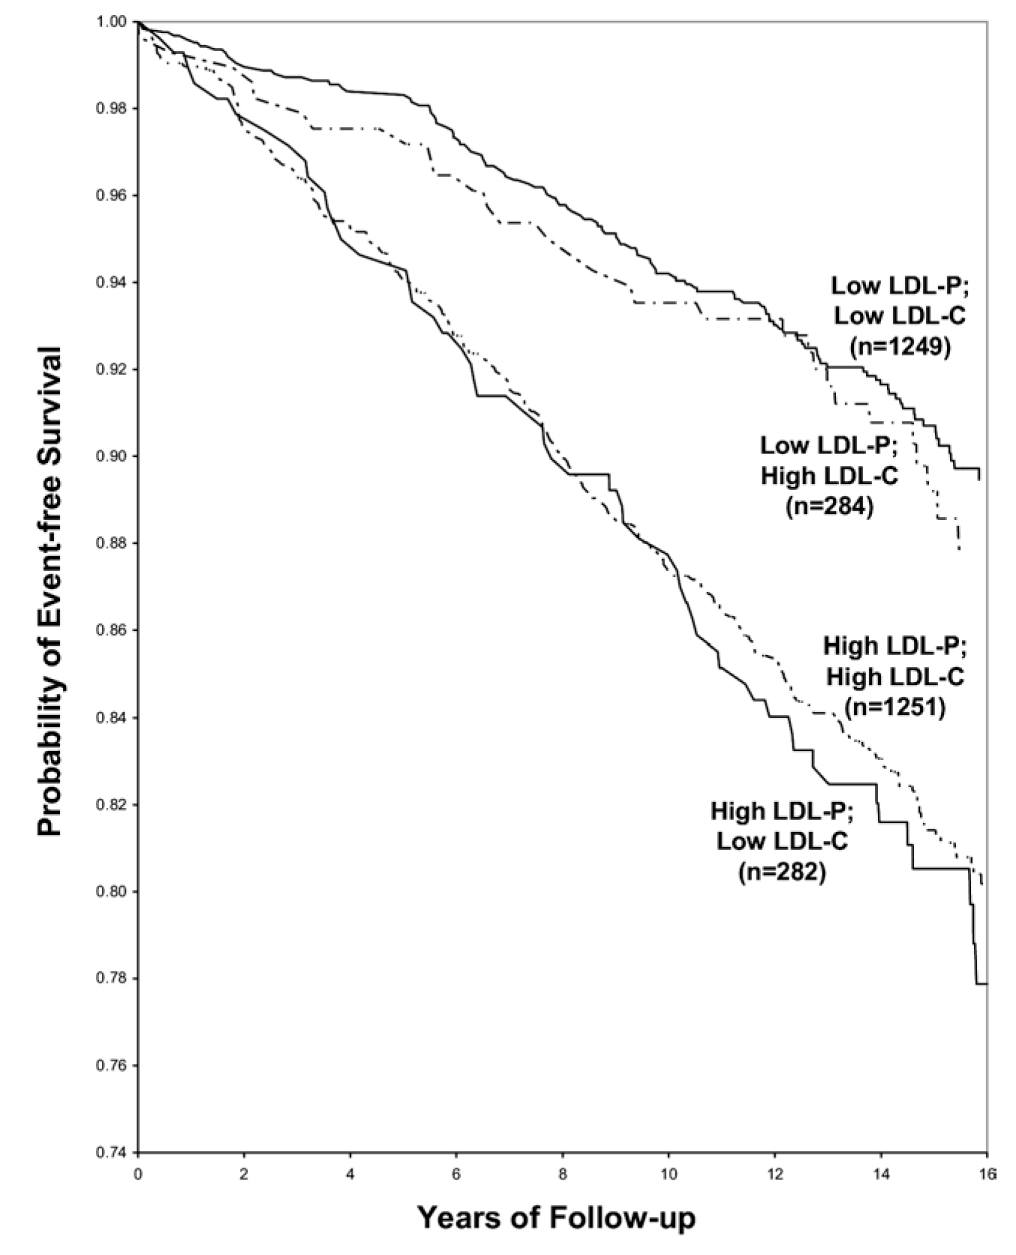
The same patterns are observed:
- LDL-P is the best predictor of adverse cardiac events.
- LDL-C is only a good predictor of adverse cardiac events when it is concordant with LDL-P; otherwise it is a poor predictor of risk.
Amazingly the persons with the worst survival had low (below median) LDL-C but high LDL-P. The patients most likely to have high LDL-P with unremarkable or low LDL-C are those with either small LDL particles, or TG-rich / cholesterol poor LDL particles, or both (e.g., insulin resistant patients, metabolic syndrome patients, T2DM patients). This explains why small LDL particles, while no more atherogenic on a per particle basis than large particles, are a marker for something sinister.
Populations where LDL-P and LDL-C discordance are even more prevalent
As I described above, the discordance between LDL-P and LDL-C is exacerbated in patients with metabolic syndrome. The figure below, MESA data, again borrowed from Jim Otvos, presents this difference in an elegant way. The horizontal axes show LDL-P concentration in the usual units, nmol/L.
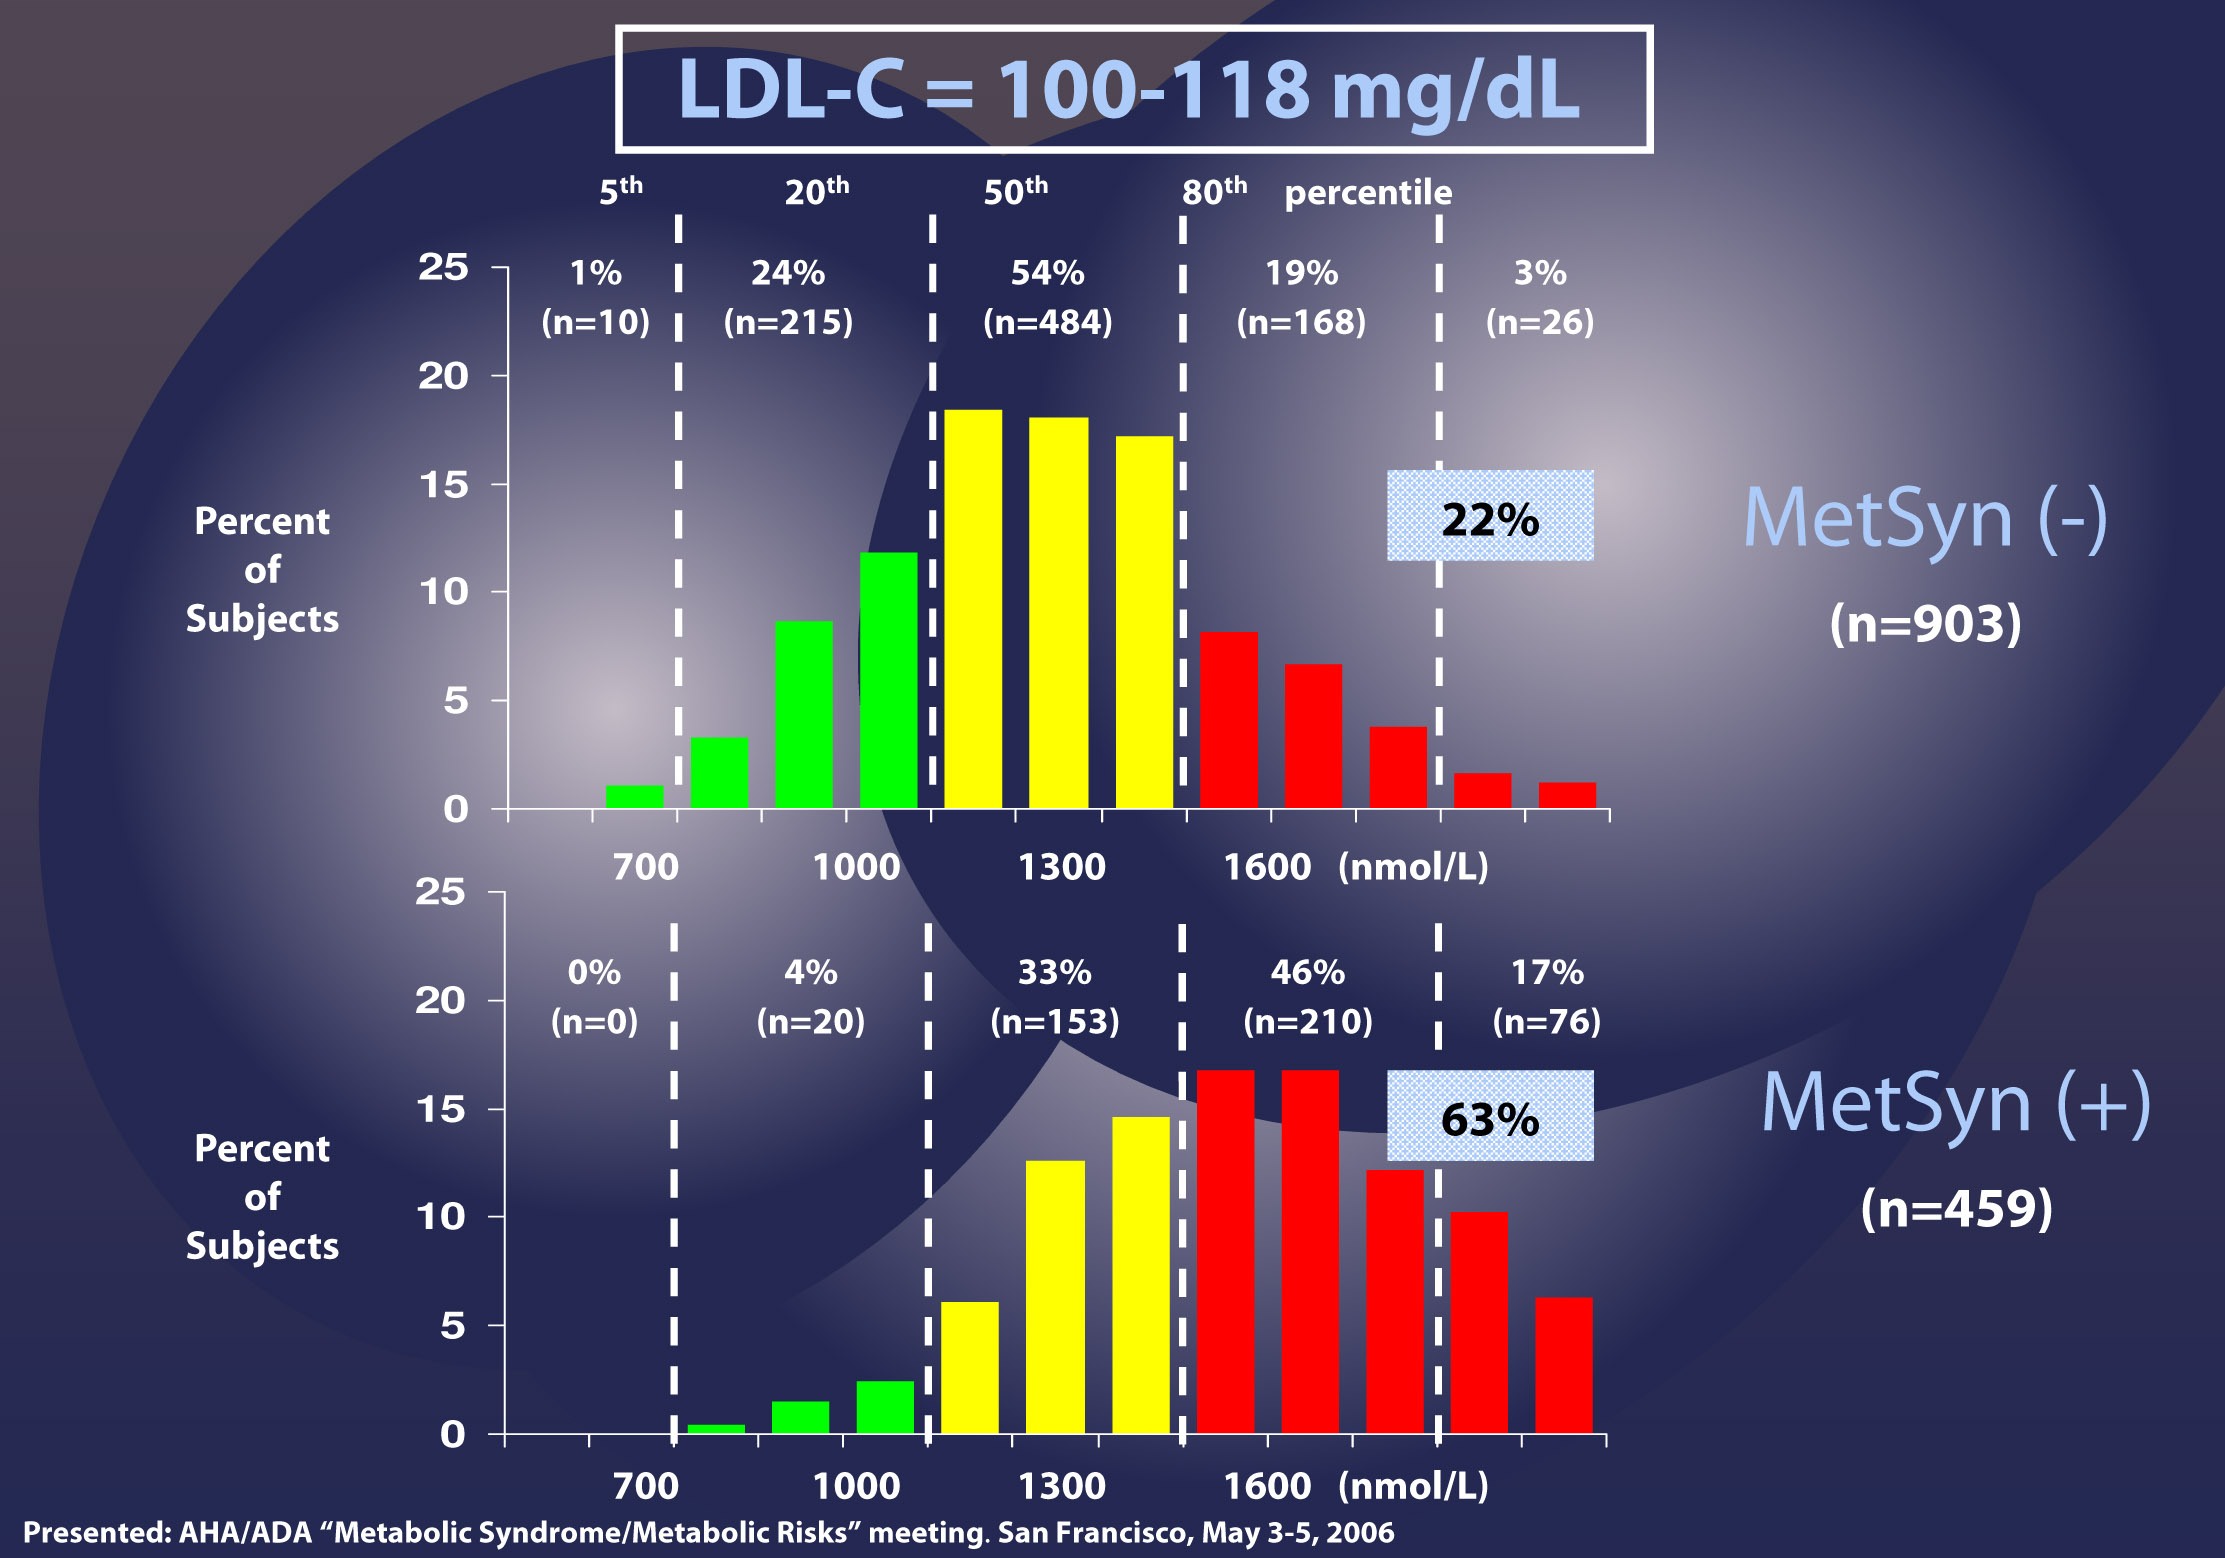
Patients with LDL-C between 100 and 118 mg/dL (i.e., second quartile of risk: 25th to 50th percentile) are shown without metabolic syndrome (top) and with metabolic syndrome (bottom). In the patients without metabolic syndrome, LDL-C under-predicts cardiac risk 22% of the time, consistent with the population data I have shown you earlier. However, when you look at the patients with metabolic syndrome, you can see that 63% of the time their risk of cardiac disease is under-predicted. Again, not a typo.
There are so many subsets and cut-off points that I could devote ten more posts to showing you every one of these analyses. Let me finish this point with the most recent, hot-off-the-press (actually, still in press in the American Journal of Cardiology, though you can get a preprint here) analysis of which Tom Dayspring is one of the authors.
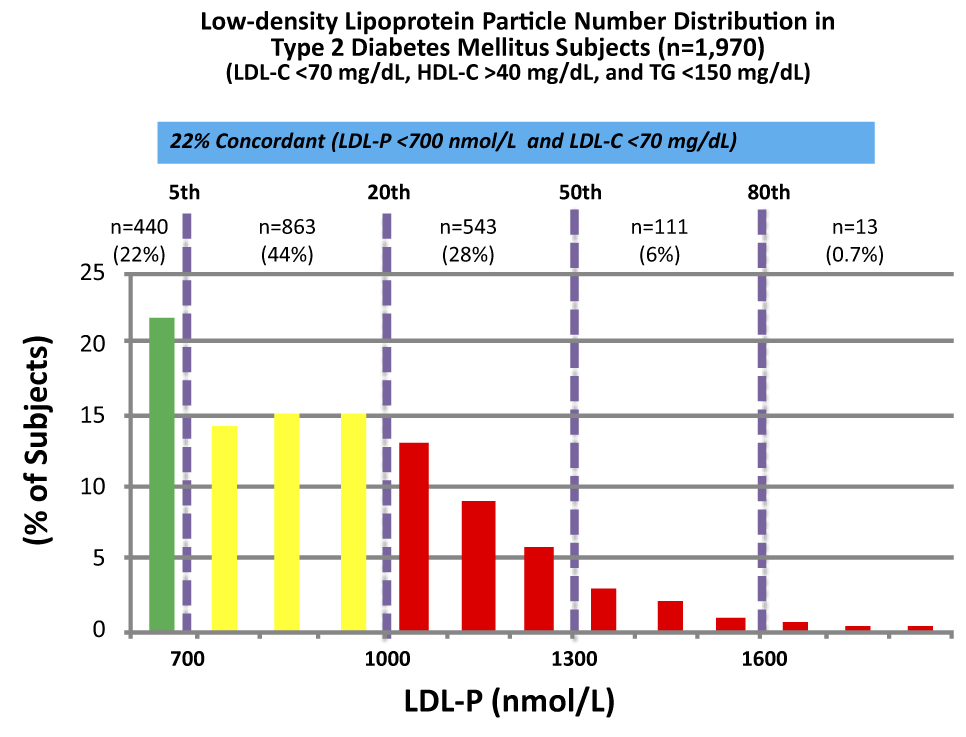
These data were collected from nearly 2,000 patients with diabetes who presented with “perfect” standard cholesterol numbers: LDL-C < 70 mg/dL; HDL-C > 40 mg/dL; TG <150 mg/dL. However, only in 22% of cases were their LDL-P concordant with LDL-C. That is, in only 22% of cases did these patients have an LDL-P level below 700 nmol/L.
Remember, LDL-C < 70 mg/dL is considered VERY low risk – the 5th percentile. Yet, by LDL-P, the real marker of risk, 35% of these patients had more than 1,000 nmol/L and 7% were high risk. When you do this analysis with the same group of patients stratified by less stringent LDL-C criteria (e.g., <100 mg/dL) the number of patients in the high risk group is even higher.
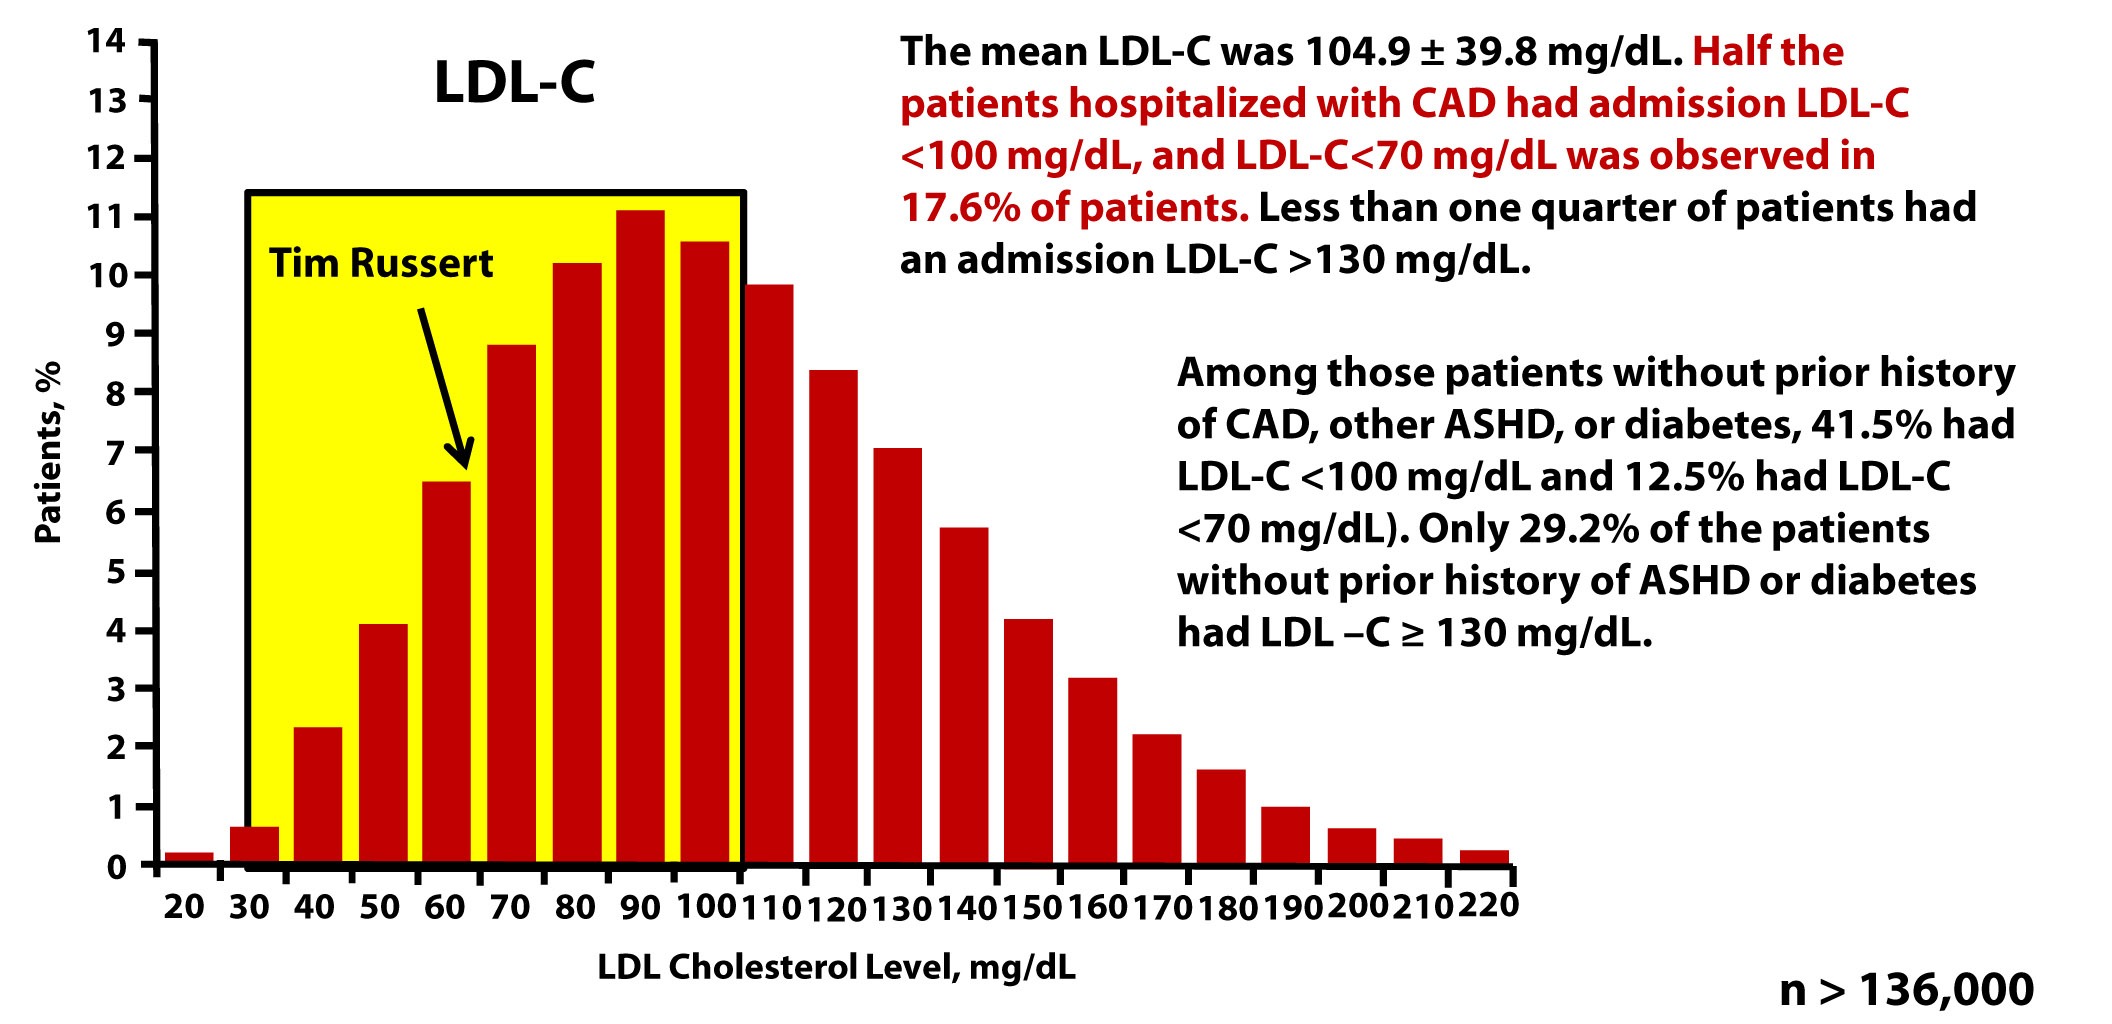
The real world tragedy: 90-95% of physicians, including cardiologists, would bet their own lives that persons with an LDL-C < 70 mg/dL have no atherosclerotic risk.
Tim Russert, shortly before his death, had his LDL-C level checked. It was less than 70 mg/dL. Sadly, his doctors didn’t realize they should also have been checking his LDL-P or apoB. The figure below, which is from one of Tom Dayspring’s presentations, shows data from this study of nearly 137,000 patients hospitalized for coronary artery disease between 2000 and 2006. As you can see, LDL-C fails to even reasonably predict cardiovascular disease in a patient population sick enough to show up in the hospital with chest pain or outright myocardial infarction.
Why are LDL-C and LDL-P so often discordant?
Think back to what you learned in a previous post in this series. LDL particles traffic not only cholesterol ester but also triglycerides. Each and every LDL particle has a variable number of cholesterol molecules which, because of constant particle remodeling, is constantly changing. In other words, of the several quadrillion LDL particles floating in your plasma, no two are carrying the exact same number of cholesterol molecules. It takes many more cholesterol-depleted LDL particles than cholesterol-rich LDL particles to traffic a given cholesterol mass (i.e., number of cholesterol molecules) per volume of plasma (i.e., per dL). Core cholesterol mass is related to both LDL particle size (the volume of a sphere is a third power of the radius — it can take 40-70% more small particles than large LDL particles to traffic a given cholesterol mass) and the number of TG molecules per LDL particle.
TG molecules are larger than cholesterol ester molecules, so as the number of TG molecules per particle increases, the number of cholesterol molecules will be less – in a very non-linear manner. Regardless of size it takes many more TG-rich LDL particles (which are necessarily cholesterol-depleted) to traffic a given cholesterol mass than TG-poor LDL particles. The persons with the highest LDL particles typically (though not always) have small LDL particles that are TG-rich. These are incredibly cholesterol-depleted LDL particles.
Summary
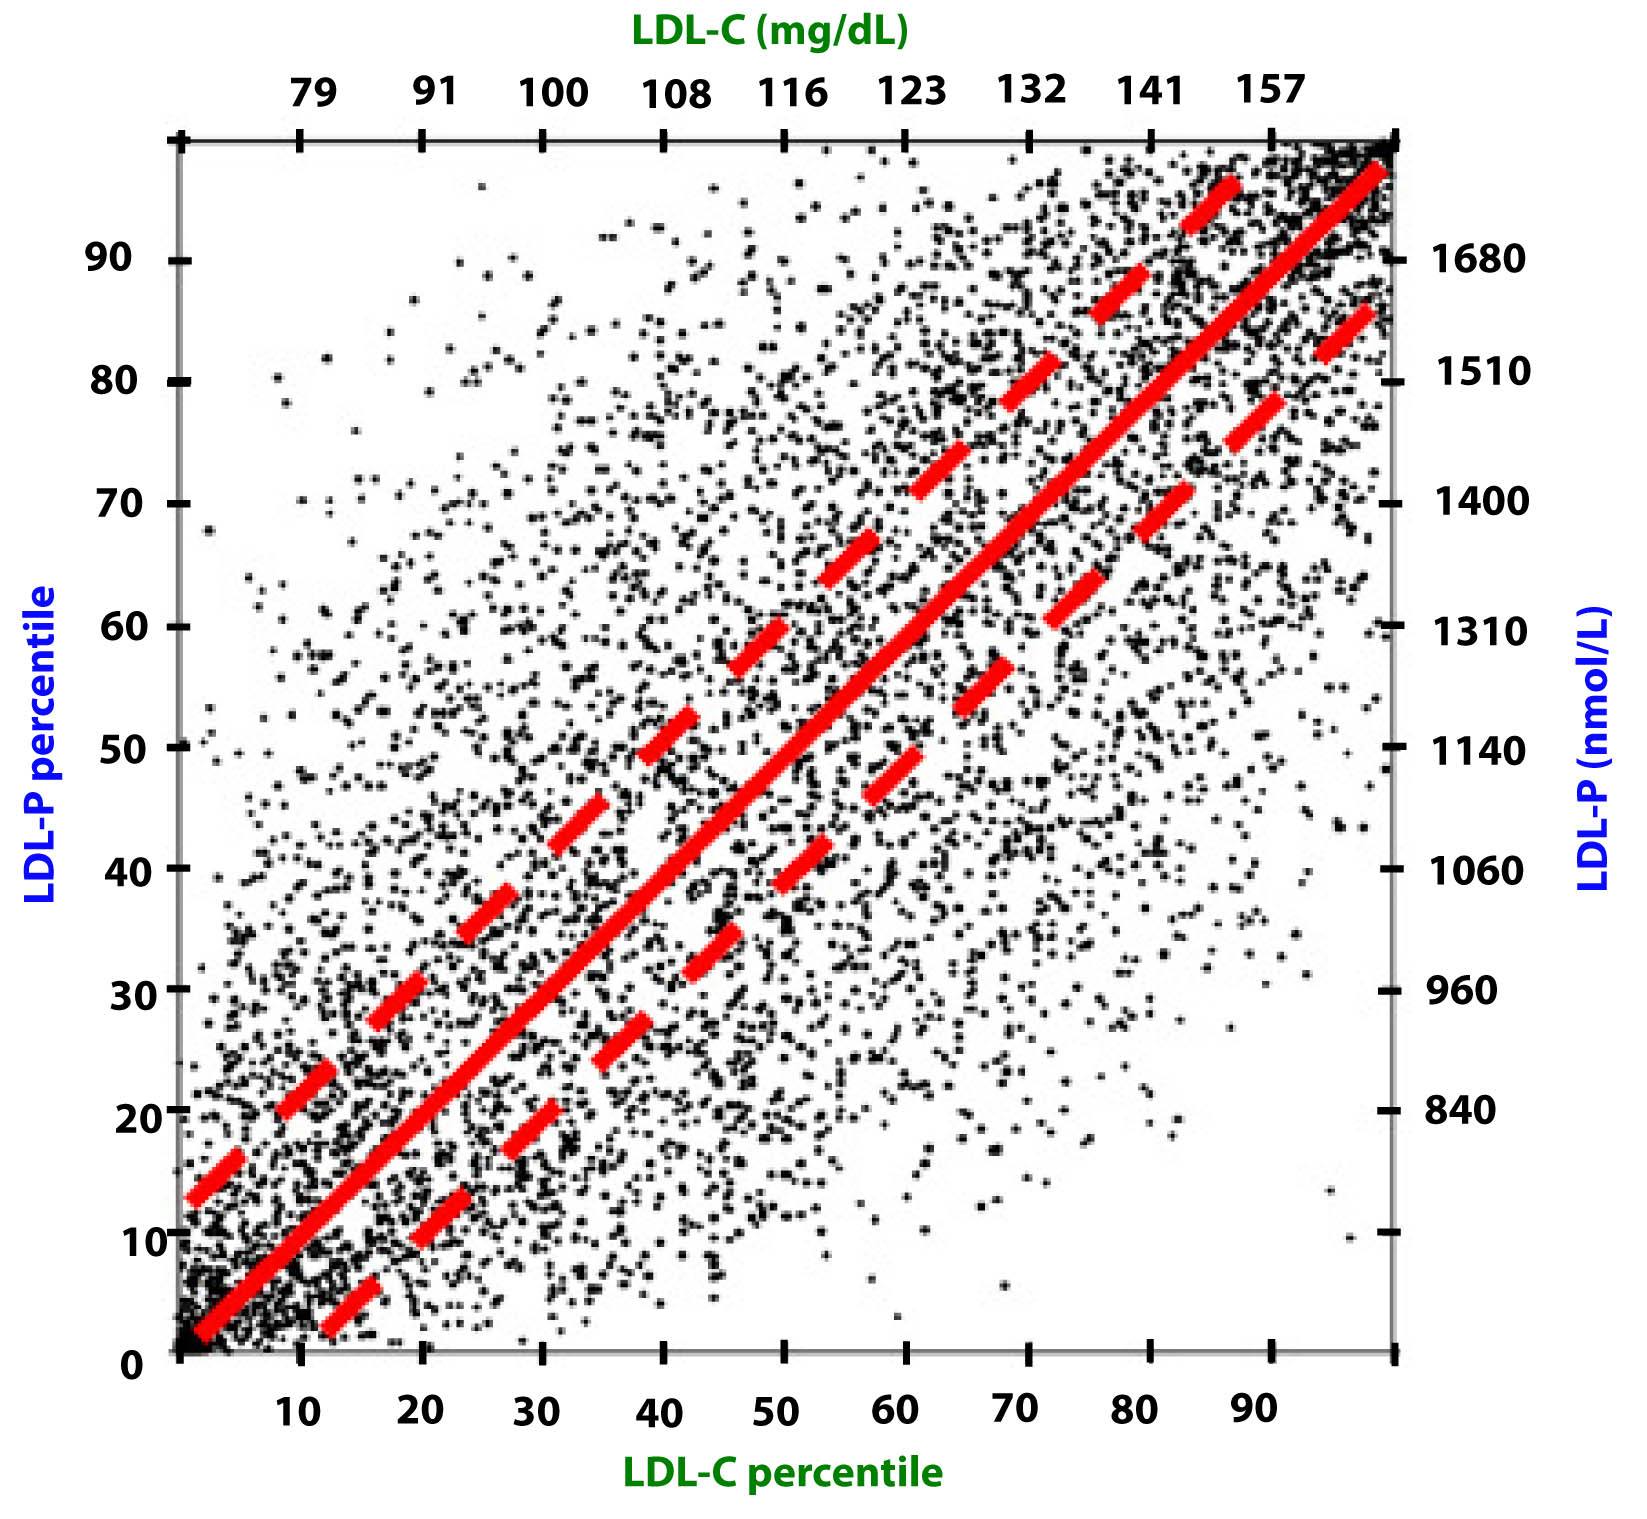
Take a look at this figure below from the 2011 Otvos et al. paper I referenced above. It’s a scatterplot of each data point (i.e., patient) in the study. The solid red line shows perfect concordance between LDL-P and LDL-C. The dashed red lines show a +/- 12% margin on each side. Look at how many dots (remember: each dot represents a person) lie OUTSIDE of the dashed red lines. Now look again.
When people argue with me about why it’s unnecessary to check LDL-P or apoB because it’s much easier and cheaper to check LDL-C, I like to remind them of what Clint Eastwood would probably say in such a situation: “You’ve got to ask yourself one question: Do I feel lucky? Well, do ya, punk?”
- With respect to laboratory medicine, two markers that have a high correlation with a given outcome are concordant – they equally predict the same outcome. However, when the two tests do not correlate with each other they are said to be discordant.
- LDL-P (or apoB) is the best predictor of adverse cardiac events, which has been documented repeatedly in every major cardiovascular risk study.
- LDL-C is only a good predictor of adverse cardiac events when it is concordant with LDL-P; otherwise it is a poor predictor of risk.
- There is no way of determining which individual patient may have discordant LDL-C and LDL-P without measuring both markers.
- Discordance between LDL-C and LDL-P is even greater in populations with metabolic syndrome, including patients with diabetes. Given the ubiquity of these conditions in the U.S. population, and the special risk such patients carry for cardiovascular disease, it is difficult to justify use of LDL-C, HDL-C, and TG alone for risk stratification in all but the most select patients.
- This raises the question: if indeed LDL-P is always as good and in most cases better than LDL-C at predicting cardiovascular risk, why do we continue to measure (or calculate) LDL-C at all?
Photo by Aldric RIVAT on Unsplash


320 Comments