
Want to catch up with other articles from this series?
- The straight dope on cholesterol – Part I
- The straight dope on cholesterol – Part II
- The straight dope on cholesterol – Part III
- The straight dope on cholesterol – Part IV
- The straight dope on cholesterol – Part V
- The straight dope on cholesterol – Part VI
- The straight dope on cholesterol – Part VII
- The straight dope on cholesterol – Part VIII
- The straight dope on cholesterol – Part IX
Previously, across 8 parts of this series we’ve laid the groundwork to ask perhaps the most important question of all:
What should you eat to have the greatest chance of delaying the arrival of cardiovascular disease?
Before we get there, since this series has been longer and more detailed than any of us may have wanted, it is probably worth reviewing the summary points from the previous posts in this series (or you can just skip this and jump to the meat of this post).
What we’ve learned so far
- Cholesterol is “just” another fancy organic molecule in our body but with an interesting distinction: we eat it, we make it, we store it, and we excrete it – all in different amounts.
- The pool of cholesterol in our body is essential for life. No cholesterol = no life.
- Cholesterol exists in 2 forms – unesterified or “free” (UC) and esterified (CE) – and the form determines if we can absorb it or not, or store it or not (among other things).
- Much of the cholesterol we eat is in the form of CE. It is not absorbed and is excreted by our gut (i.e., leaves our body in stool). The reason this occurs is that CE not only has to be de-esterified, but it competes for absorption with the vastly larger amounts of UC supplied by the biliary route.
- Re-absorption of the cholesterol we synthesize in our body (i.e., endogenous produced cholesterol) is the dominant source of the cholesterol in our body. That is, most of the cholesterol in our body was made by our body.
- The process of regulating cholesterol is very complex and multifaceted with multiple layers of control. I’ve only touched on the absorption side, but the synthesis side is also complex and highly regulated. You will discover that synthesis and absorption are very interrelated.
- Eating cholesterol has very little impact on the cholesterol levels in your body. This is a fact, not my opinion. Anyone who tells you different is, at best, ignorant of this topic. At worst, they are a deliberate charlatan. Years ago the Canadian Guidelines removed the limitation of dietary cholesterol. The rest of the world, especially the United States, needs to catch up. To see an important reference on this topic, please look here.
- Cholesterol and triglycerides are not soluble in plasma (i.e., they can’t dissolve in water) and are therefore said to be hydrophobic.
- To be carried anywhere in our body, say from your liver to your coronary artery, they need to be carried by a special protein-wrapped transport vessel called a lipoprotein.
- As these “ships” called lipoproteins leave the liver they undergo a process of maturation where they shed much of their triglyceride “cargo” in the form of free fatty acid, and doing so makes them smaller and richer in cholesterol.
- Special proteins, apoproteins, play an important role in moving lipoproteins around the body and facilitating their interactions with other cells. The most important of these are the apoB class, residing on VLDL, IDL, and LDL particles, and the apoA-I class, residing for the most part on the HDL particles.
- Cholesterol transport in plasma occurs in both directions, from the liver and small intestine towards the periphery and back to the liver and small intestine (the “gut”).
- The major function of the apoB-containing particles is to traffic energy (triglycerides) to muscles and phospholipids to all cells. Their cholesterol is trafficked back to the liver. The apoA-I containing particles traffic cholesterol to steroidogenic tissues, adipocytes (a storage organ for cholesterol ester) and ultimately back to the liver, gut, or steroidogenic tissue.
- All lipoproteins are part of the human lipid transportation system and work harmoniously together to efficiently traffic lipids. As you are probably starting to appreciate, the trafficking pattern is highly complex and the lipoproteins constantly exchange their core and surface lipids.
- The measurement of cholesterol has undergone a dramatic evolution over the past 70 years with technology at the heart of the advance.
- Currently, most people in the United States (and the world for that matter) undergo a “standard” lipid panel, which only directly measures TC, TG, and HDL-C. LDL-C is measured or most often estimated.
- More advanced cholesterol measuring tests do exist to directly measure LDL-C (though none are standardized), along with the cholesterol content of other lipoproteins (e.g., VLDL, IDL) or lipoprotein subparticles.
- The most frequently used and guideline-recommended test that can count the number of LDL particles is either apolipoprotein B or LDL-P NMR, which is part of the NMR LipoProfile. NMR can also measure the size of LDL and other lipoprotein particles, which is valuable for predicting insulin resistance in drug naïve patients, before changes are noted in glucose or insulin levels.
- The progression from a completely normal artery to a “clogged” or atherosclerotic one follows a very clear path: an apoB containing particle gets past the endothelial layer into the subendothelial space, the particle and its cholesterol content is retained, immune cells arrive, an inflammatory response ensues “fixing” the apoB containing particles in place AND making more space for more of them.
- While inflammation plays a key role in this process, it’s the penetration of the endothelium and retention within the endothelium that drive the process.
- The most common apoB containing lipoprotein in this process is certainly the LDL particle. However, Lp(a) and apoB containing lipoproteins play a role also, especially in the insulin resistant person.
- If you want to stop atherosclerosis, you must lower the LDL particle number. Period.
- At first glance it would seem that patients with smaller LDL particles are at greater risk for atherosclerosis than patients with large LDL particles, all things equal.
- “A particle is a particle is a particle.” If you don’t know the number, you don’t know the risk.
- With respect to laboratory medicine, two markers that have a high correlation with a given outcome are concordant – they equally predict the same outcome. However, when the two tests do not correlate with each other they are said to be discordant.
- LDL-P (or apoB) is the best predictor of adverse cardiac events, which has been documented repeatedly in every major cardiovascular risk study.
- LDL-C is only a good predictor of adverse cardiac events when it is concordant with LDL-P; otherwise it is a poor predictor of risk.
- There is no way of determining which individual patient may have discordant LDL-C and LDL-P without measuring both markers.
- Discordance between LDL-C and LDL-P is even greater in populations with metabolic syndrome, including patients with diabetes. Given the ubiquity of these conditions in the U.S. population, and the special risk such patients carry for cardiovascular disease, it is difficult to justify use of LDL-C, HDL-C, and TG alone for risk stratification in all but the most select patients.
- To address this question, however, one must look at changes in cardiovascular events or direct markers of atherosclerosis (e.g., IMT) while holding LDL-P constant and then again holding LDL size constant. Only when you do this can you see that the relationship between size and event vanishes. The only thing that matters is the number of LDL particles – large, small, or mixed.
- HDL-C and HDL-P are not measuring the same thing, just as LDL-C and LDL-P are not.
- Secondary to the total HDL-P, all things equal it seems smaller HDL particles are more protective than large ones.
- As HDL-C levels rise, most often it is driven by a disproportionate rise in HDL size, not HDL-P.
- In the trials which were designed to prove that a drug that raised HDL-C would provide a reduction in cardiovascular events, no benefit occurred: estrogen studies (HERS, WHI), fibrate studies (FIELD, ACCORD), niacin studies, and CETP inhibition studies (dalcetrapib and torcetrapib). But, this says nothing of what happens when you raise HDL-P.
- Don’t believe the hype: HDL is important, and more HDL particles are better than few. But, raising HDL-C with a drug isn’t going to fix the problem. Making this even more complex is that HDL functionality is likely as important, or even more important, than HDL-P, but no such tests exist to “measure” this.
Did you say “delay?”
That’s right. The question posed above did not ask how one could “prevent” or eliminate the risk cardiovascular disease, it asked how one could “delay” it. There is a difference. To appreciate this distinction, it’s worth reading this recent publication by Allan Sniderman and colleagues. Allan sent me a copy of this paper ahead of publication a few months ago in response to a question I had posed to him over lunch one day. I asked,
“Allan, who has a greater 5-year risk for cardiovascular disease, a 25 year-old with a LDL-P/apoB in the 99th percentile or a 75-year-old with a LDL-P/apoB in the 5th percentile?”
The paper Allan wrote is noteworthy for at least 2 reasons:
- It’s an excellent reminder that age is a paramount risk factor for cardiovascular disease.
- It provides a much better (causal) model for atherosclerosis than the typical age-driven models, and explains why age is an important risk factor.
What do I mean by this? Most risk calculators (e.g., Framingham) take their inputs (e.g., age, gender, LDL-C, HDL-C, smoking, diabetes, blood pressure) and calculate a 10-year risk score. If you’ve ever played with these models you’ll quickly see that age drives risk more than any other input. But why? Is there something inherently “risky” about being older?
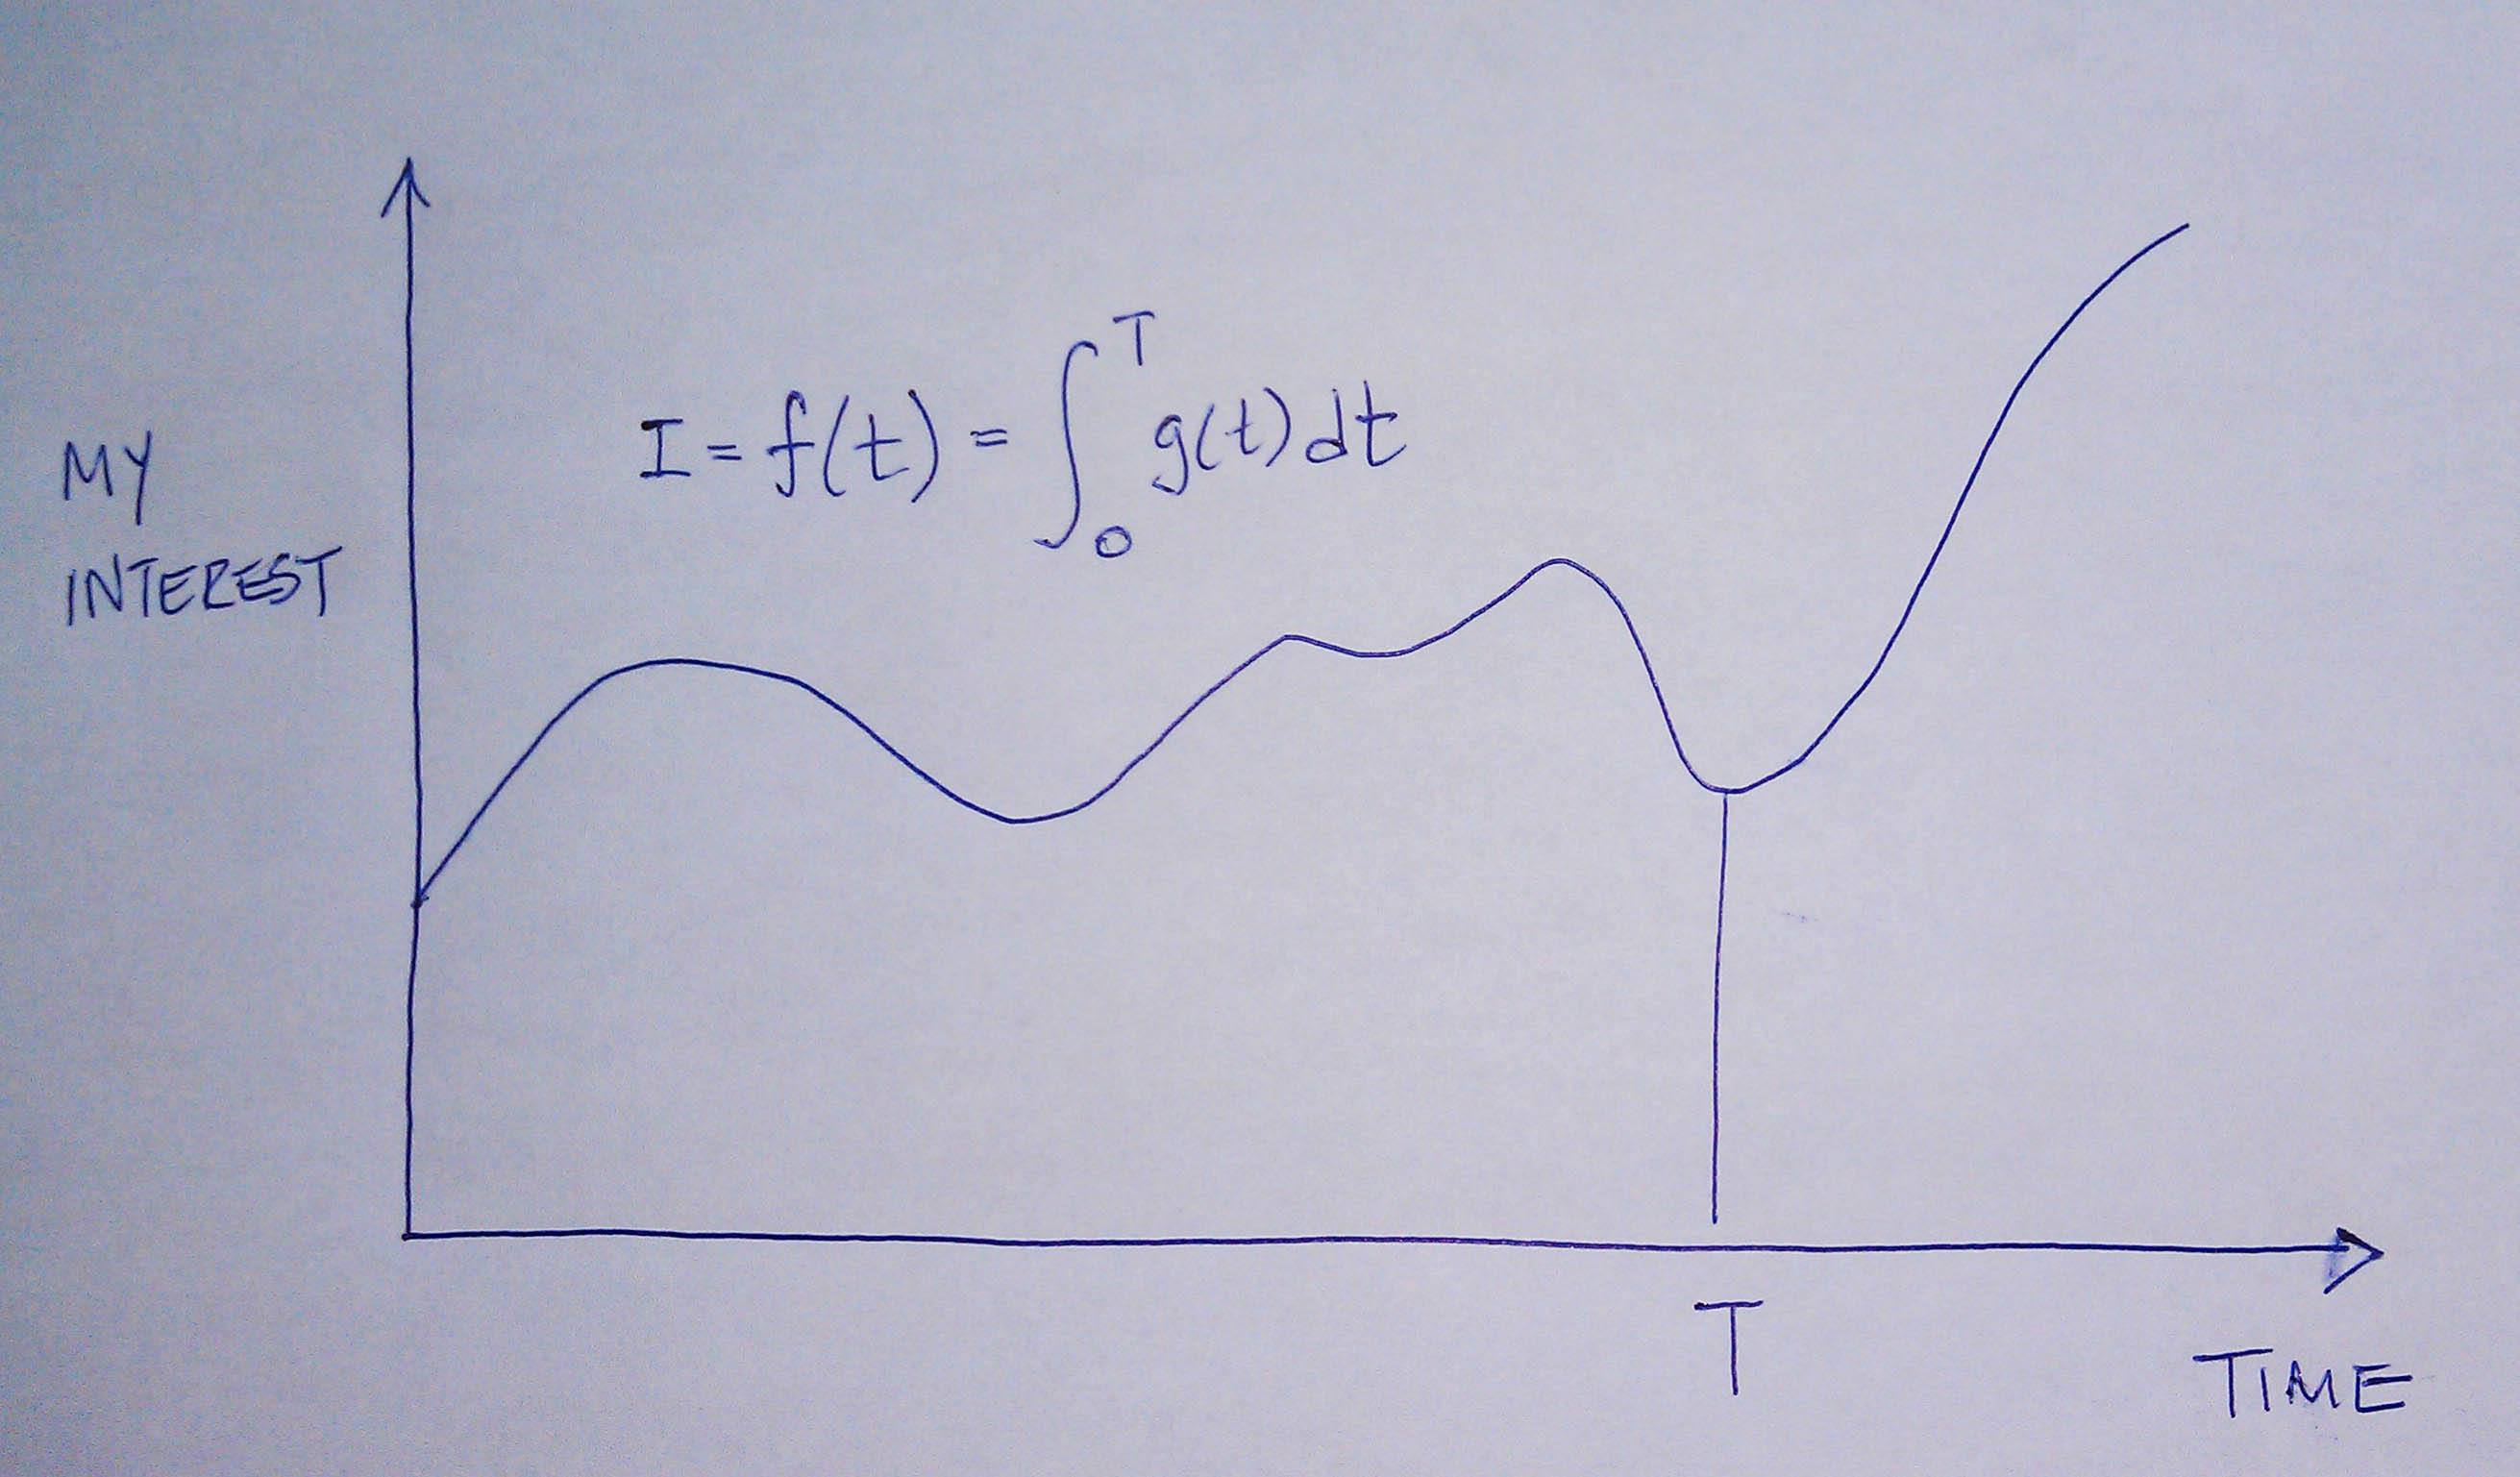
Sniderman and many others would argue (and I agree) that the reason age is a strong predictor of risk has to do with exposure to apoB particles — LDL, Lp(a), and apoB-carrying remnants. Maybe it’s because I’m a math geek, but such models just seem intuitive to me because I think of most things in life in terms of calculus, especially integrals, the “area under a curve.”
[I once tried to explain to a girlfriend who thought I wasn’t spending enough time with her that my interest in her should be thought of in terms of the area under the curve, rather than any single point in time. That is, think in terms of the integral function, not the point-in-time function. Needless to say, she broke up with me on the spot (in the middle of a parking lot!), despite me drawing a very cool picture illustrating the difference, which I’ve re-created, below.]
The reason age is such a big driver of risk is that the longer your artery walls are exposed to the insult of apoB particles, the more likely they are to be damaged, for all the reasons we covered in Part IV of this series. [This paper also reviews the clinical situation of PCSK9 mutations which builds a very compelling case for the causal model of apoB particles in the development of atherosclerosis].
What does eating have to do with cardiovascular risk?
So now that everyone is on the edge of their seat in anticipation of this punch-line, let me provide two important caveats.
First, there are no long-term studies – either in primary or secondary prevention – examining the exact question we all want to know the answer to with respect to the role of dietary intervention on cardiovascular disease. There are short-term studies, some of which I will highlight, which look at proxies for cardiovascular disease, but all of the long-term studies (looking at secondary prevention), are either drug studies or multiple intervention studies (e.g., cholesterol-lowering drug(s) + blood pressure reducing drug(s) + dietary intervention + exercise + …).
In other words, the “dream” study has not been done and won’t be done for a long time. The “dream” study would follow 2 randomized groups for many years and only make one change between the groups. Group 1 would consume a standard American diet and group 2 would consume a very-low carbohydrate diet. Furthermore, compliance within each group would be excellent (many ways to ensure this, but none of them are inexpensive – part of why this has not been done) and the study would be powered to detect “hard outcomes” (e.g., death), instead of just “soft outcomes” (e.g., changes in apoB, LDL-C, LDL-P, TG).
Second, everything we have learned to date on the risk relationship between cardiovascular disease and risk markers is predicated on the assumption that a risk maker of level X in a person on diet A is the same as it would be for a person on diet B.
Since virtually all of the thousands of subjects who have made up the dozens of studies that form the basis for our understanding on this topic were consuming some variant of the “standard American diet” (i.e., high-carb), it is quite possible that what we know about risk stratification is that this population is not entirely fit for extrapolation to a population on a radically different diet (e.g., a very-low carbohydrate diet or a ketogenic diet). Many of you have asked about this, and my comments have always been the same. It is entirely plausible that an elevated level of LDL-P or apoB in someone consuming a high-carb diet portends a greater risk than someone on a ketogenic or low-carb diet. There are many reasons why this might be the case, and there are many folks who have made compelling arguments for this hypothesis.
But we can’t forget the words of Thomas Henry Huxley, who said, “The great tragedy of science is the slaying of a beautiful hypothesis by an ugly fact.” Science is full of beautiful hypothesis slayed by ugly facts. Only time will tell if this hypothesis ends up in that same graveyard, or changes the way we think about lipoproteins and atherosclerosis.
The role of sugar in cardiovascular disease
Let’s start with what we know, then fill in the connections, with the goal of creating an eating strategy for those most interested in delaying the onset of cardiovascular disease.
There are several short-term studies that have carefully examined the impact of sugar, specifically, on cardiovascular risk markers. Let’s examine one of them closely. In 2011 Peter Havel and colleagues published a study titled Consumption of fructose and HFCS increases postprandial triglycerides, LDL-C, and apoB in young men and women. If you don’t have access to this journal, you can read the study here in pre-publication form. This was a randomized trial with 3 parallel arms (no cross-over). The 3 groups consumed an isocaloric diet (to individual baseline characteristics) consisting of 55% carbohydrate, 15% protein, and 30% fat. The difference between the 3 groups was in the form of their carbohydrates.
Group 1: received 25% of their total energy in the form of glucose
Group 2: received 25% of their total energy in the form of fructose
Group 3: received 25% of their total energy in the form of high fructose corn syrup (55% fructose, 45% glucose)
The intervention was relatively short, consisting of both an inpatient and outpatient period, and is described in the methodology section.
Keep in mind, 25% of total energy in the form of sugar is not as extreme as you might think. For a person consuming 2,400 kcal/day this amounts to about 120 pounds/year of sugar, which is slightly below the average consumption of annual sugar in the United States. In that sense, the subjects in Group 3 can be viewed as the “control” for the U.S. population, and Group 1 can be viewed as an intervention group for what happens when you do nothing more in your diet than remove sugar, which was the first dietary intervention I made in 2009.
Despite the short duration of this study and the relatively small number of subjects (16 per group), the differences brought on by the interventions were significant. The figure below shows the changes in serum triglycerides via 3 different ways of measuring them. Figure A shows the difference in 24-hour total levels (i.e., the area under the curve for serial measurements – hey, there’s our integral function again!). Figure B shows late evening (post-prandial) differences. Figure C shows the overall change in fasting triglyceride level from baseline (where sugar intake was limited for 2 weeks and carbohydrate consumption consisted only of complex carbohydrates).
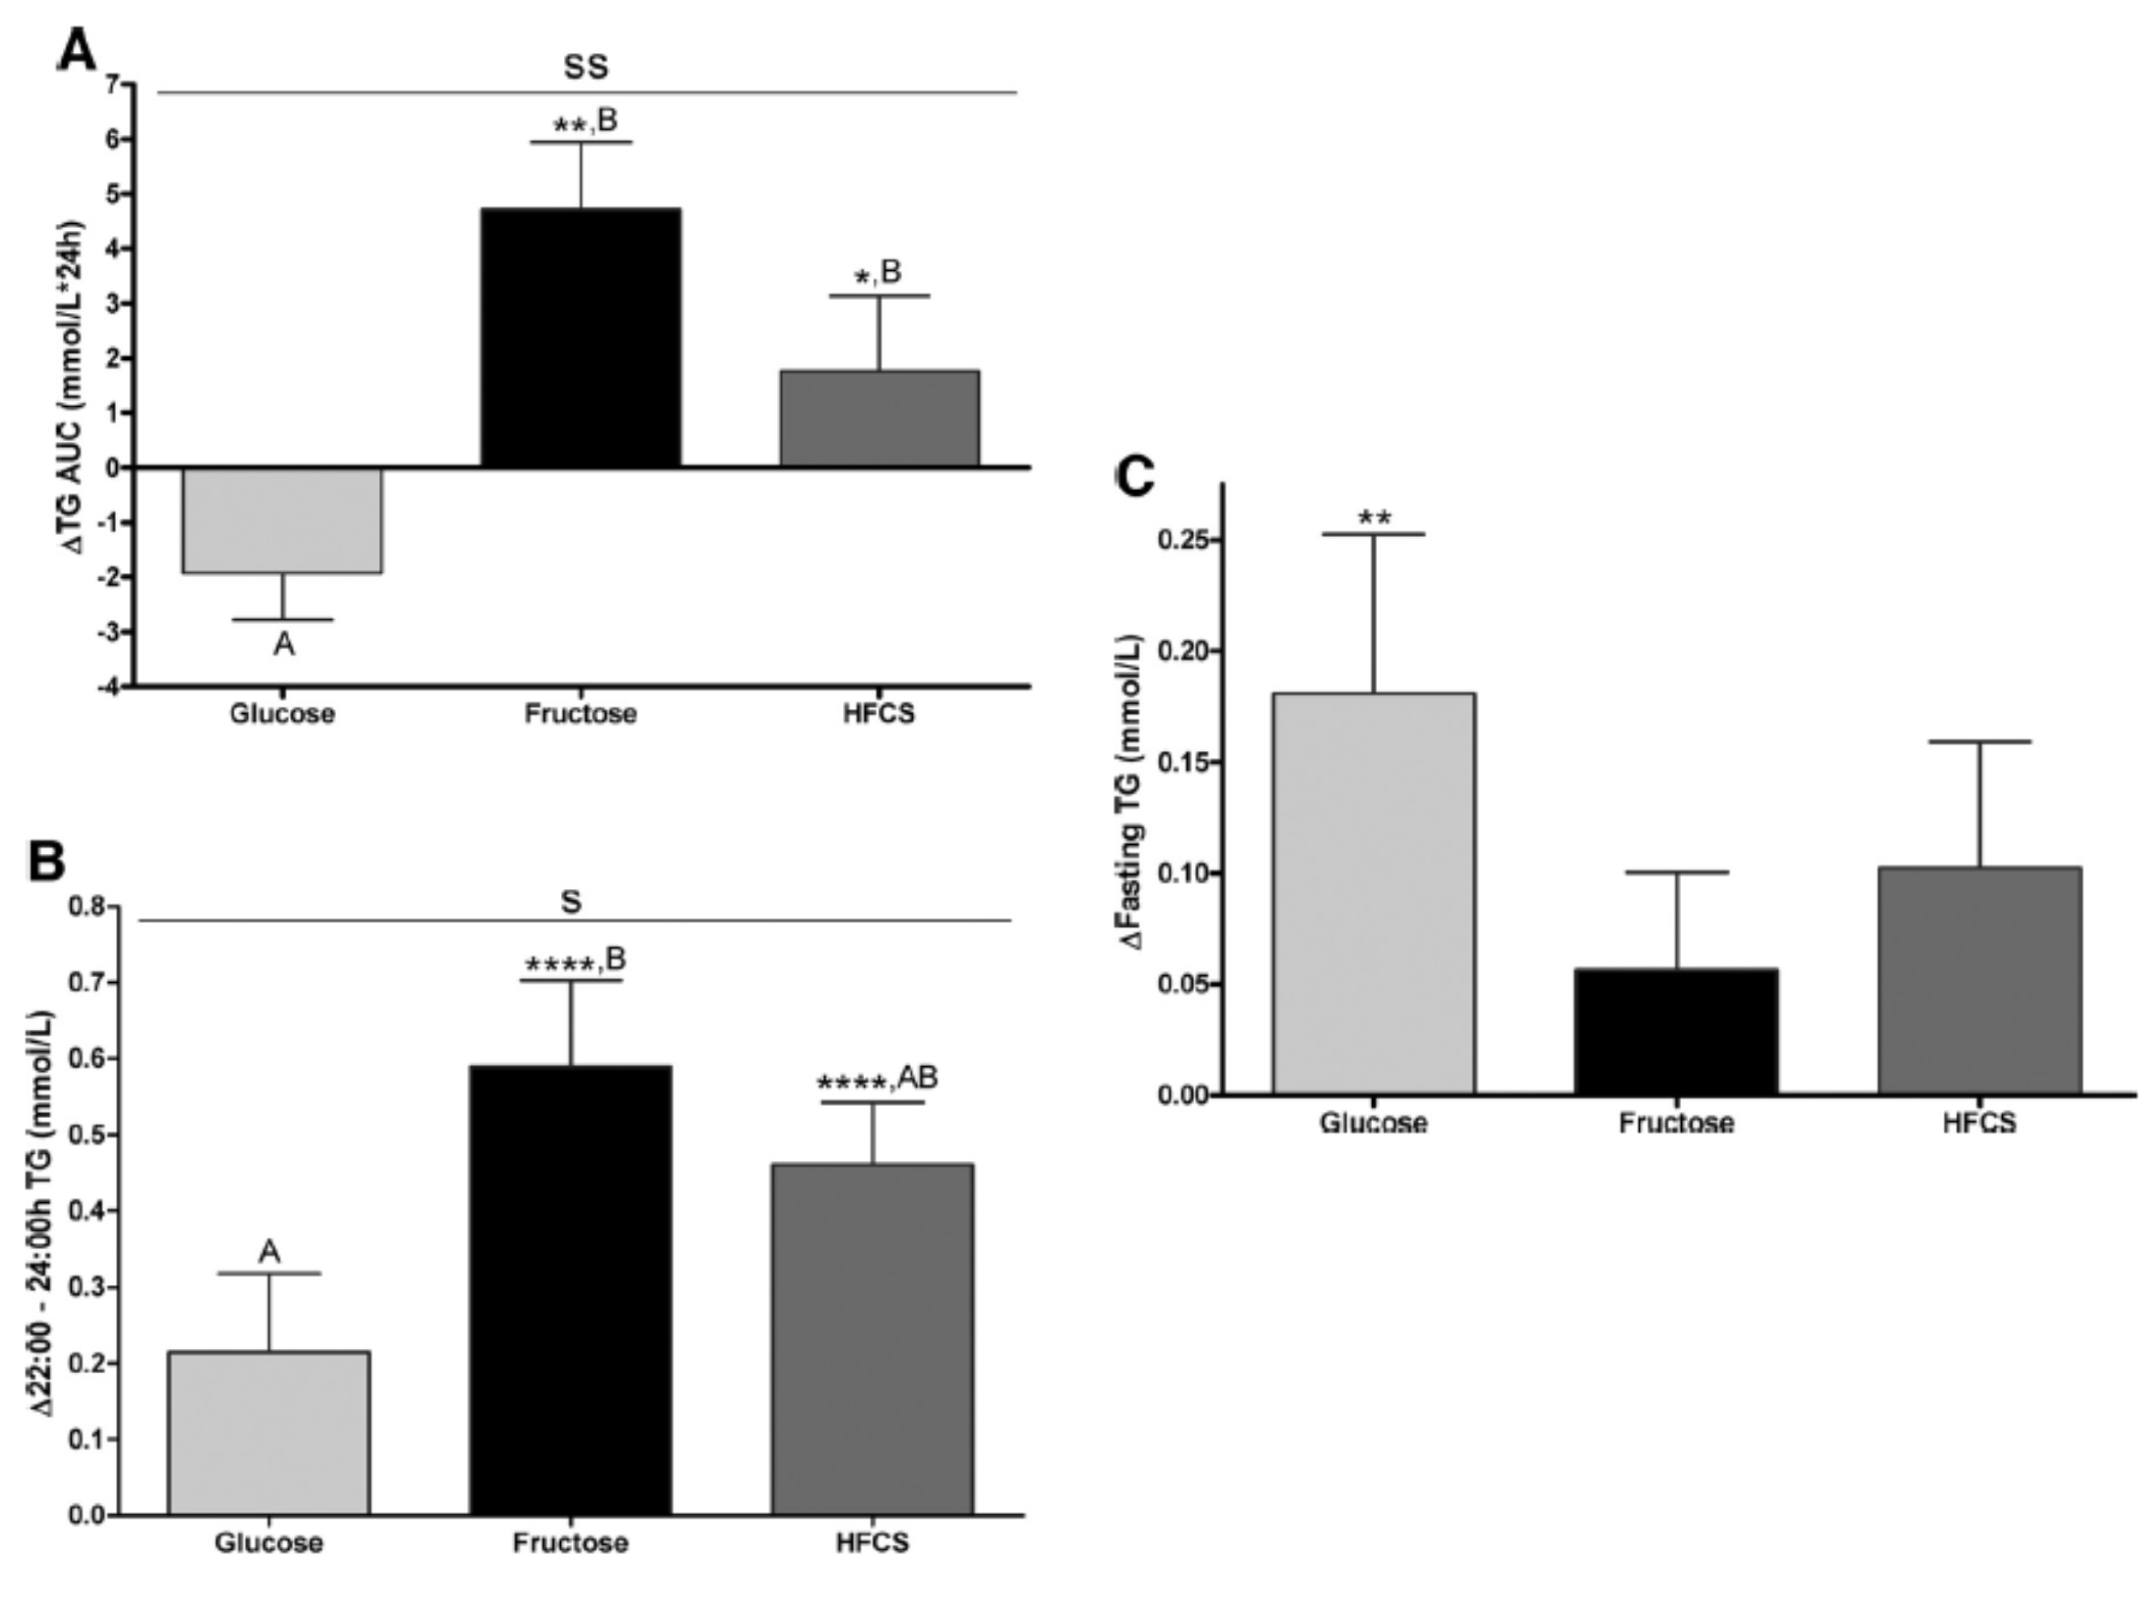
The differences were striking. The group that had all fructose and HFCS removed from their diet, despite still ingesting 55% of their total intake in the form of non-sugar carbohydrates, experienced a decline in total TG (Figure A, which represents the daily integral of plasma TG levels, or AUC). However, that same group experienced the greatest increase in fasting TG levels (Figure C). Post-prandial TG levels were elevated in all groups, but significantly higher in the fructose and HFCS groups (Figure B). The question this begs, of course, is which of these measurements is most predictive of risk?
Historically, fasting levels of TG are used as the basis of risk profiling (Figure C), and according to this metric glucose consumption appears even worse than fructose or HFCS. However, recent evidence suggests that post-prandial levels of TG (Figure B) are a more accurate way to assess atherosclerotic risk, as seen here, here, and here. One question I have is why did the AUC calculations in Figure A show a reduction in plasma TG level for the glucose group?
The figure below summarizes the differences in LDL-C, non-HDL-C, apoB, and apoB/apoA-I.
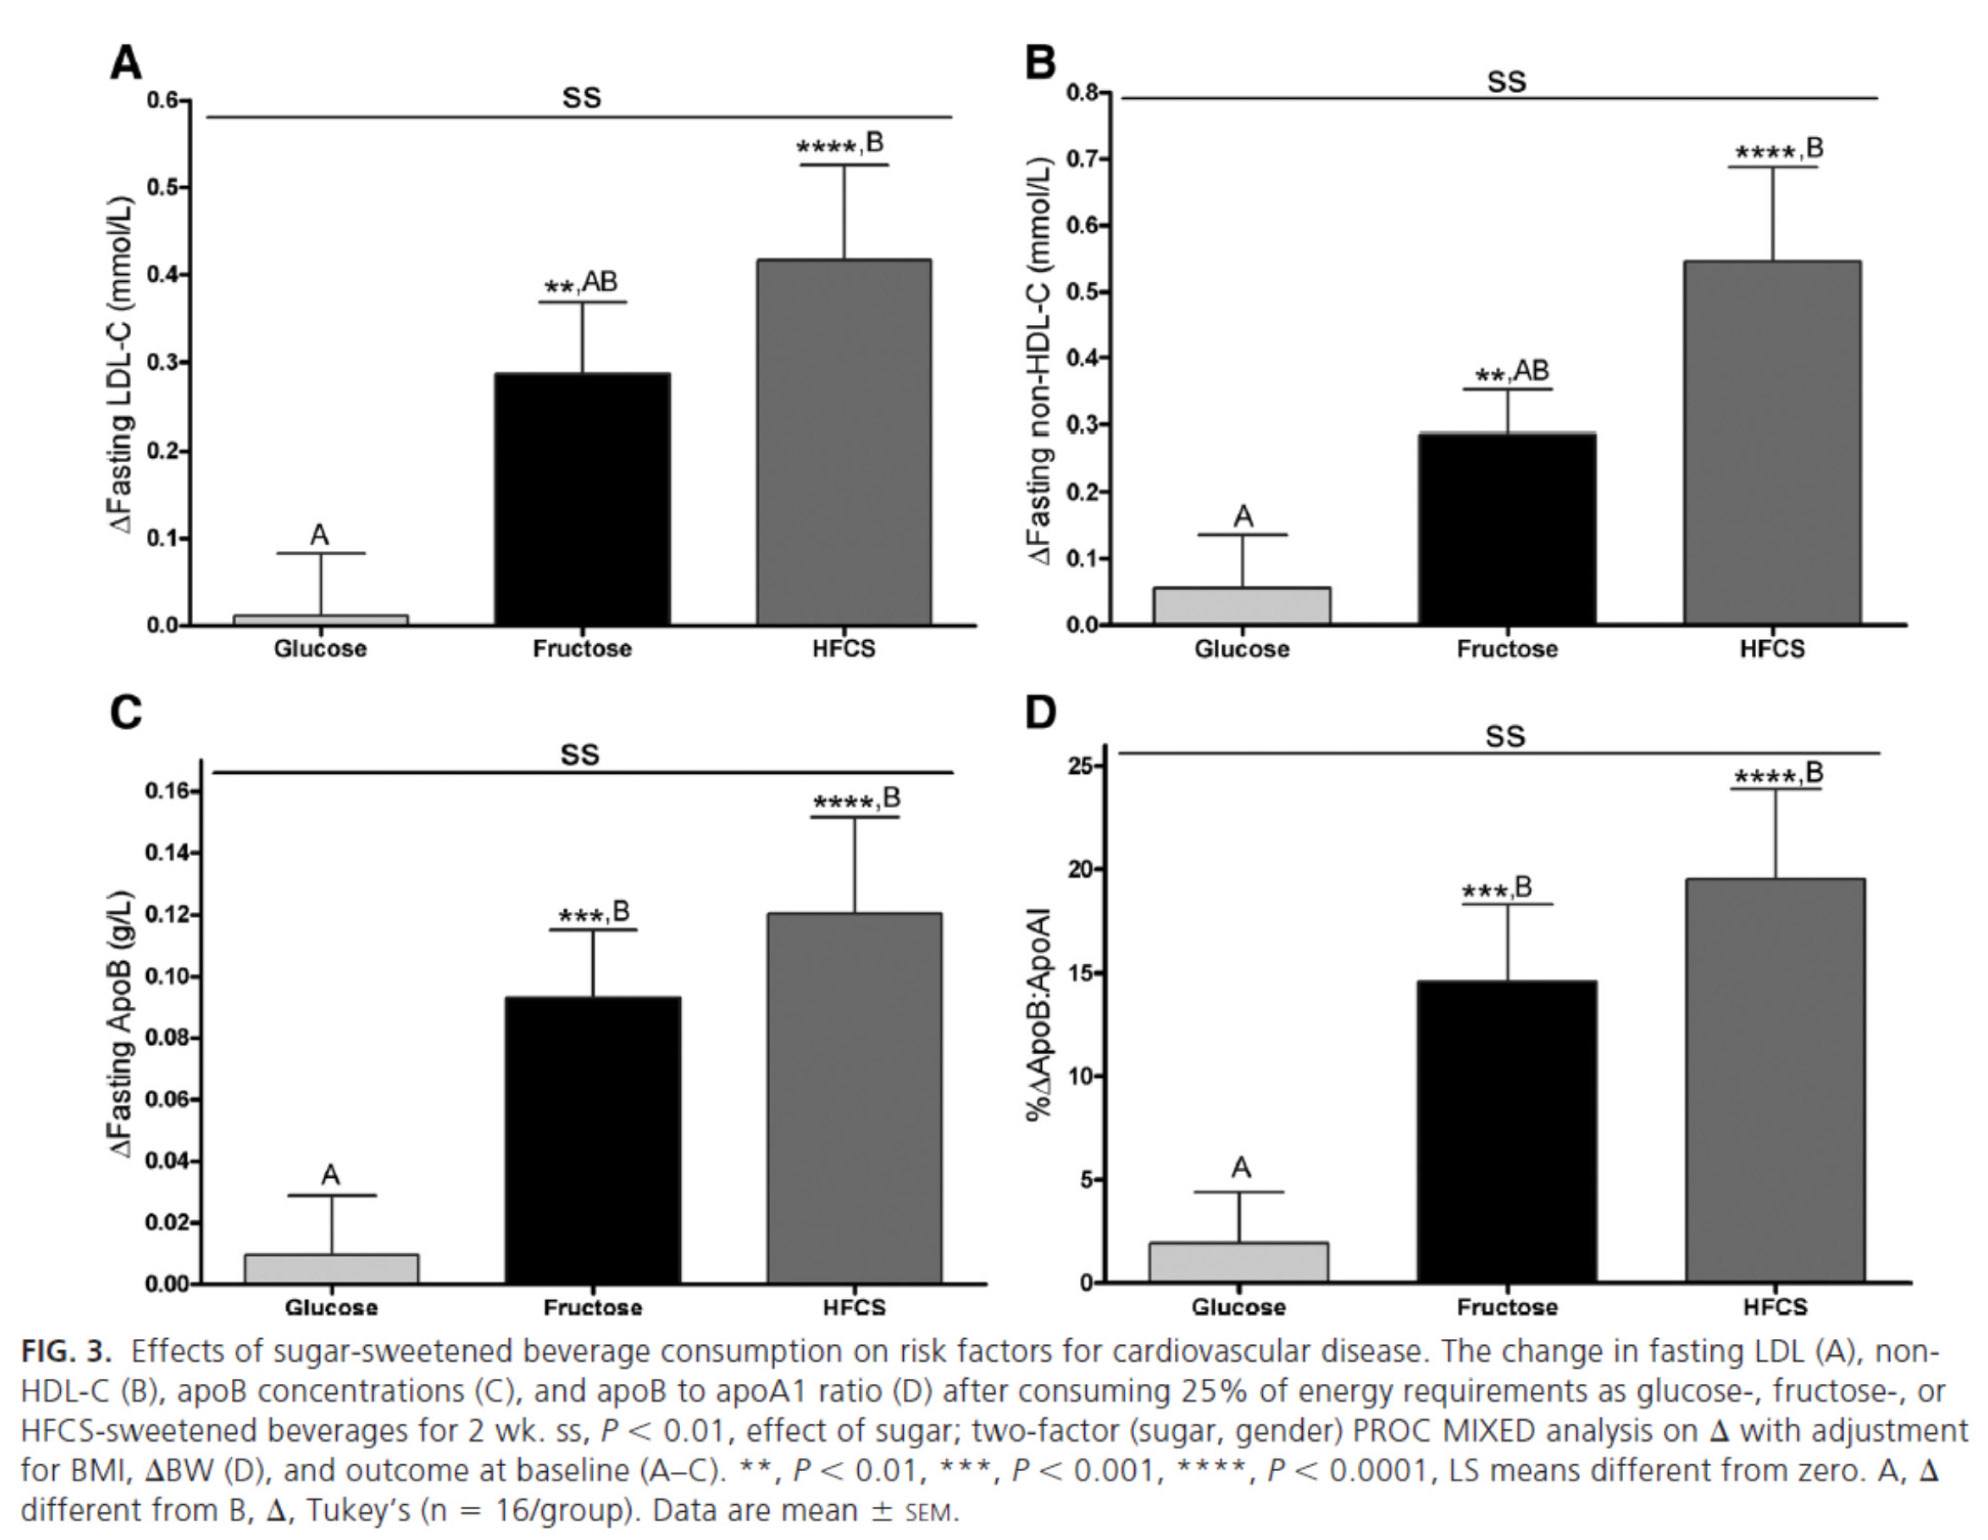
Again, the results were unmistakable with respect to the impact of fructose and HFCS on lipoproteins, and by extension, the relative lack of harm brought on by glucose in isolation. [Of course, removal of glucose and fructose/HFCS would have been a very interesting control group.]
One of the simultaneous strengths and weaknesses of this study was the heterogeneity of its subjects, who ranged in BMI from 18 to 35, in age from18 to 40, and in gender. While this provided at least one interesting example of age-related differences in carbohydrate metabolism (older subjects had a greater increase in triglycerides in response to glucose than younger subjects), it may have actually diluted the results. There were also significant differences between genders in the glucose group.
What was most interesting about this study was the clear difference between the 3 groups that was not solely a function of fructose load. In other words, the best outcome from a disease risk standpoint was in the glucose group, while the worst outcome was not in the all-fructose group, but in the 50/50 (technically 55/45) mixed group. This is a very powerful indication that while glucose and fructose alone can be deleterious in excess, their combination seems synergistically bad.
The role of saturated fat in cardiovascular disease
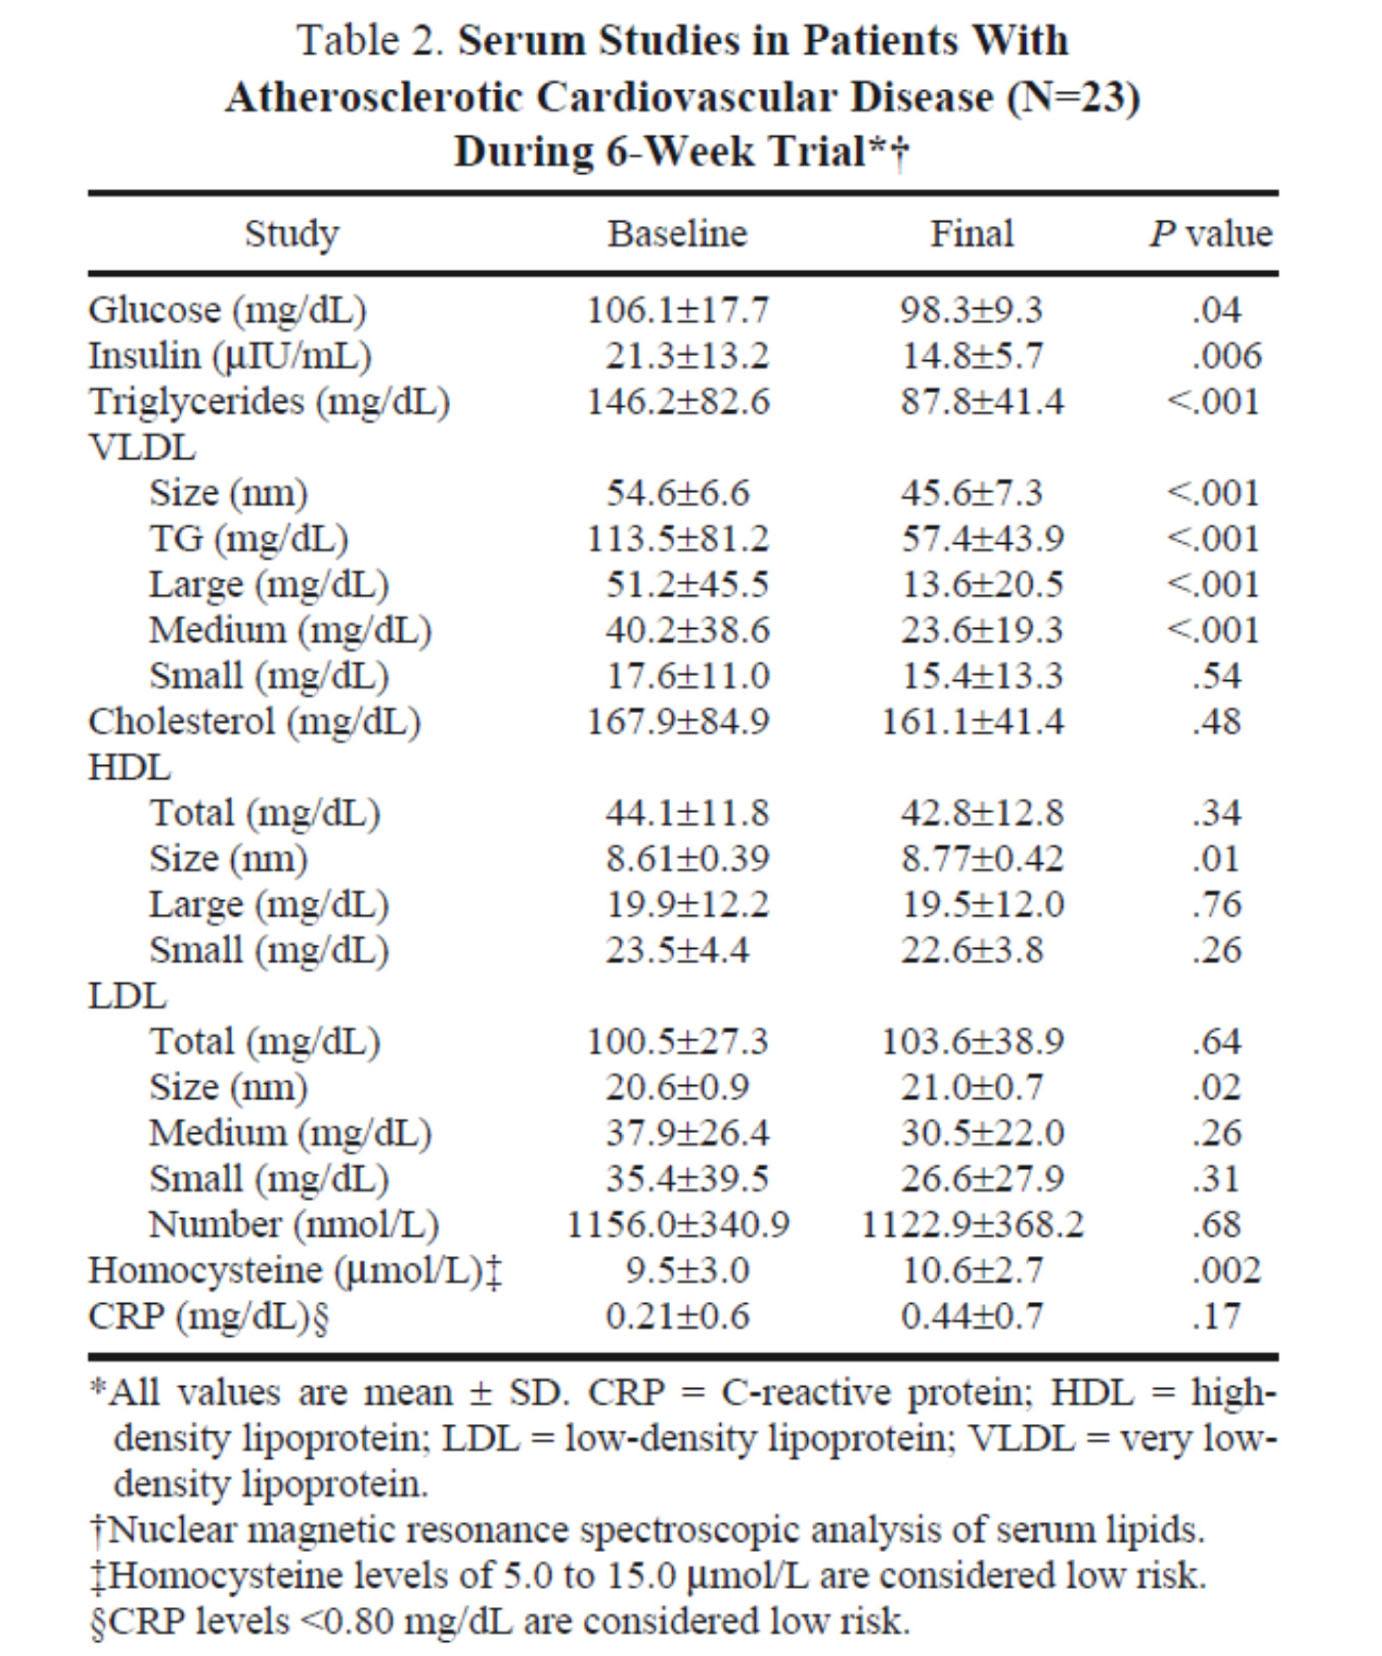
In the next week or two I’ll be posting an hour-long comprehensive lecture I gave at UCSD a few weeks ago on this exact topic. Rather than repeat any of it here, I’ll highlight one study that I did not include in that lecture. The study, Effect of a high saturated fat and no-starch diet on serum lipid subfractions in patients with documented atherosclerotic cardiovascular disease, published in 2003, treated 23 obese patients (average BMI 39) with known cardiovascular disease (status post coronary artery bypass surgery and/or stent placement) with a high-fat ketogenic diet. Because the study was free-living and relied on self-reporting, not all subjects had documented levels of elevated serum B-OHB. However, the subjects were instructed to avoid starch and consume 50% of their caloric intake via saturated fat, primarily in the form of red meat and cheese. There were no restrictions on fruits and vegetables, which may have accounted for the observation that not all subjects were ketotic during the 6-week intervention. In total, only 5 of the 23 patients achieved documented ketosis.
All of the subjects were on statins and entered the study at a goal LDL-C level target of 100 mg/dL, which may have been the only way the authors could get the IRB to approve such a study.
The table below shows the changes in lipoprotein fractions following the intervention (there was no control group):
This study was conducted during the height of the “outcry” over the Atkins diet. While most doctors reluctantly agreed that Dr. Atkins’ diet could reduce body fat, most believed it was still very dangerous. In the words of Dean Ornish, “Sure you can lose weight on a low-carb diet, but you can also lose weight on heroin and no one would recommend that!”
Fair point. In fact, the authors of this study acknowledged that they “strongly expected” this dietary intervention to increase risk for cardiovascular disease, which is why they only included subjects on statins with low LDL-C. However, as you can see from the table above, the authors were startled by the results. The subjects experienced a significant reduction in plasma triglycerides and VLDL triglycerides, without an increase in LDL-C or LDL-P. In fact, LDL size and HDL size increased and VLDL size decreased – all signs of improved insulin resistance. Furthermore, fasting glucose and insulin levels also decreased significantly. The mean HOMA-IR was reduced from 5.6 to 3.6 (normal is 1.0) and TG/HDL-C from 3.3 to 2.0 (normal is considered below 3, but “ideal” is probably below 1.0) in just 6 weeks. Taken together, these changes, combined with the dramatic change in VLDL size, suggest insulin resistance was dramatically improved while consuming a diet of 50% saturated fat!
As all of these patients were taking statins, we’re really robbed of seeing the impact of this diet on LDL-P, which did not change. Also, CRP levels rose (though not clinically or statistically significantly).
Putting it all together
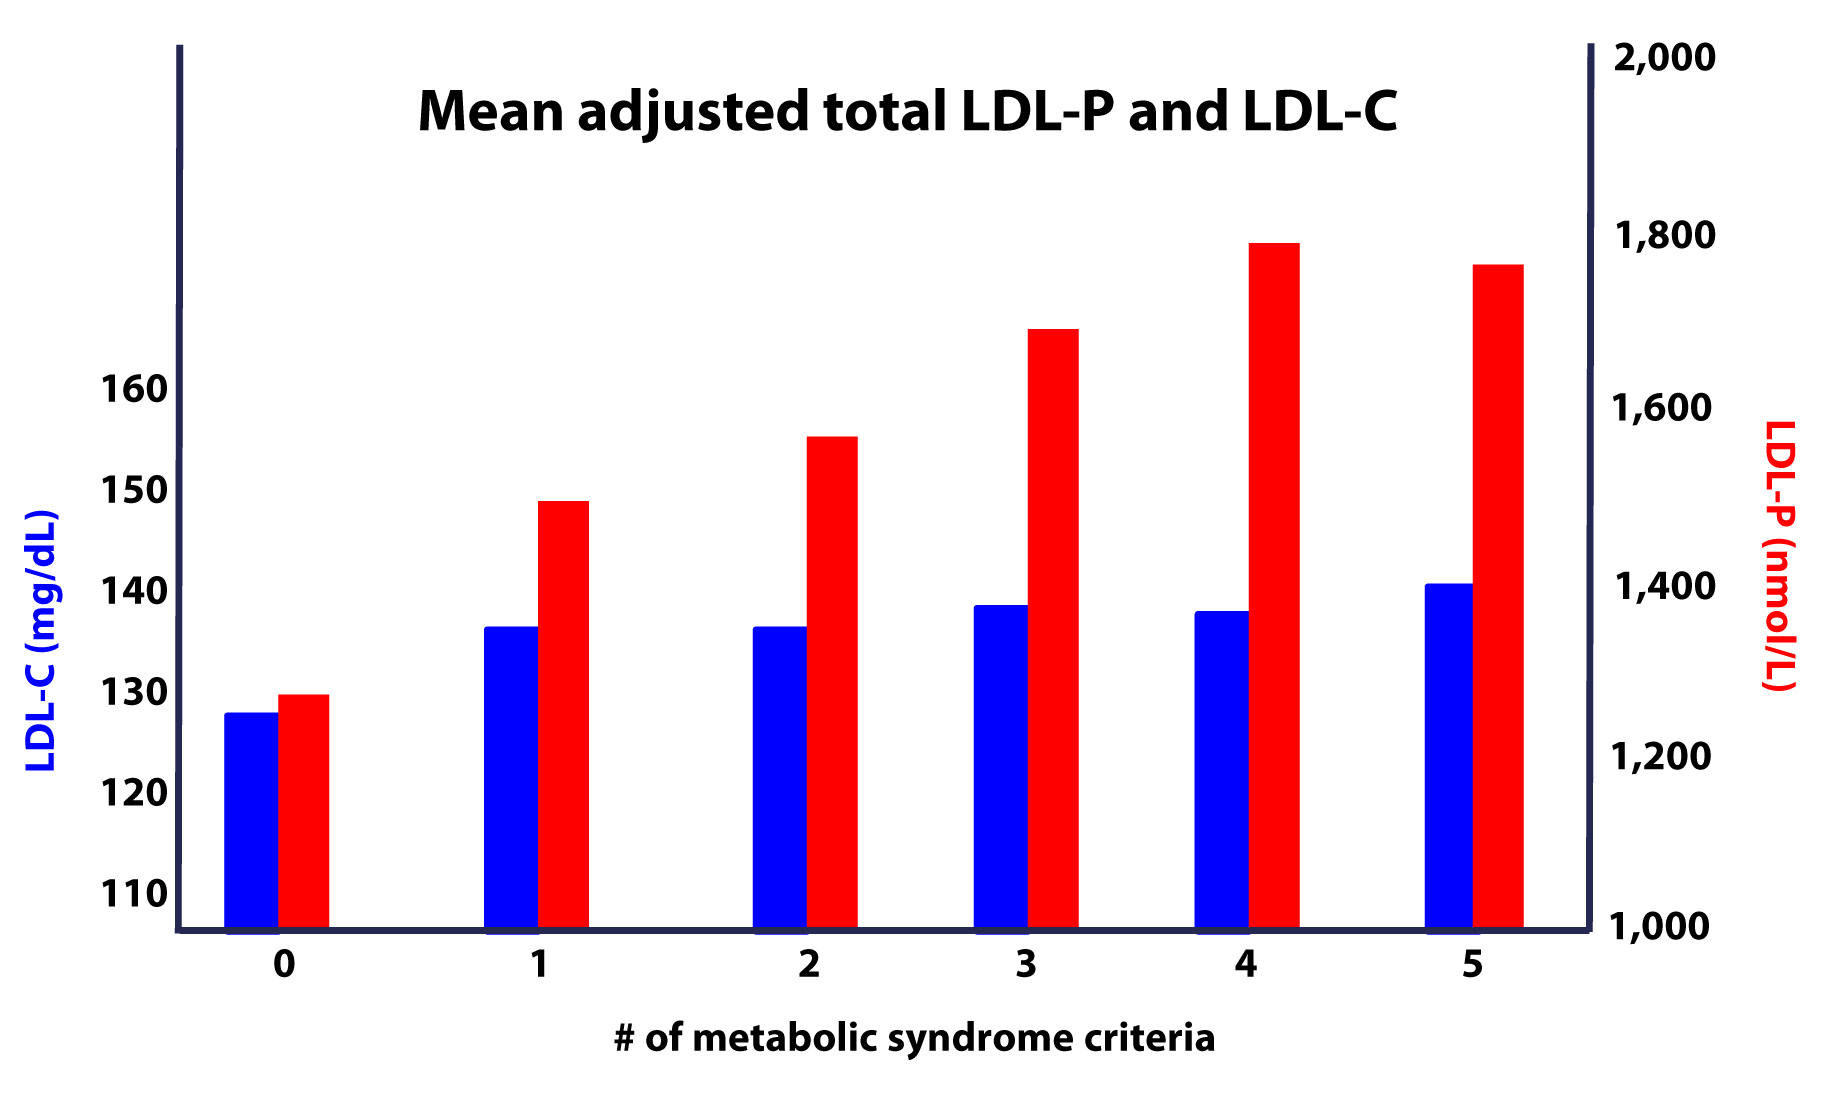
It is very difficult to make the case that when carbohydrates in general, and sugars in particular, are removed or greatly reduced in the diet, insulin resistance is not improved, even in the presence of high amounts of saturated fats. When insulin resistance improves (i.e., as we become more insulin sensitive), we are less likely to have the signs and symptoms of metabolic syndrome. As we meet fewer criteria of metabolic syndrome, our risk of not only heart disease, but also stroke, cancer, diabetes, and Alzheimer’s disease goes down.
Furthermore, as this study on the Framingham cohort showed us, the more criteria you have along the spectrum of metabolic syndrome, the more difficult it becomes to predict your risk, due to a widening gap in discordant risk markers, as shown in this figure.
As I noted at the outset, the “dream” trial has not yet been done, though we (NuSI) plan to change that. Until then each of us has to make a decision several times every day about what we will and won’t put in our mouths. Much of this blog is dedicated to underscoring the impact of carbohydrate reduction on insulin resistance and metabolic syndrome.
The results of the trials to date, combined with a nuanced understanding of the lipoprotein physiology and their role on the atherosclerotic disease process, bring us to the following conclusions:
- The consumption of sugar (sucrose, high fructose corn syrup) increases plasma levels of triglycerides, VLDL and apoB, and reduces plasma levels of HDL-C and apoA-I.
- The removal of sugar reverses each of these.
- The consumption of fructose alone, though likely in dose-dependent fashion, has a similar, though perhaps less harmful, impact as that of fructose and glucose combined (i.e., sugar).
- The addition of fat, in the absence of sugar and starch, does not raise serum triglycerides or other biomarkers of cardiovascular disease.
- The higher the level of serum triglycerides, the greater the likelihood of discordance between LDL-C and LDL-P (and apoB).
- The greater the number (from 0 to 5) of inclusion criteria for metabolic syndrome, the greater the likelihood of discordance between LDL-C and LDL-P (and apoB).
I would like to address one additional topic in this series before wrapping it up – the role of pharmacologic intervention in the treatment and prevention of atherosclerotic disease, so please hold off on questions pertaining to this topic for now.


Peter, thanks so much for your blog. My wife and I have been on a Keto Adaptive diet for about three months now and we both have been very happy. Lots of energy, improved alertness and a significant change in body composition. Neither of us are overweight but we have been able to maintain our weight while reducing body fat. All good. I have had one bump in the road related to my Lipid Panel. One year ago my numbers where: Total Cholesterol – 237, HDL C – 84, TG – 46, LDL C – 144. Last week I had my annual physical (age 53) and the numbers have changed: Total Cholesterol – 327, HDL C – 97, TG – 36, LDL C – 223. Going in for a re-test as my doc is quite concerned. Should I pursue a NMR LipoProfile? Not sure why my LDL would react to the keto diet in this way. Thanks for your opinion.
I’ll try to address this (common) theme in part X of the cholesterol series.
My panel went from this (doctor no like):
Total: 382
HDL: 157
LDL: 217
Triglycerides: 39
to this (doctor like):
Total: 284
HDL: 162
LDL: 117
Triglycerides: 23
I suspect this drastic LDL reduction resulted from a modest reduction of dietary sat fat (not sat fat avoidance, just using olive oil instead of butter to cook sometimes, allowing more pork instead of beef, adding a bit of nuts, allowing a modest amount of starch once or twice a day, etc.).
A recent Neutreval test showed, in accordance with this dietary change, a small reduction of RBC sat fat and small increases in RBC mono and polyunsaturated fats compared to an earlier test.
My doctor and I were both extremely surprised that such a modest dietary change could cause such a tremendous LDL reduction, apparently. I have no idea what the health consequences of this reduction may be, positive or negative, but my relationship with my doc certainly improved 🙂
I was also impressed by even further reductions in fasting triglycerides, and increase in my already ridiculously high HDL, even as I added back starch. I speculate that my period of VLC maybe fixed my metabolism so I can tolerate modest amounts of carbohydrate better. Intermittent fasting (no breakfast) and very brief, intense, once-a-week, Body by Science style weightlifting, may be contributing as well.
Peter,
Maybe this is part of what you are going to comer in part X, but I was going to post a question and reference to a study that discussed the implication of high LDL-P to future CVD events, but when adjusted for HDL-C and TG levels, the association disappears and is statistically insignificant (at 95%). I was interested in finding this since, similarly to the numbers I am seeing in these recent comments, my TC, LDL-C, ApoB are high, but so is my HDL-C and my TG/vLDL-C/LPa are low, which causes a disconnect for me:
TC 241
LDL-C 160
HDL-C 71
TG 52
vLDL-C 10
LPa 1
ApoB 138
Overall I am in pretty good health and recently measured at 10.85% body fat hydrostatically. I train a lot and eat a mod protein, high fat, lowish carb paleo style diet (30%/20%/50% P/C/F by calories).
Here is the study
https://content.onlinejacc.org/mobile/article.aspx?articleid=1188679
The population is on average, in their words, elderly at mid-60’s where as I am in my late thirties so not sure it is comparable or even if this study is relevant in your opinion. Do you know this this study? Is it meaningful? Would the fact that my HDL and TG levels (and the ratio between them) perhaps indicate that my elevated LDL-C may in fact not be an issue?
On a similar note, these numbers are from this past December, previously I was tested in July ’12 and between the two tests my TC/LDL-C/HDL/ApoB increased and TG dropped (ApoB & LDL-C raised at about the same rate so maybe particle size stayed constant), the main things that changed in my diet in between was that I was supplementing Dextrose or Maltodextrin post workout with whey and also increased my saturated fat a lot through coconut oil/butter and grass-fed butter. After reading your series I quickly dropped the sugar post workout and also the whey and am sticking to whole foods, but I still wonder if the increased saturated fat is partly or the whole reason my levels went up in the various lipid measures. Right now my saturated fat is around ~35% of total fat, but I consume 150-200 grams of fat a day.
Thanks for entertaining my question and also for all the great information you provide and the hard work you put into it
-Ari
This conclusion applies under 2 conditions: to this population (not sure how discordant they were) and at the population level. It’s up to you if you want to infer from those 2 conditions to yourself, personally.
Dr. Attia –
after trying for over an Year to lower my LDL-P from ~1500 to <= 1000, with diet and lifestyle, I did not succeed(South Asian genes) and decided to give medications a try.
With Ezetimbe10mg+Simvastatin10mg together my LDL-P is now '582' , LDL-C '55' , HDL-C '66' and HDL-P '31.6'(Dr. Daysprings's case paper 132 talks about a Woman where with these same medications, the patient had a big drop like mine; my Statin dosage is smaller) .
My question, if you have 10 secs, is that can one have too low LDL-C and or LDL-P?? The lowest LDL-P I see on the chart is ~720.
Thanks in advance!
Indy M.
Sunnyvale.
Yes, at some point, you can be too low. Not clear where, but probably below 30-35 mg/dL of LDL-C (not sure you can have too little LDL-P, but as you know 582 is probably in the 3rd to 5th percentile.
Hi Peter,
I was exicted to get my blood test results after 7 months of low carb dieting (really low, like Atkins induction phase). Unfortunately, I didn’t do a test when I started out.
These are the results:
Cholesterol 6,3 mmol/l
HDL 1,4 mmol/l
Triglycerides 1,2 mmol/l
Cholesterol ratio 4,5
LDL 4,36 mmol/l
ApoB 1,29 g/l
I found them to be a little dissappointing for a 42 year old male with no family history of CVD (most numbers pretty high).
But my question is how to assess the ApoB results:
1. It says 1,29 g/l on the result form. That is 129 mg/dl right?
2. The result form gives 0,49 g/l – 1,73 g/l as range for normal values. So I should be ok
3. However I found numerous sources stating that <90 mg/dl or even <80 mg/dl are the safe ranges. So now I am confused. is 1,29 g/l a safe result or not?
Thanks for your help (and I donated 100 dollars to NuSi. Any news on when the first experiments will start)?
Guido, thanks so much for your generous donation. The first experiments will begin this year. Look for the announcements in time…
You’re welcome. I am also bringing a lot of your stuff into the Dutch discussion fora to show that a calorie is not a calorie. Trying to convince (among others) the author of leading new diet over here (Dr. Frank diet).
But any thoughts to share on how to assess the ApoB values? Are these normalized accross labs or might it be somewhat different per lab? Again 129 mg/dl is much higher than safe ranges of <90 or even <80 that I see.
Or should I tell my family that I will quit drinking coffie with heavy cream and fatty meats 🙂 ?
I will hopefully address this concern in Part X.
Oops, “Or should I tell my family that I will quit drinking coffie with heavy cream and fatty meats?” should be: “Or should I tell my family that I will quit drinking coffee with heavy cream and stop eating fatty meats?
We might not have the best culinary culture in the Netherlands, but we don’t put (fatty) meat in our coffee 🙂
Very funny!
Hi Peter!
Your articles are avesome. I have been on a ketogenic diet for two months.
Average values:
Carbs under 30 grams
Protein 15% of total daily intake
Fat 85%, saturated fat 33%, monounsaturated 27%, omega3 : omega6 ratio = 1 : 1,4.
My blood test before:
Cholesterol 5,11 mmol/l
Triglicerides 0,5 mmol/l
HDL 2,17 mmol/l
LDL 2,71 mmol/l
My Blood test after:
Cholesterol 7,2 mmol/l
Triglicerides 0,6 mmol/l
HDL 3,0 mmol/l
LDL 3,7 mmol/l
As you can see the ratios stayed the same, all the values just increased exactly by 40%.
Now for the next two months i am going to increase the monounsaturated fats and reduce the saturated fat because i would like to lower my LDL. What dou you think abaout the blood values and do you think this strategy might work??
Keep up the good work and thank you for the answer!!
Oh yess and i would like my total cholesterol level to get lower, do you think it could decrease by reducing the consumption of saturated fat???
Will try to address these issues in Part X.
Dr. Attia,
You’ve discussed the importance of omega-3 to omega-6 fatty acid ratio in dietary intake. Some recent anecdotal evidence I’ve come across suggests that VERY high doses of omega-3 fatty acid in the form of fish oil has a strong correlation with improving cholesterol profile. By very high dose I mean 30-40 grams per day. What are your thoughts on this?
If true or not, I’m not sure. It’s probably somewhat dependent on apoE status. However, EPA and DHA (the “active” ingredients in fish oil) are by no means benign. You can definitely get too much. Side effects range from anti-anabolism to spontaneous bleeding and easy bruising. I titrate my levels very closely.
First of all, Peter, you’re an ace. Thank you so much for writing these brilliant and thoughtful blogs. I’m a former cancer cell biologist (I’ve got a doctorate from Harvard Medical School) and have been greatly affected by the work of Dr. John Ioannidas, demonstrating how poorly designed most biomedical research really is. The fact that “evidence-based” interventions are so often based on poor logic is really an eye opener. Your posts really point out where we need to go and what’s missing in nutritional science, which makes me extra delighted that NuSi has recently received some serious funding. Congratulations.
Now, for a question about lipids. My husband and I have been eating a low carb diet (probably around 100 gms of carbs a day) for about 9 months. We started it because my husband Gordie has a scary calcium reading of 600 in his coronary arteries. We tried an Ornish-type diet first for about 18 months. The result was poor. His LDL particle which were previously large and fluffy reverted to small. My blood pressure went through the roof. So, I began to distrust the low fat literature. On the low carb diet my LDL-C is 86. My HDLs are 76. My triglycerides are 54. BUT…LDL-P is 1355 even though fasting insulin is very low. My husband has similar values in lipids other than somewhat higher LDL-C. BUT…His LDL-P is even worse than mine- up around 1500. His cardiologist wants him on statins to reduce LDL-P (and LDL-C). My reading of the research suggests that statins are unlikely to reduce LDL-P (and I’m not particularly concerned about the LDL-C). Furthermore, I’m not a fan of potential statin side effects, especially since my husband doesn’t need any help reducing inflammation. His CRP is actually zero. Since neither of us has metabolic syndrome, and we’re both slim, is the discordance between our LDL-P and LDL-C values still likely to correlate with an increased risk of CVD? If so, should we be reducing fat to decrease LDL-P? I can’t find anything else that might reduce it but niacin and I wonder about that, too.
Joan, discordance does not imply risk, per se, but it does suggest advanced testing (i.e., apoB/NMR) is warranted to properly stratify. I’m not able to comment on numbers. Sorry.
Peter,
Thank you for compiling this information. I am trying to think about how to apply what I have learned here and I think I’ve come to this: cholesterol is vital to our survivial and the body has very efficient feedback loops to regulate its production. If we are not consuming enough, we will produce it and vice versa. So, aside from omega 6s, etc, it does not matter how much cholesterol we eat. However, as it relates to our cardiovascular system, inflammation is the real culprit of our problems and testing for these markers (CRP, etc) seems to take a greater importance than the standard lipid profile that we are used to. Do you agree and can you elaborate on this?
Thanks again for all this info.
Justin, I’m actually giving a talk this weekend at ASBP which will address this. But don’t confuse non-causal markers (e.g., CRP) with causal markers (e.g., LDL-P) or even targets of treatment. I’ll try to address in part X.
First began reading you a few months ago. I am a physically fit 41 year old male (approximately 11% body fat) with a history of exceptionally high cholesterol (unmedicated, 250 – 375 TC), along with a decent ratio of LDL/HDL and typically elevated but not abnormally high triglycerides. I had tried low fat diets in the past and saw zero change in LDL, so have been on statins for most of the last 10 years. I began reading your and Taubes’ material and decided that, although I don’t have typical signs of insulin resistance, I would try a very low carb diet. I have spent the last 8 weeks cutting out almost all sugars and carbs (not ketogenic as I ate legumes and drank primarily milk), but no grains or sugars. Just got my NMR lipid profile. Yikes. TC is above where it was last year (309). LDL-P numbers are through the roof (3247) and LDL-C higher than before. HDL-C lower than before, and HDL-P numbers not so hot (30). My triglycerides are higher than they have ever been as well. I am happy to have run a self experiment on this, but it looks like, at least for me, low carb is not helpful and, in fact, worsens my blood chemistry. My test claims I’m high risk for insulin resistance, which seems odd considering the low carb/sugar diet is the first time I have shown up as possibly insulin resistant. I only have with-statin standard blood tests to work with, so now I plan to do 8 weeks of my normal diet on 20 mg daily statins and see where I stand. I can’t really justify not taking statins now that I have failed to improve things on either a low fat or a low carb diet. Running out of diet options. Sigh.
Still, I’m a huge fan of what you and Gary Taubes are doing. Thank you so much.
It may be less about your carb restriction and more about the types of fat you’re using. Obviously, I can’t suggest anything particularly insightful from a distance, but maybe switching from high saturated fat to less (and replacing it with monounsaturated) and more leafy veggies? I have seen this work in the past, for what that is worth.
Jeff,
I’ve been lucky, in that my experience has been much like Peter’s. I’m older (57) and don’t exercise as much (who does?) but my weight has dropped from 207 to 173, and I no longer need statins or BP meds. I’m confident that eating fewer than 50 carbs/day (and closer to 20/day) is a BIG part of my success.
One thing I think I’ve learned from my low carb dieting is that the effects of eating fewer carbs are not linear for many (if not most) people. In other words, one cannot simply eat more fat and reduce carbs, and expect great results, or even good or better results.
You might want to check out “The Art & Science of Low Carbohydrate Living” by Phinney and Volek. In the book, the authors note that increasing one’s dietary fat from 30% to 60% (of daily energy intake) can actually make one’s insulin sensitivity worse. However, when energy from fat climbs over 60%, then one’s insulin sensitivity starts to improve. (By increasing dietary fat, they also mean reducing carbs.)
In other words, getting incrementally fewer carbs and more fat might not help, and it can actually hurt, if you’re still eating enough carbs to cause an unwanted insulin response. (I’d been avoiding carbs, generally, for years, with no clear benefit. But when I REALLY stopped eating carbs, my weight started dropping and my lipid numbers improved.
If you’re still drinking milk and eating legumes, you’re probably not on a real low-carb diet (or I should say, not low enough for you, since everything depends on how we each react). To find out whether the diet works for you or not, you might need to reduce carbs significantly, to somewhere between 20g-50g per day.
At least, that is what worked for me. Good luck!
Thanks to both of you for responding, although I do note that the suggestions are polar opposites (one is higher saturated fat and the other lower saturated fat). I intend to continue experimenting, but my numbers are so off the chart that it feels irresponsible to not include a statin at this point (which is what my very patient primary care doctor is begging me to do). One of the problems with self experimenting is with so many possible variables, by the time I figure out what might work for me, it might be too late.
How outside of the norm is a LDL-P number of 3247? It seems to be literally off the charts.
I have no physical markers of insulin resistance. I.e., I am thin, I do not gain weight or lose weight easily (or really, at all, no matter what I do). What is the best way to determine insulin resistance? It seems more likely that I have hypercholesterolemia, which doesn’t seem “treatable” by diet change. I haven’t reviewed this paper, but it sounds like my case may be one in which statins are actually required.
https://eurheartj.oxfordjournals.org/content/29/21/2625.full
Jeff,
In no way did I mean to contradict Peter. (He knows much more about all this than I do.) I also don’t think I did contradict him.
Peter suggested that you change the type of fat you are eating (less saturated fat, more monounsaturated fat) and eat more leafy vegs. I’m not disagreeing with that, and have no insight on those points. You mentioned IR in your first post, and I just wanted to share the observation that eating fewer carbs might not help IR, unless one gets the carb intake down significantly. (A no carb diet might not help you, but you might need to try fewer than 50g of carbs a day to really know.)
Since you don’t have a weight issue, your case is certainly different from mine, so I’m probably not much help. Sorry. I will add that I stayed on statins until I got my fitness level up and weight down. Then I dropped the statins for a few weeks, to take the tests and confirm that I don’t need them.
Please let keep us posted on what you learn, if you don’t mind.
I will keep posting my test results and my experiments. I love this community, and Dr. Attia’s work, and appreciate any and all insights. Certainly didn’t mean to insinuate otherwise. I was highlighting the difficulties inherent in self-experimentation (and, more globally, the attempts to provide meaningful nutrition guidance). So many variables, but limited time and resources. It is well-nigh impossible to alter just one variable at a time and would take several lifetimes (many ending in adverse cardiac events!!) to try to do so and collect meaningful personal data.
For the next 8 weeks, I intend to be on 20 mg of statin and continue to abstain from as much sugar and carbs as I can. I don’t have the lifestyle and/or self-control to conduct more nuanced moves. I will repost when I get my next lipid profile.
Dr Attia,
I just got the results from an NMR profile I requested after my Dr. freaked over my 270 TC…I can see generally that I’m in pretty good shape, but welcome you pointing out any outliers that jump out at you…
NMR Lipoprofile
CVD Risk:
HDL-P = 34.7
Small LDL-P = 157
LDL Size = 21.5
Insulin Resistance/Diabetes Risk
Large VLDL-P = <0.7
Small LDL-P = 157
Large HDL-P = 11.6
VLDL Size = Too small to measure
LDL Size = 21.5
HDL Size = 9.9
Insulin Resistance Score = 4, (0-100)
NMR Lipoprotein Test
LDL-P = 1589
Lipids
LDL-C (Calculated) = 160
HDL-C = 81
Triglyceride = 25
Total Cholesterol = 246
Thanks, Jeremy
Hi Peter
I have been searching for information after receiving my last lipid profile from our local lab. As an aside, they were reluctant to draw and submit the blood without the referral from a GP. I referred them to the 7 megatrends of Paul Keckley, specifically that with ‘unconstrained connectivity’ users will be managing their own healthcare information. Eventually they let me do it.
My LDL number is slightly down on the test I did two months ago but still very high and perhaps the drop was within normal weekly variance.
I also asked for an apo-A1 and apo-B count which they did. My apo-B is very high. The apo-B/apo-A1 is just over 1 (1.66/1.56) which I believe is in a high risk zone. I know you have asked us not to send our numbers but that is just for illustration.
I am concerned about what you have said about the link between high LDLs and atherosclerosis. So I would like to bring the LDL numbers down. However I want to take ownership of this journey of health and research. After some searching I came across a posting by Chris Kresser in which he talks about way goiterogens in cruciferous veggies impede the uptake of LDLs. As it happens, for the last few months I have been using Himalayan salt which has zero iodine. And I have been eating brussels sprouts and brocolli which apparently are high in goiterogens.
I am not keen to start taking statins. My general cholesterol level went from just over 5 when I started LCHF in October last year to 8.7 in the last profile. And I have a sense that by research and some discipline I can get my numbers into an acceptable range, based on what you present.
Therefore my strategy is to start with an iodine supplement (and a selenium which supports the uptake of iodine) both of which I get from a multivitamin. I will also eat more seafood. A lot of the advice on bringing down cholesterol comes from the old thinking that you and others are challenging so is not so useful. But I have decided to take on more soluble fibre and have started eating a couple of spoons of psillium a day. Oh yes I have also started eating kefir which, according to the best material I could find, has been shown to have no effect on LDL count but it seems healthy and is tasty. I have decided to continue with the high fat diet as before, which includes butter, cream, coconut oil and olive oil as well as leafy veg and some protein (mostly chicken).
I am also reasonably active and surf or run most days of the week.
I guess I am posting this just to hear any comment from you or anyone else and to give feedback when I do my next test. This is hardly a controlled observation but may provide some anecdotal input. I am really enjoying coming to grips with the science you offer in your postings. The terminology is slowly sinking in and I can now read most of the way through your ‘straight dope’ series before starting to feel lost. And your video postings are high value to this understanding for me – so thanks again.
Thank you so much for this very informative series. I’ve read through twice (what can I say-the material is dense and my background is non- existent). Reading your personal journey helped me understand how to apply the material to myself.
I had my standard lipid profile this week through the nurse’s station where I work, and my numbers seemed…off. My TG and HDL-C are perfect, but my LDL-C was in the very high range. A year ago, I would have been alarmed. Now, I know to calmly ask my primary care doctor to run the NMR panel. This saved me a whole lotta’ stress.
Or apoB…that will be less expensive, if they don’t want to do NMR.
Should I continue a low carb, moderate protein diet after cardiac bypass surgery?
As I type 1 diabetic, I realize I must keep the carbs low in order to minimize insulin requirements.
I eat moderate protein, ie. grass feed beef ,.free ramge chicken, eggs and small servings of cheese on occasion.
The hospital has now tells me to minimize the saturated fat. In the past I have cooked with coconut oil and butter.
Your help is appreciated.
Joan, it may depend on what you replace the saturated fat (SFA) with. If you replace it with carbs, there is little doubt in the literature that your risk for heart disease goes up, not down; with MUFA, maybe down slightly; PUFA unclear. As far as cooking, you really need to be using SFA (butter or coconut oil) for stability reasons, though your diet sounds pretty good already! Ask the hospital what evidence they have for their recommendation?
“As far as cooking, you really need to be using SFA (butter or coconut oil) for stability reasons”
I confess, I am quite confused now. You mentioned before that one struggling with high LDL might try switching from saturated fats.
Is it a fair summary to say that you recommend cooking with coconut oil and using olive oil for salads? (EVOO?)
What about avocado oil for cooking? It has a high smoke point, and tastes better than the coconut oil I have tried.
(In fact no one in our household will tolerate the Trader Joe’s coconut oil. Maybe there is a coconut oil out there with a more neutral taste?)
Thanks again.
Hey,
I hope you don’t mind if I pitch in here quickly. There’s two things you need to look at when considering an oil for cooking.
1) The fatty acid composition
2) The smoke point
Fatty acids naturally start to oxidize (that is, become rancid) when exposed to oxygen, and this process is accelerated by light or heat. By definition what makes certain fats “unsaturated” is what makes them more prone to oxidation. Therefore the most stable are SFA, then MUFA, then PUFA. For this reason you should use SFA for cooking.
The smoke point depends on how “pure” or refined the oil is. It’s not the fats that start to burn and cause smoke at high temperature, rather it’s the impurities in the oil. For example, sunflower oil is very high in heat sensitive PUFA, but because it’s very refined it can be heated very high without giving off smoke. While butter is full of SFA which are more heat stable, but due to the milk solids that are prone to burning it has a low smoke point. So, if you are going to cook at a higher temperature look for a coconut oil that suits your taste or perhaps try clarified butter, also known as “ghee”, which is pure butterfat that has had the milk solids removed from it.
Personally, just to be on the safe side of things, I tend to prefer to cook on low heat (i.e. slow cook meat in the oven, steam vegetables) and then add fat towards the end just for taste (and nutritionally seen as a source of energy).
EVOO is very high in MUFA, which Peter pointed could possibly to some extent lower your risk of heart disease. I don’t see any reason at all to avoid it and quite frankly there isn’t any other oil that tastes as good in salads.
Also, if you do plan to follow a diet that is high in fat, and are considering to cut down on SFA it seems inevitable that you’ll consume more PUFA which will increase your intake of omega-6. My understanding is this can be problematic because omega-6 competes with omega-3 in some of the metabolic pathways that are used to convert certain forms of omega-3 into one’s that are more highly regarded by your body. Therefore it might be wise to supplement daily with fish oil or an algae based omega-3 supplement. I believe it’s specifically important to get an adequate amount of DHA (docosahexaenoic acid) as it’s the most desirable and versatile.
Perhaps Peter could chime in here if I’m not off-base with my recommendation.
I think both of these are important, though I focus more on #1 (which makes #2 less essential). Hence, cooking with SFA, safer than MUFA, safer than PUFA, as a general rule. Agree that lower heat is probably better for cooking for many reasons.
Thanks, T.S. and Peter.
Hi Peter,
Does Crestor cause weight gain? Eager to see part 10 when you have the time 🙂 Thanks!
If it does, it’s not a common side-effect.
Hello again, Peter et al,
I have done a bit more research into published RCTs on the efficacy of very low carbohydrate diets. The data are usually presented as means for the groups of dieters, so it is difficult to find as much information as needed to really find out the distribution of effects on LDL-C or LDL particle numbers.
However, at least one study, by Westman’s group at Duke, reported (in vol 140 issue 10 in 2004 of the Annals of Internal Medicine) reported a significant increase in LDL-C in 30% of those on the very low carb diet.
Afterr a few months of very low carb dieting, My LDL-C calc increased by 20%. Now that I have looked at what Dr. Dayspring has to say about this effect in some, and of course, consulted my physician, I am doubling my statin dose to bring down my LDL -C. I am also cutting way back on all saturated fats, switching to olive oil almost exclusively.
That said, I remain delighted by my significant weight loss and improved glycemic control. And, i should say, my apparent troubles with LDL may have preceded my weight gain and insulin resistance by decades, as far as I can tell. Doctors have always told me to eat a low fat diet, which, of course, until recently, I thought I was doing!
Frankly, I am troubled by the fact that this effect on LDL seems to be downplayed in the discussions online about very low carb diets, and that folks are being encouraged, by some advocates, to regard butter, cream, and cheese as completely healthy for everyone. Unfortunately, many of us seem to be as vulnerable to the saturated fats as we are to the excess carbs. (I am still unclear about the coconut oil , but I will avoid it for now.)
Of course, the fact that the adverse effect on serum lipids is often obscured in the reports of RCTs is also troubling.
Peter, thank you for your work on the NuSI initiative. I hope that the data will be available to all, and reported in ways that are useful for the broad spectrum of individuals.
I value your analyses and commentary, and look forward to more blog posts on ketosis and cholesterol.
Jane, I can’t wait to dive into the content for Part X.
Thanks Peter. by the way, i also found your TED talk to be very moving and persuasive. we all need to hold open our minds to different and probably more complex answers from the future studies,
I want to mention one more idea about my own weight loss effects. This is kind of obvious, but I omitted before.
maybe it wasn’t the eating of fat, but the burning of my own fat, or something else about the process, that increased my own generation of increased LDL-C. I am not clear about the biochemistry. Looks to me like the body pretty much breaks down everything we eat and reassembles and generates a new balance based on our own individual situation.
Who knows, maybe my brain and nervous system need more endogenous cholesterol? That, of course, raises the Quality of Life question, yet another complex web of interactions.
Regardless, Even if I can shed the last 10 pounds (back to where I was before perimenopause), and I certainly plan to, I will not be able to learn whether the olive oil substitution would have been effective, because of the statin.
So far, I have not figured out how to get the VAP or NMR testing done here to find out about the particle size effect.
But even if only my concentration of LDL is increased by the eating pattern or fat loss, the advice from Dayspring or my doctor would probably still be to increase the statin dose. The consensus about LDL and about statins is so powerful, I dare not defy it now.
Sorry to hear you’re having trouble getting advanced testing done. It’s not that statins are “bad,” it’s just important to be sure they are being used on the right patients, and for the right indication.
Hi Jane, did you have your sterol absorption and synthesis markers tested? You could be a hyper-absorber. Also, some people suggest that apo-E folks might need to watch saturated fat. Best wishes!
Apo-E 4, to clarify.
Thanks Maryann,
The absorption ans synthesis markers are also outside the range of my HMO system. I have yet to even pursue the more detailed lipid testing.
And I do not know about my Apo E status, or anything about its heritability. That is the “Alzheimer’s” set of genes, isn’t it? Dominant or recessive?
In any event, we can only control our own choices anyway, and just the idea of dementia is enough to motivate me!
Peter,
Thanks for emphasizing that point. I should make some more calls, perhaps drive farther, to get that testing. But wouldn’t I need an order from an MD?
Yes, your doctor will need to coordinate. Sometimes they are unaware of the tests (and not sure how to interpret).
Hi Jane, ApoE-4 is primarily a cardio risk marker (although there are associations with alzheimer’s risk, as you mentioned). Jimmy Moore has a lab he uses for independent testing, perhaps you might like to look into that. Best wishes, maryann
Your Ted Talk was So Very Intense! I’ve lost 60 lbs in the past year, I’m 6’2″ and most people didn’t notice but the more I loss, the higher my glucose count (GC) got. I take 2000mg of Metformin a day to stay at or under a GC of 150.
A friend linked me to your talk and to be honest, then and now, I’m fighting back such an emotional wave that my eyes won’t stop watering.
The bottoms of my feet, especially my toes, feel like my socks are bunched up in my shoes, even in my sandals.
Is there anyway possible that I can be a part of your studies?
Phil, thank you for your kind words. NuSI doesn’t run the studies, but the investigators will be enrolling patients over the coming months and years. Look for it.
Hi Peter,
I signed up for emails from NuSi when you first launched and have never received any…have there been none?
Thank you, maryann
We’ll get there.
Hi Phil,
I’m a Type II diabetic, and I’ve done my own research and self-experiementation because I can’t tolerate Metformin. It gives me severe brain fog. One thing I learned is that it is possible to get your glucose intake so low that your liver will actually put out more glucose to compensate. Eating some carbs before bed prior to your fasting glucose test might improve your numbers.
Dear Peter,
I must not have been reading carefully enough, but I must have missed the point that the same enzyme, hmg coa , in critical in both the synthesis of cholesterol in the liver AND the synthesis of ketones. And, it is active in both the mitochondria and the cytoplasm. And, via the cholesterol path, it is key to steroidal synthesis, which may be upregulated when stress is high. It would thus seem to be key to both normal steroid regulation, such as sex hormone balances, and to emotional and cognitive health via cortisol and brain-based synthesis of various proteins in the brain.
Please correct me if I am wrong here. Am I confused or off track here? ( No doubt, I lack the basic knowledge of biochemistry and physiology necessary to sort through this.)
If not, Can you direct us to a source that discusses both the ketone and the cholesterol pathways and how they are balanced in humans?
This is the enzyme targeted by statin drugs, such as atorvastatin, simvastatin, pravastatin, etc. which are so widely prescribed to prevent heart disease (and other consequences such as strokes, multi-infarct dementia, . . . ).?
Can you direct us to a good source discussing the several roles of this hmg coa enzyme in humans?
What about the statins? Where can we educate ourselves about their effects, both theoretical and demonstrated?
I have run across commentary online positing their possible role in depression and diabetes, but have not found a good review article about these issues. The internists seem to be so focused on vascular health, that they cannot even think about all the other cascades of effects in their patients.
Thanks again so much for your work.
Jane, pretty elaborate discussion. The data linking statins to other diseases are interesting — and my have some merit — but they are observational, so we can’t parse out cause and effect. For a great set of reading on this, check out the work of Tom Dayspring, which can be found at LecturePad and fhit.org
It was Dayspring’s discussion of number 291 on LecturePad (which, of course, I learned about from you) that explained to me the metabolic pathway for potential (well, actual for me and case 291 and many others ) connection between a ketogenic diet and an observed increase in LDL-C.
Then I began to riff, mentally, about other sites for cholesterol synthesis and other theoretical effects of ketosis, statins,. . . .
When Dayspring discussed saturated fats, he mentioned coconut oil. But, it was not entirely clear to me what he meant about it: the long- vs medium- vs short-chain fatty acids and whether some of us make more apoB or LDL-P from coconut oil. . . . Doesn’t coconut oil include some long-chain FA? I will have to look that up.
The more I learn, the more questions I have! To me, this is really fun. But oh my, it is sedentary.
As to the observational studies, the ones I have run across are at least longitudinal, not cross-sectional, and do control for other potential confounding effects. Not gold standard RCTs, but worth considering. Certainly hypothesis-
But my memory is far from perfect. . . . I am on a statin after all!
Jane and Dr. Attia — belated thanks for your replies and information. I’ve been studying the protocol supplied by Benjamin Lynch (if anyone here has searched on “MTHFR,” his website will come up). Again, I’ve had the MTHFR677 TT genotype identified. I will look into Deplin once I retest in a few months. Perhaps the subject of methylation does not belong in the Cholesterol discussion, but surely it is all related: CHO, hormones, neurotransmitters – our health, happiness and productivity! Thanks again.
Dr Attia,
Many thanks in advance for your response and the incredible resources of your site and intellectual generosity. 58 yr old female, athletic, normal weight. I have recently been diagnosed as homozygous for the MTHFR 677 mutation (elevated risk of CAD and thrombosis, low SAM-e) w high homocysteine, high TC, excellent ratio. Low-carb, “high” fat for 25 years (except when I fall, FALL, off the wagon) after diagnosis of hyperinsulemia. Supplementing w 3 mg Naltrexone for app. 9 months which has helped with what I absolutely feel is a sugar addiction since adolescence – years of trying to self-medicate for what I now know is low dopamine, serotonin, and resultant high excitotoxins. The more I read, the more I believe that all of my imbalances stem from the MTHFR mutation. Just started on 1 mg daily each methylcobalamin and l-methylfoate. Beginning to work w Alan Magaziner in NJ — any direction to specialists in this area highly appreciated.
Mayda, MTHFR mutations can be pretty common, but of course it depends on C/C, C/T mutation, etc. Perhaps the most important implications are 1) do you require additional folic acid supplementation? and 2) are you at greater risk for thrombosis? Given the mutation, your elevated homocysteine may be due to folic acid utilization, rather than inflammation.
This is a fascinating subject, Mayda. Thank you for bringing it up. I am deeply sympathetic to your plight as a sweets addict.
I think that the brain chemistry involved in the overeating problem, now a pandemic, needs a lot more attention. Robert Lustig clued me into it in his talks on YouTube.
Peter, I hope that NuSI addresses the various hormones involved in appetite, beyond the perhaps more indirect roles of blood glucose and insulin in eating regulation and body comp homeostasis. Now that we know about how common the MTFHR genetic variation is in some populations, and are generating good questions about its consequences in our current food environment, it seems clear that more research is needed there too.
Mayda, I have a little comment about your folate treatment, related to one of your supplements and Peter’s point (1).
This is sort of a “for what it’s worth” comment.
I know very little about it, but have heard and read that the FDA has actually approved as a medical food an l-methylfolate brand-named Deplin. It is very expensive, and not covered by insurance as far as I can tell. It comes in dosages of 7.5 mg and 15 mg. I believe that I read that it was the 15 mg dose that was shown to be effective in treating depression, at least in the one or more trials that the FDA considered.
I know someone who takes it and testifies to its effectiveness. That’s why I looked it up.
I just thought you might want to know about the fact that Deplin is supplied at doses much higher than the 1 mg that you report taking. (I know nothing about the other supplement you mentioned.)
It certainly seems plausible to me that smaller doses might be helpful, and it makes sense to me to try the more minimal intervention first. After all, folic acid supplementation typically is at 0.4 to 0.8 mg levels.
Mayda, I do hope that you will continue to contribute here, and let us know how you are doing and whether the supplements seem to be effective for you. I believe that there are millions of folks who share your plight, and if we can prevent the decades of suffering . . . .