Video
Watch a brief video overview of how to read screening tests for COVID-19.

Spreadsheet
Download the interactive spreadsheet featured in the video (as an .xls file).
Primer
Read a primer on how to understand and interpret screening and diagnostic testing.
Diagnostics in context
- Sensitivity, specificity, PPV, and NPV shouldn’t be judged in isolation
- Blindly sending a “you tested positive for cancer” letter, for example, to 500,000 random people is guaranteed to have 100% sensitivity!
- The fact that this test is 100% sensitive is useless in light of it having 0% specificity
- It has zero SnNout (i.e., the ability to rule out cancer with a negative test)
- Conversely, if a sensitive (Sn) test is negative (N), rule the diagnosis out (OUT) (i.e., SnNOUT, rule it out)
- Likewise, blindly sending a “you tested negative for cancer” letter, to 500,000 random people is guaranteed to have 100% specificity!
- The fact that this test is 100% specific is useless in light of it having 0% sensitivity
- It has zero SpPIN (i.e., the ability to rule in cancer with a positive test)
- Conversely, if a specific (Sp) test is positive (P), rule the diagnosis in (IN) (i.e., SpPIN, rule it in)
- Diagnostic measures help determine if screening tools are effective at detecting when cancer is present or not
- These measures can be misleading when evaluated in isolation; context matters
True, False, Positive, Negative, Sensitive, Specific…
● “True” or “False” is another way of saying the test is correct or incorrect.
● “Positive” or “Negative” is another way of saying detected or not detected.
● “Sensitivity” is the true positive rate: it represents the percentage of people with cancer who are correctly identified as such.
● “Specificity” is the true negative rate: it represents the percentage of healthy people who are correctly identified as such.
Therefore, in the context of cancer screening:
● True positive: a positive test in a person with cancer (i.e., truly detected)
● False negative: a negative test in a person with cancer (i.e., missed detection)
● True negative: a negative test in a person without cancer (i.e., truly not detected)
● False positive: a positive test in a person without cancer (i.e., false alarm)
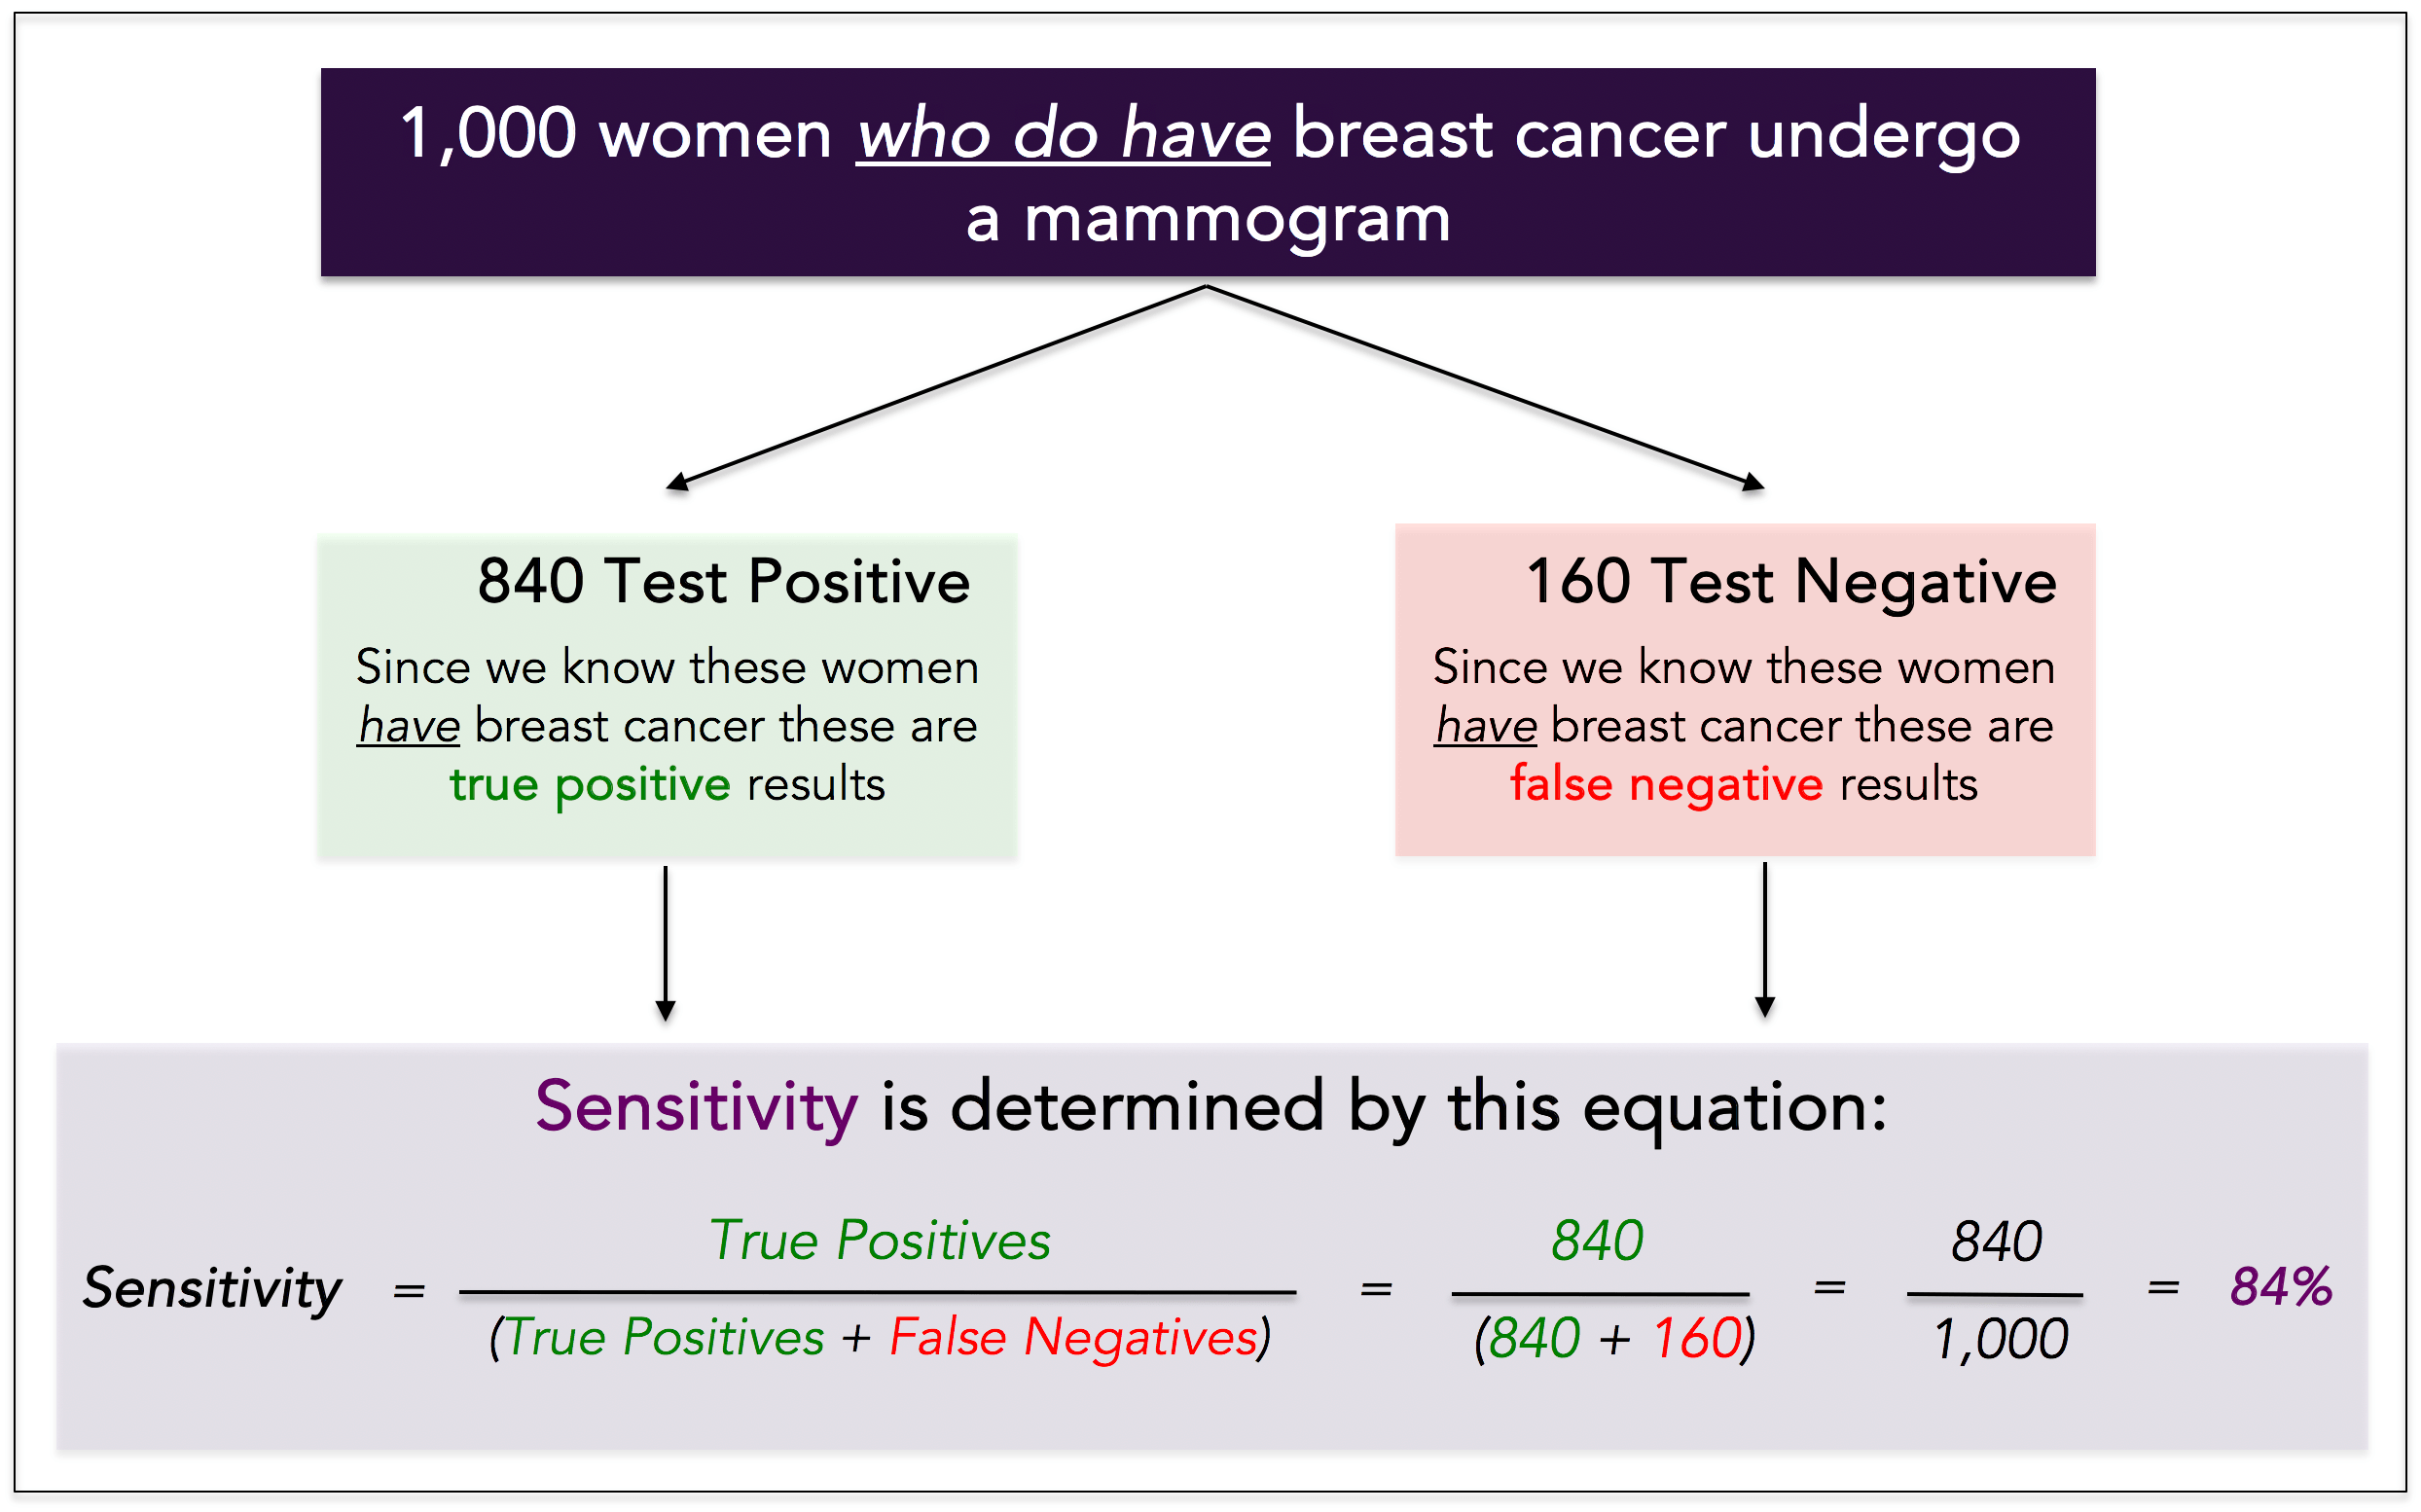
Sensitivity
Sensitivity is the true positive rate, or probability of cancer detection in someone we know has cancer.

To determine the sensitivity of a test, we must know whether the person truly has cancer, which means you need a sample of historical data to calculate it. Example: we take 1,000 women who truly have breast cancer, and we have each of them undergo a mammogram. We see the following results:
● Positive (this is True) test: 840 women = 840 True Positives
● Negative (this is False) test: 160 women = 160 False Negatives
The sensitivity of the test is 84%. It detected 840 out of 1,000 women with cancer.
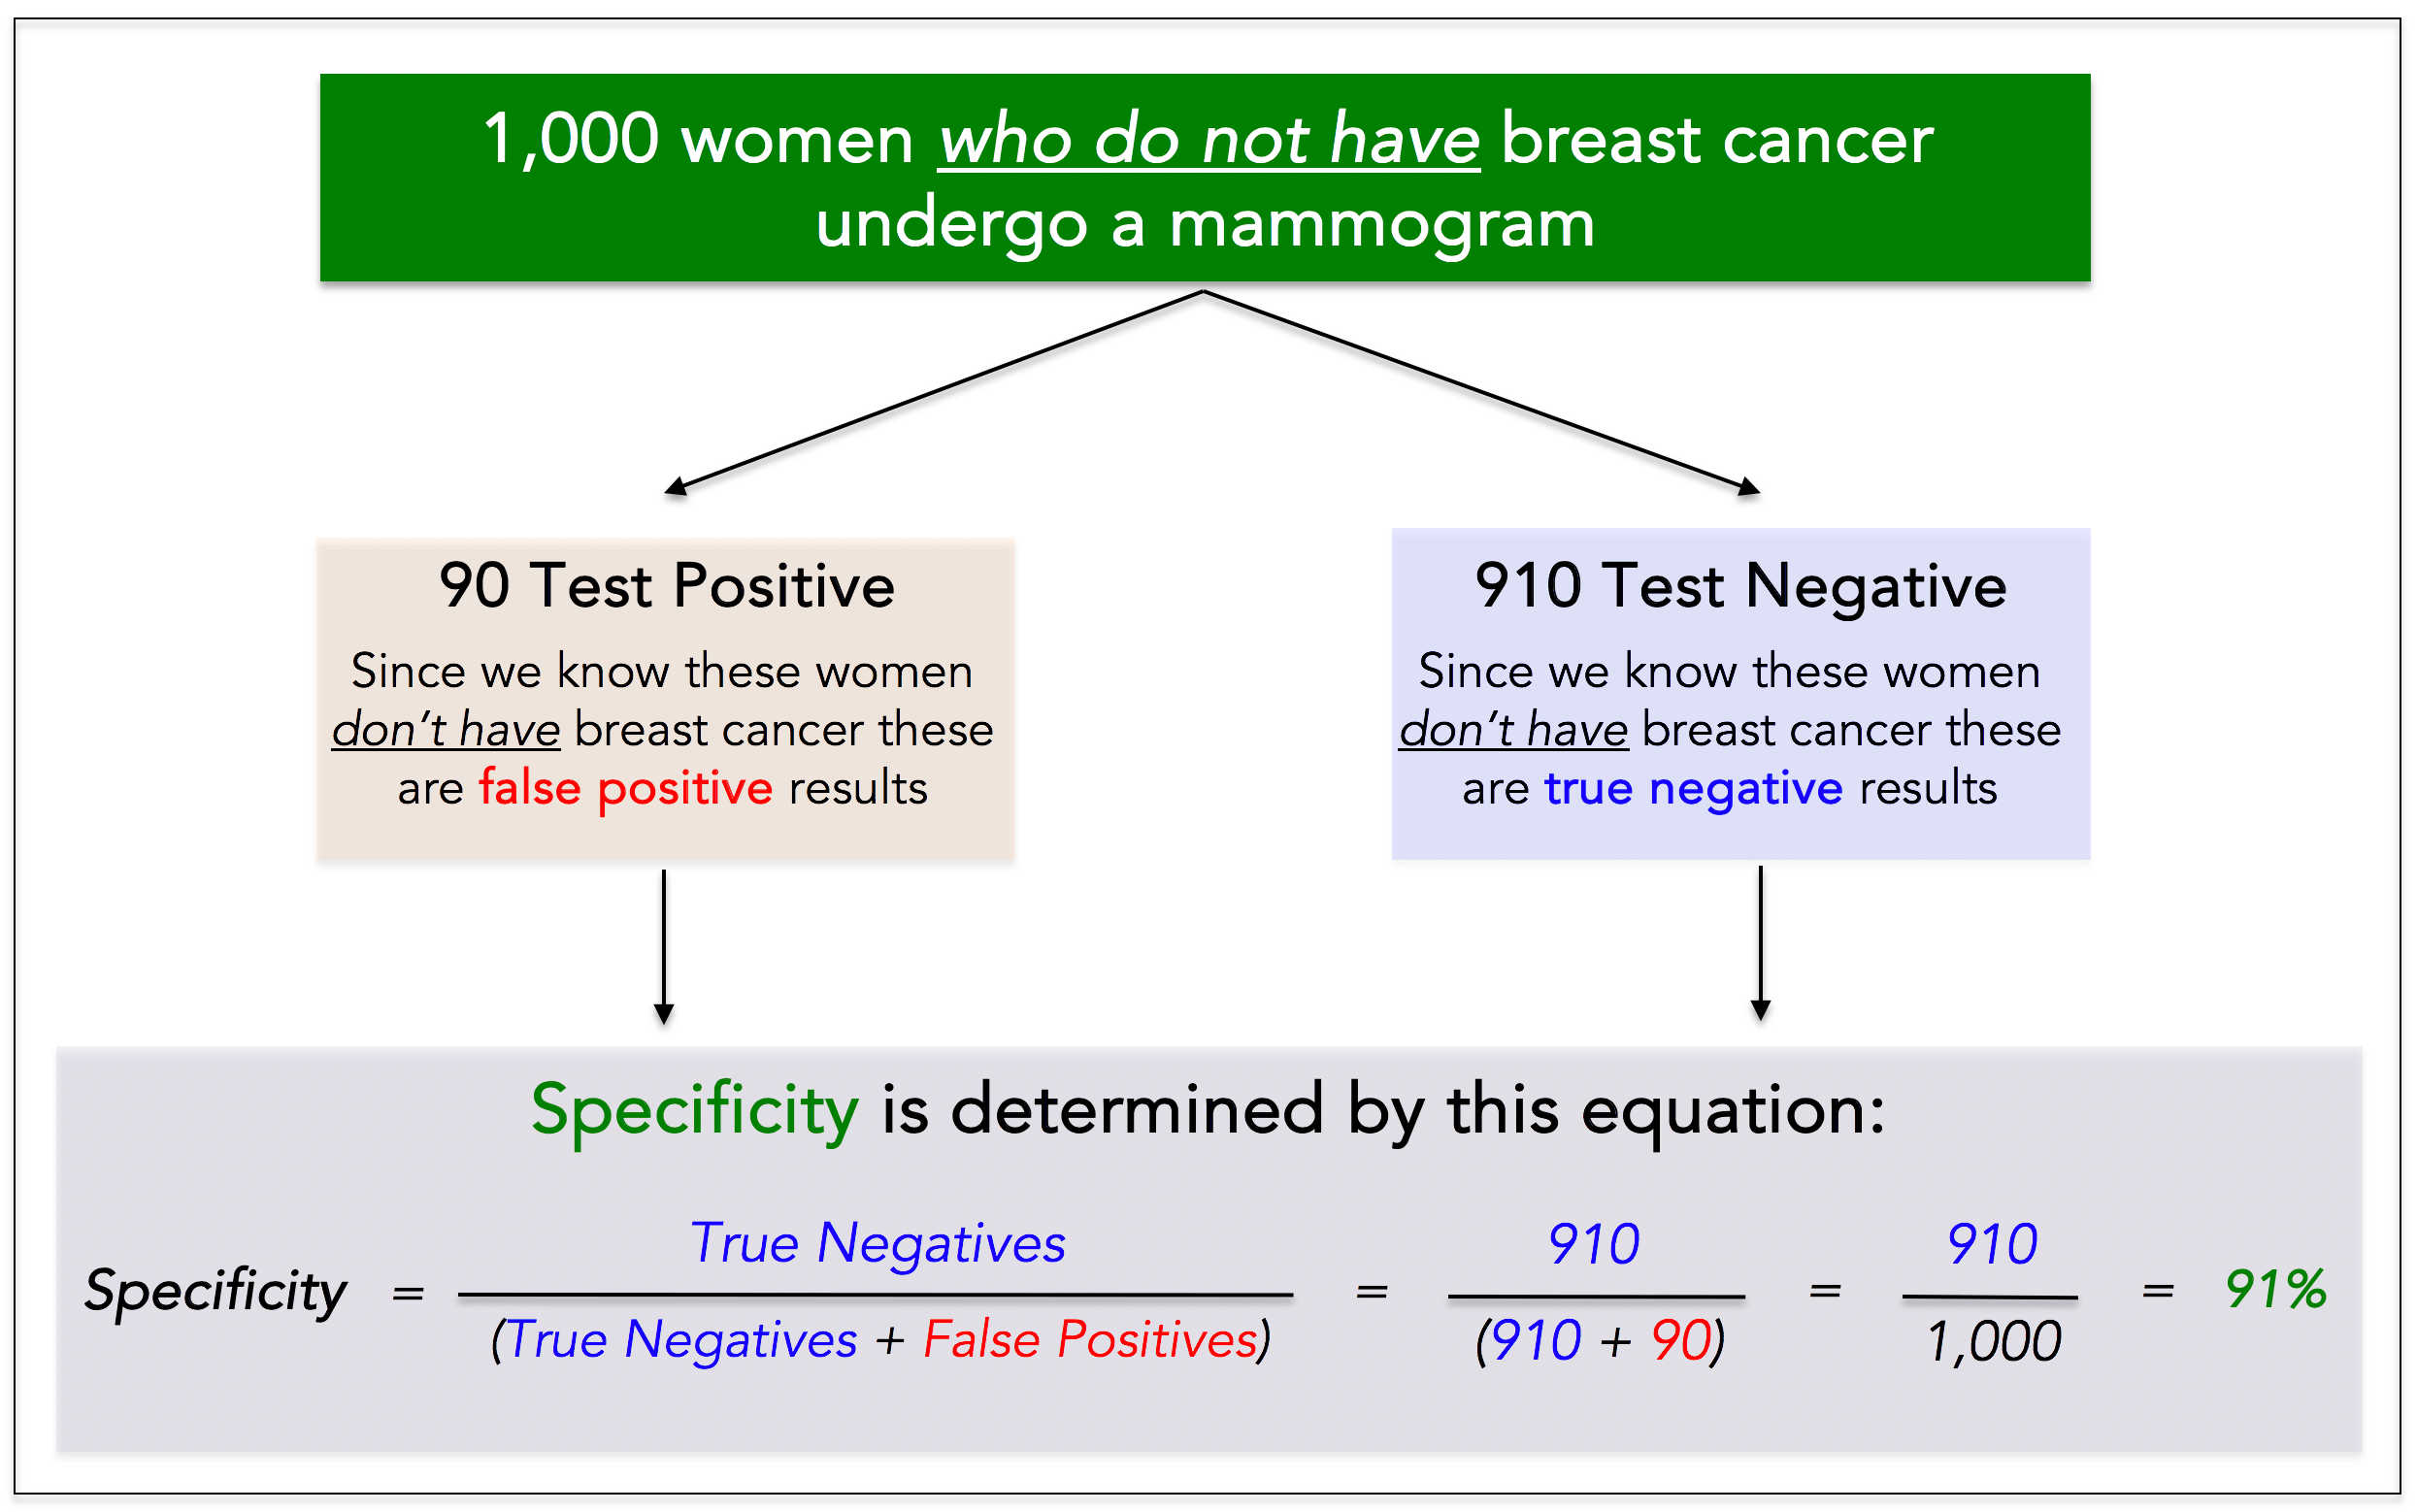
Specificity
Specificity is the true negative rate, or probability that people without cancer are correctly identified as such.

To determine the specificity of a test we must know the person truly does not have cancer, which also means you need a sample of historical data to calculate it. Example: we take 1,000 women who truly do not have breast cancer, and we have each of them undergo a mammogram. We see the following results:
● Positive (this is False) test: 90 women = 90 False Positives
● Negative (this is True) test: 910 women = 910 True Negatives
The specificity of the test is 91%. It correctly identified 910 out of 1,000 women without cancer.
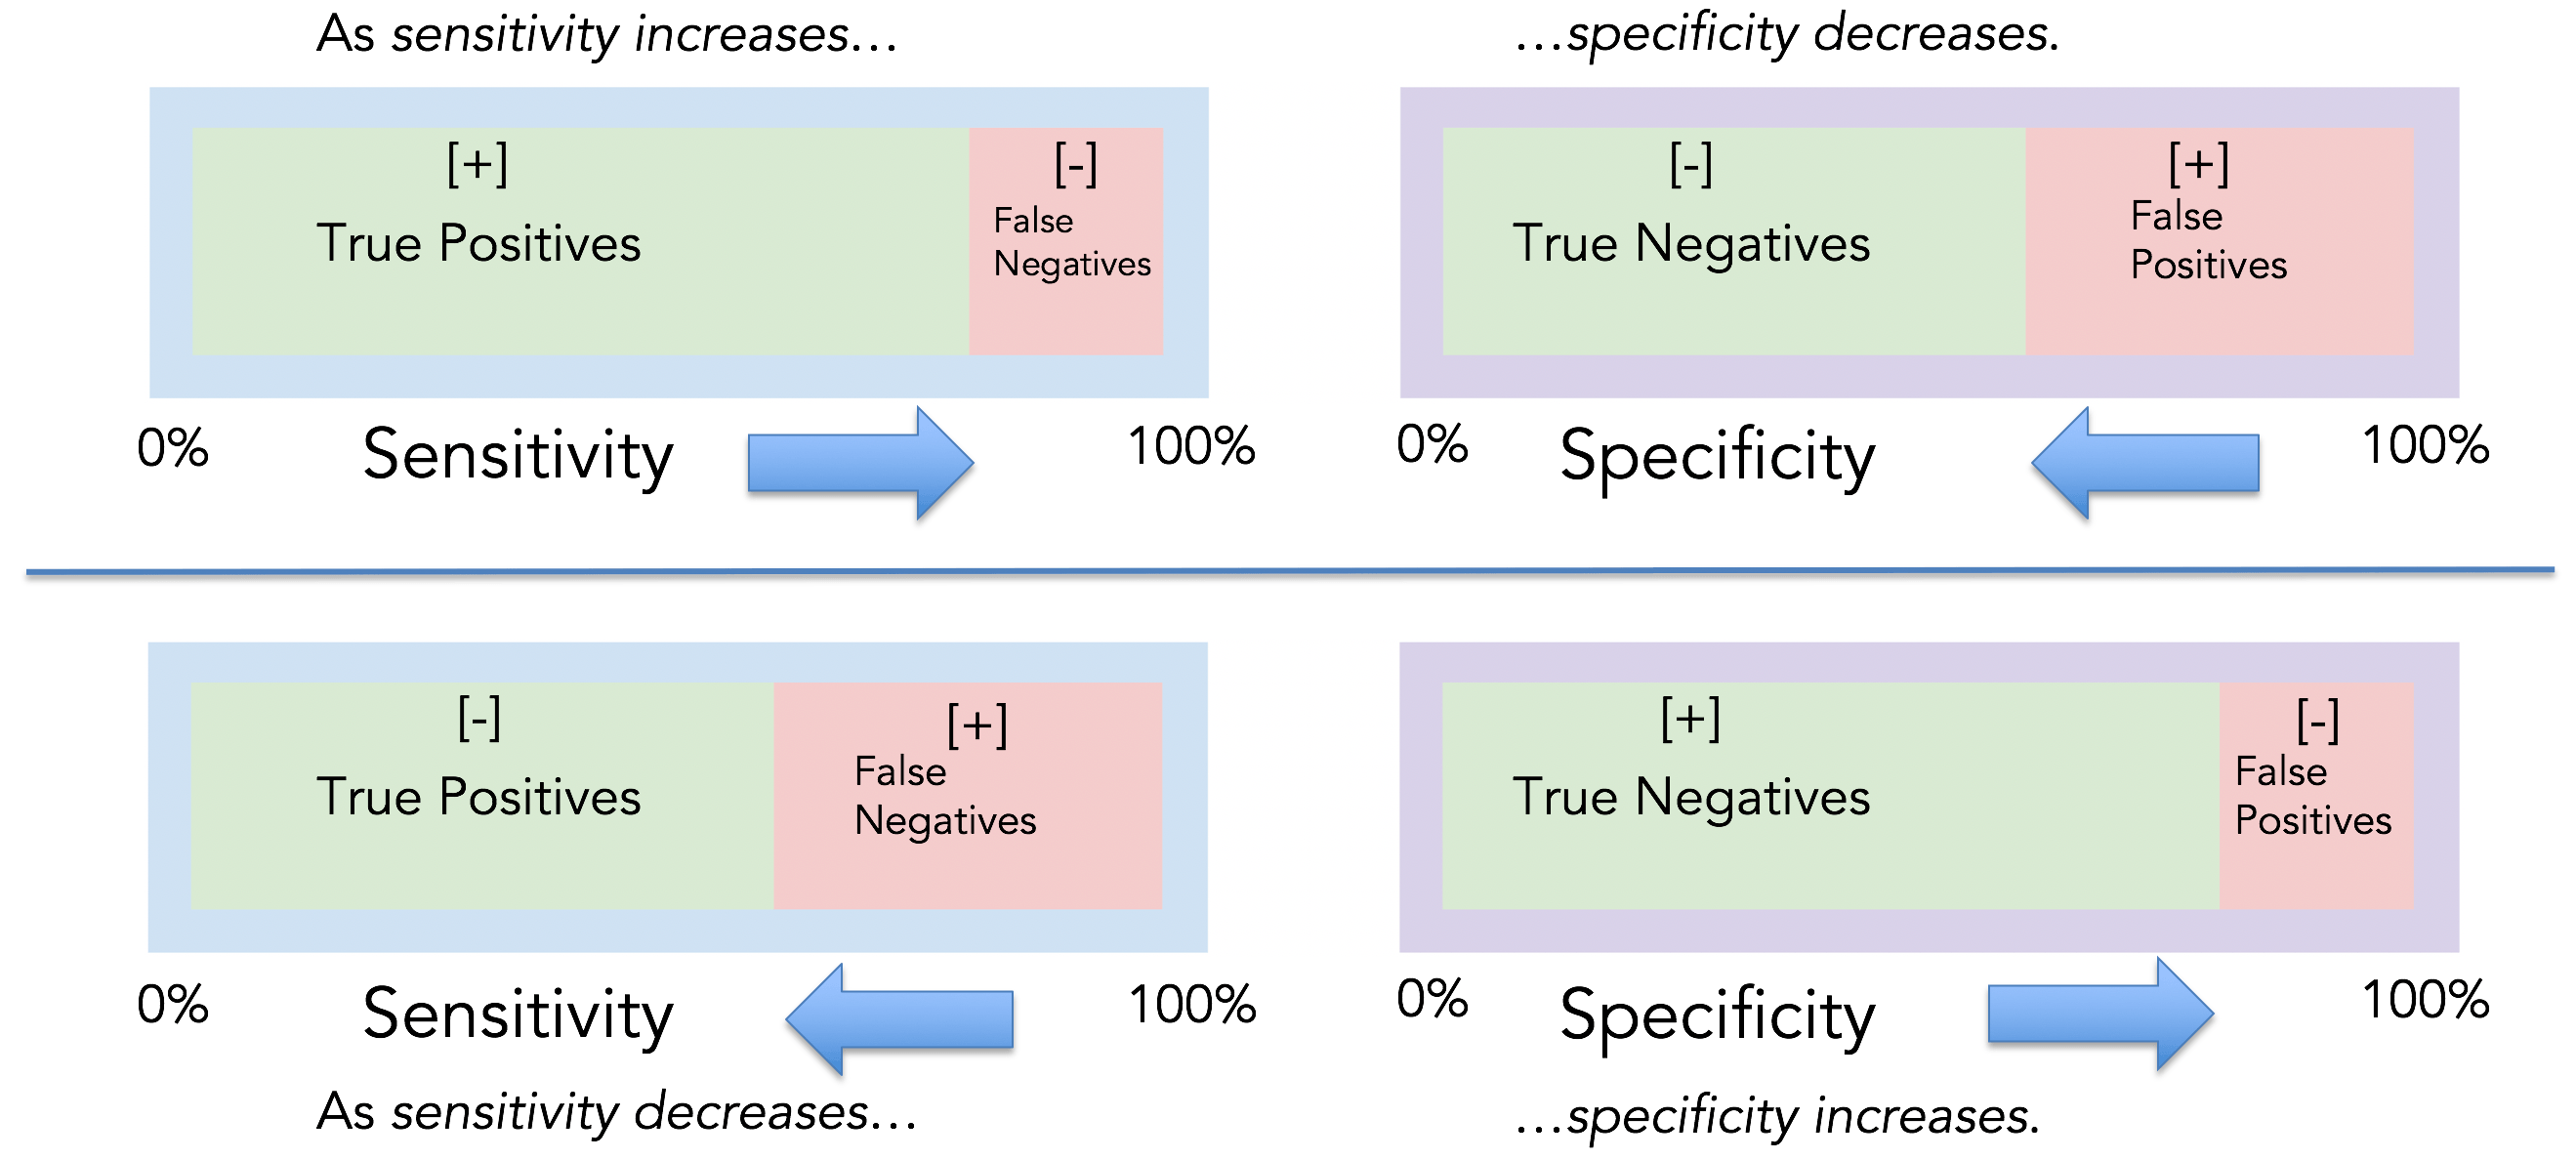
The sensitivity and specificity tradeoff
For any test, there is usually a tradeoff between avoiding false positives and false negatives. For example, in airport metal detectors looking for a gun, if the machine is extremely sensitive, individuals carrying virtually any metal will set off the detector (i.e., low false negatives). However, the more sensitive the test, the greater the risk for false alarms (i.e., high false positives), and therefore the lower the specificity. The higher the sensitivity, the lower the specificity.
The same is true in cancer screening. If an MRI can detect tumors < 1 mm in size, it’s highly sensitive. However, the test is going to be less specific. More false alarms. The opposite is true as well. If an MRI only detects tumors > 5 cm, the test will be highly specific (i.e., low false positives), but have low sensitivity (i.e., high false negatives). The higher the specificity, the lower the sensitivity.
High sensitivity test is more likely to detect cancer when cancer is truly present and less likely to miss cancer when cancer is truly present.

Low sensitivity test is less likely to detect cancer when cancer is truly present and more likely to miss cancer when cancer is truly present.
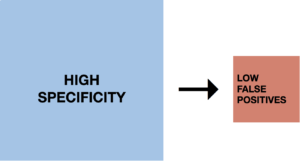
High specificity test is more likely to not detect cancer when cancer is truly not present and less likely to detect cancer when cancer is truly not present (i.e., fewer false alarms).
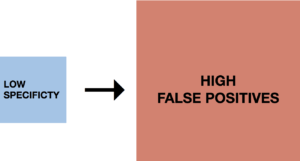
Low specificity test has a lower proportion of negatives that are correctly identified as such and is more likely to detect cancer when cancer is truly not present (i.e., more false alarms).
Predictive values
Positive predictive value: Positive predictive value (PPV) is the probability that subjects with a positive screening test truly have the disease.

Negative predictive value: Negative predictive value (NPV) is the probability that subjects with a negative screening test truly do not have the disease.

Here’s an example: 500,000 people are screened for thyroid cancer with a population prevalence of 0.16%. The screening tool used is ultrasound with 98% sensitivity and 54% specificity.
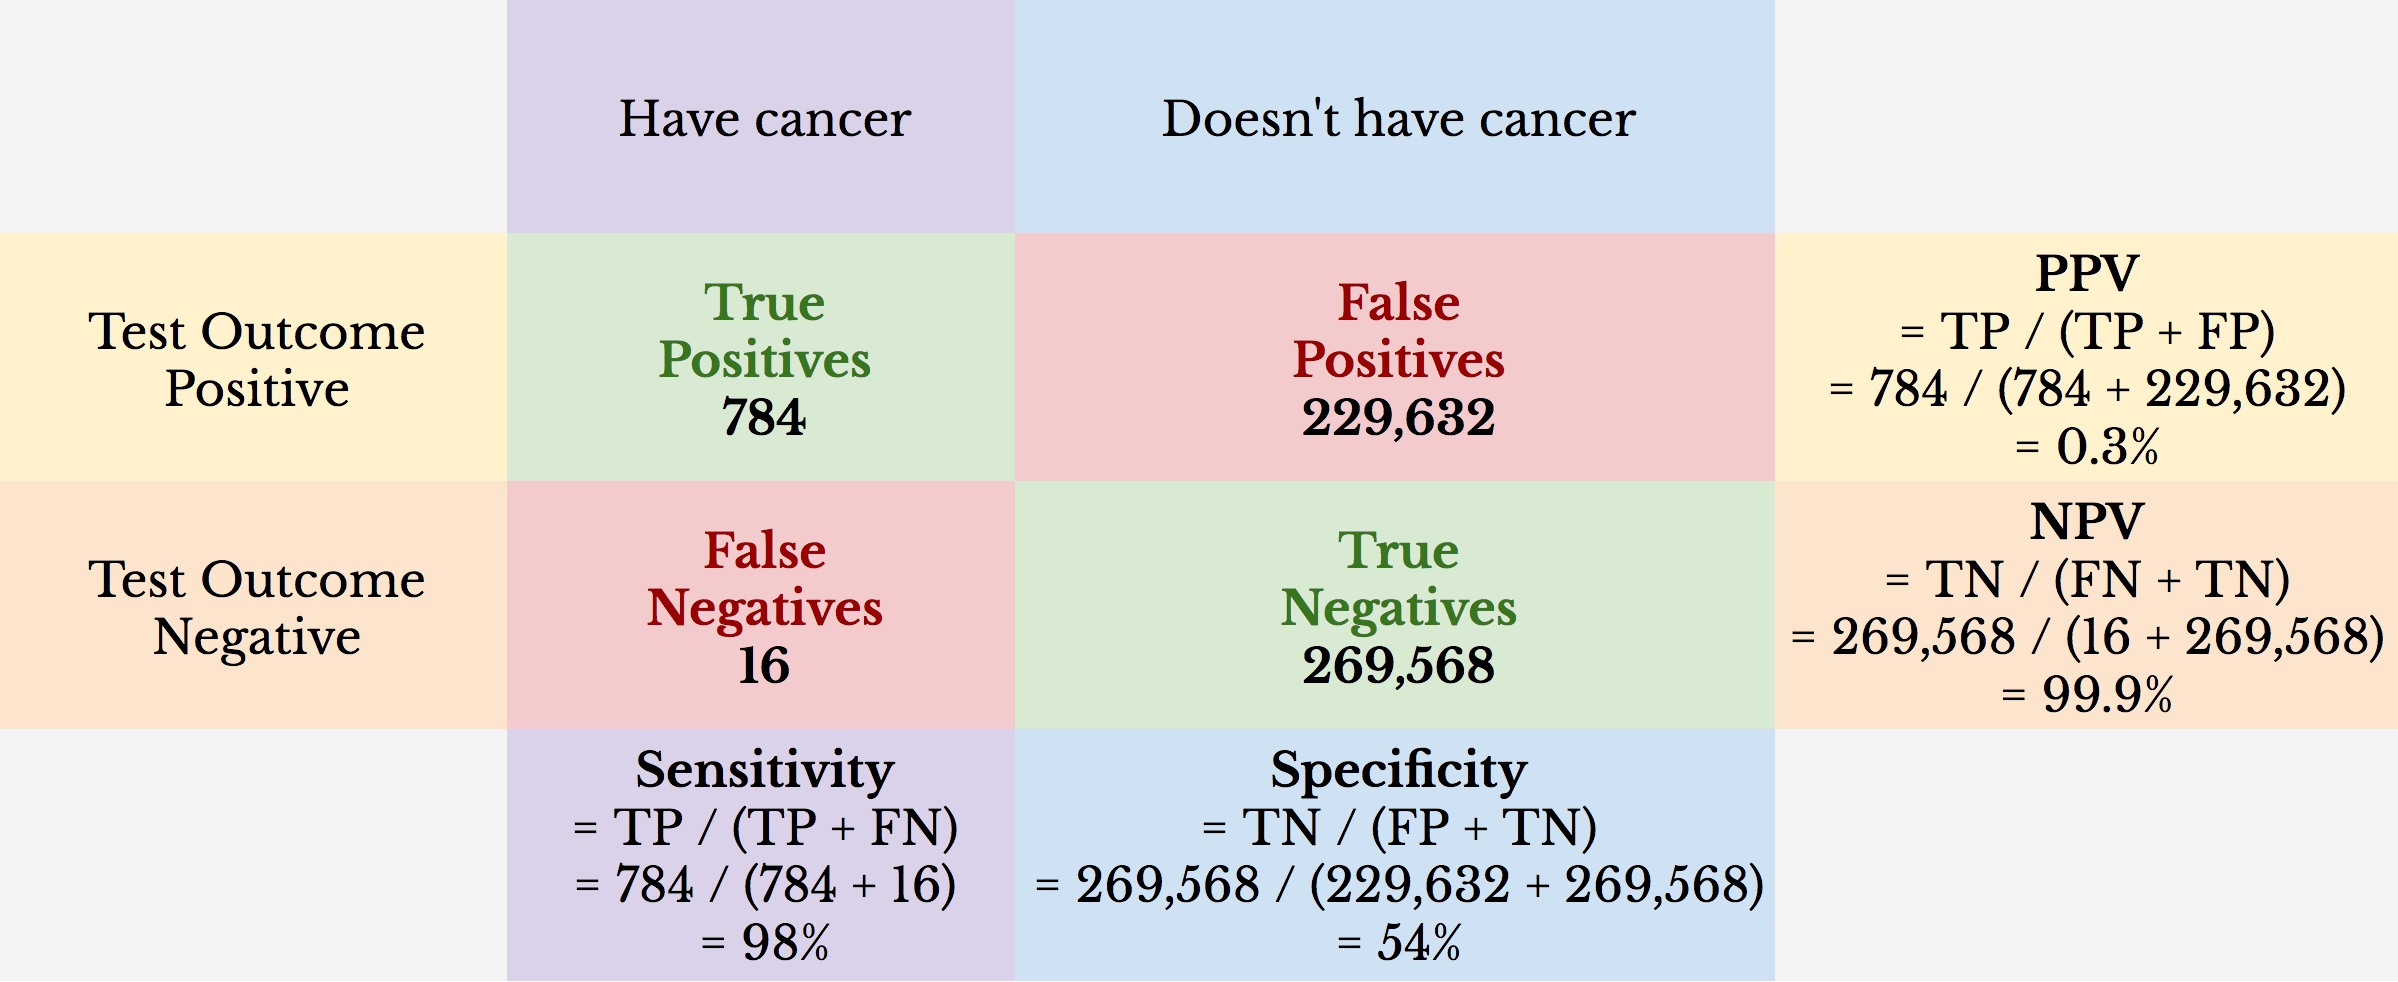
We can see from this example that the NPV is virtually 100%. What it appears to be showing is that if you test negative, you almost assuredly don’t have thyroid cancer. While true, this is misleading. Only 0.16% of the population tested has thyroid cancer. Because 99.84% of the people tested don’t have thyroid cancer, the NPV can’t be less than 99.84%.
We can also see that even with a high sensitivity, which tells us the true positive rate, the PPV is a remarkably low 0.3%. This means that if a person tests positive for thyroid cancer, the likelihood that he or she has thyroid cancer is about 1-in-300, or 0.3%.
Here’s a different example: 500,000 women are screened for breast cancer with a population prevalence of 11%. The screening tool used is Prenuvo MRI with 92% sensitivity and 99.6% specificity.
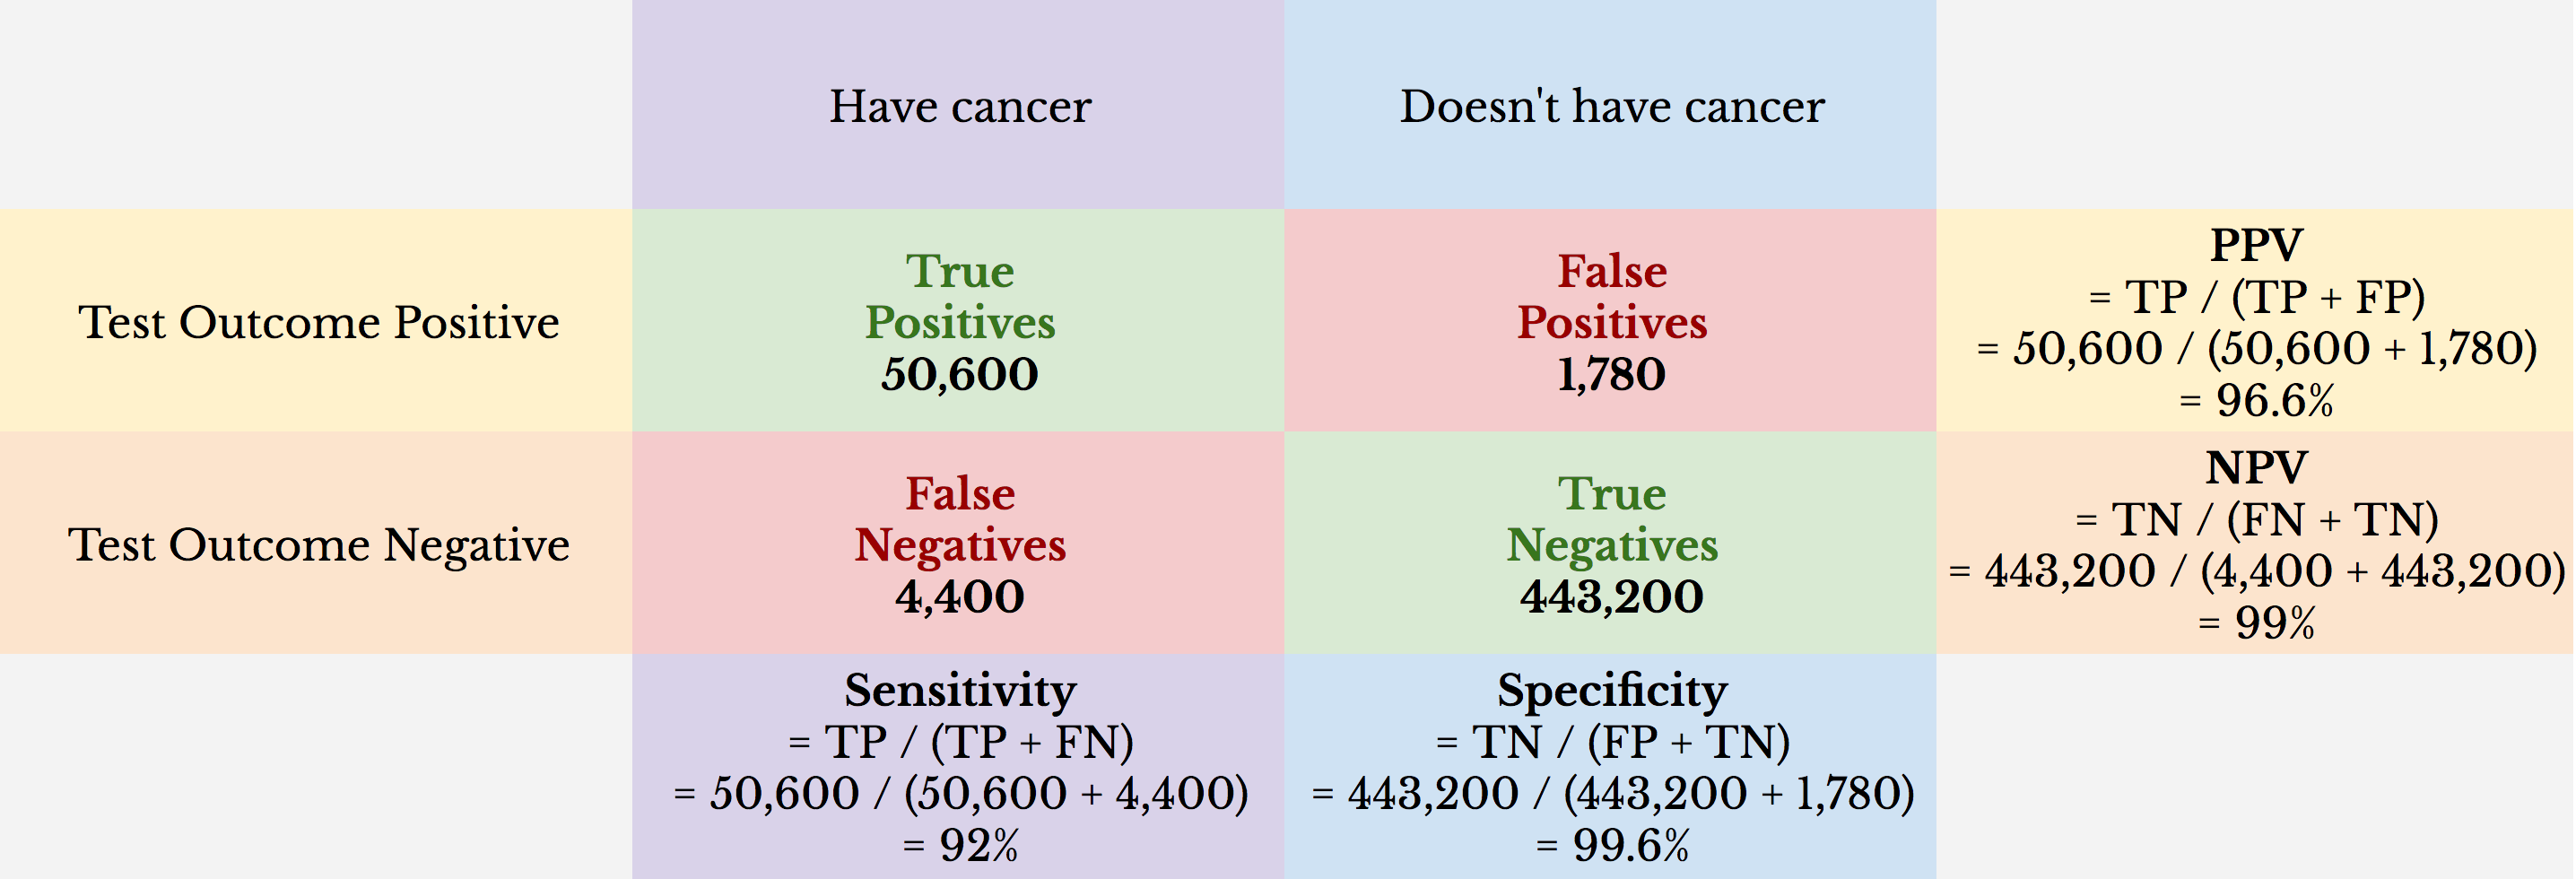
The NPV is 99%. Because population prevalence in this example is higher (i.e., 11%), the NPV is more informative. However, even in this population, the number of false negatives is fixed to a low percentage (e.g., if Prenuvo MRI had no ability to detect cancer, the NPV would be 89%).
The PPV in this example is 96.6%. The probability that a woman has cancer if she tests positive is about 97-in-100, or 97%. In contrast, the PPV for mammography screening, for example, is ~ 10.6%. However, the population prevalence of breast cancer is ~ 1% for asymptomatic women when regular mammography screening intervals are recommended, which skews the PPV lower (e.g., if the population prevalence for the Prenuvo MRI example was 1%, the PPV would be ~ 70%). In this light, the Prenuvo MRI example may represent a follow-up screen for a population of women who had a positive mammography.
Putting it all together
Sensitivity, specificity, PPV, and NPV shouldn’t be judged in isolation. At first blush, it may appear that a test with 100% sensitivity is the perfect test to determine if someone truly has cancer. However, imagine that this test consists of sending an identical letter to 500,000 random postal addresses and informing the head of household that he or she is positive for cancer. This test would guarantee 100% sensitivity: any person in the sample who truly has cancer is a true positive. There are zero false negatives in the sample since no letters informed the recipient that he or she is negative. Therefore, a test with 100% sensitivity can be completely useless in practice without considering specificity. The test would have 0% specificity.
The converse is true as well. Imagine the letter sent to 500,000 was instead a negative letter. It would identify 100% of the true negatives and would yield zero false positives. The test would have 100% specificity. But it would also carry with it 0% sensitivity.
Similarly, in the positive-letter example, 100% sensitivity may be misleading in terms of its ability to predict someone has cancer. If the population prevalence was 0.5%, the PPV would also be 0.5%, meaning the test is no better than, well, sending random letters to postal addresses. The same holds true for the negative-letter example.
Diagnostic measures help us determine if our screening tools are effective at detecting when cancer is present or not. Often, these measures can be misleading, especially when evaluated in isolation. It’s important to look at diagnostics in context.