
Note: This post is not a feel-good-sit-back-and-sip-your-coffee post. At least not if you want to understand it. In fact, I had to print it out, put a spreadsheet together, and build my own model to fully digest it. It took a lot longer than I expected. I don’t expect many of you will want to do that—which is fine, that’s why I’m the one writing this, and hopefully I can save you a lot of time—but if you want to really understand the relationship between cholesterol and blood pressure to heart disease, please accept the need for a bit more mental gymnastics on this one. I promise, it’s worth it.
***
For those interested in human longevity, the prevention of cardiovascular disease has long been at the forefront. Looking at 5-year age groups, from the ages of 40-44 to 70-74, death rates for vascular disease (i.e., heart disease and cerebrovascular disease) is the second-leading killer (or a close first) in the United States, behind cancer deaths. By the time we reach 75-79 and beyond, death from vascular disease begins to take over in a big way. The rates of death rise monotonically to the point where a form of vascular disease is about 10 times more likely to show up on a death certificate of someone 95 years of age or older. Vascular disease is the final common path to death.
To give you more of an idea of what this means, at the ages of 70-74, death rates from vascular disease and cancer are 58 and 73 per 10,000 individuals in the U.S. population, respectively. At the ages of 95-99 death rates are 1,013 and 182, respectively. This is why (just ask my patients) I harp on atherosclerosis so much when talking longevity. And I’m not talking about the nonsense sci-fi longevity like some pundits who claim it’s within their purview to live to 200 or beyond. I’m talking about normal people, sans centenarian genes, trying to make it into their 90s. If this type of longevity is appealing to you, you need to know everything possible about mitigating vascular disease. Oh, and at the other end of the spectrum, we know that half of all heart attacks, strokes, or sudden cardiac death occur in men before the age of 65 and for women that number is about one-third. So this isn’t just about living into your 90s. It’s about escaping your 60s. [For more on this topic, check out “When does heart disease begin (and what this tells us about prevention)?”]
“My final prescription to you for a life of fuzzy thinking and infelicity,” said Charlie Munger at a commencement speech, “is to ignore a story they told me when I was very young about a rustic who said, ‘I wish I knew where I was going to die, and then I’d never go there.’” For all too many of us, vascular disease is where we’re going to die. The question is: can we never go there?
For more than 20 years, Mendelian Randomization (MR) studies have been used to evaluate whether observational data might be related to disease causation. MR is based on the assumption that a genetic variant influences only the variable of interest, and since genetic variants are randomly allocated at birth, MR is less susceptible to confounding and reverse causation compared with observational epidemiologic studies. MR is considered to be a natural randomized control trial because genotypes are passed down randomly from parents to their offspring. (Gary Taubes wrote an excellent article on MR in MIT Technology Review. If you’re not familiar with MR, I strongly suggest you read it now and then come back to this piece if you want to have a better understanding.)
Recently, a group of investigators used MR to study the association of genetic variants related to a lifetime of lower cholesterol in low-density lipoproteins (LDL-C) and lower systolic blood pressure (SBP; the number on top of the blood pressure ratio, corresponding to the pressure in the arteries during contraction of the ventricles of the heart) with the risk of cardiovascular disease (CVD). Genetic variants are also known as single nucleotide polymorphisms, or SNPs (pronounced as snips), which can be discerned by genotyping (e.g., 23andMe) and gene sequencing.
Using genotyping data from the UK Biobank, 438,952 white-ancestry persons (mean age of 65.2 years, 54.1% women) enrolled between 2006 and 2010 and followed through 2018, the investigators compiled genetic LDL-C and SBP scores to split them into groups with inherited lower LDL-C, lower SBP, or both. They then compared the differences in LDL-C, SBP, and major CV event rates between these groups. Major CV events is defined in this study as coronary death, nonfatal heart attacks, or coronary revascularization (e.g., placement of a stent, bypass procedure).
The participants were first divided into two groups by using genetic LDL-C “scores” above and below the median. The genetic LDL-C score consisted of 100 SNPs associated with reduced LDL-C, while the genetic SBP score used 61 SNPs linked to reduced SBP for each person. The more SNPs and individual has, the higher his or her genetic score. Hence, participants with higher (than the median) genetic LDL-C scores (i.e., more SNPs for lower LDL-C) had lower LDL-C. The difference between these two groups was 15.1 mg/dL. The same trend was found for SBP: higher genetic SBP scores, lower SBP. The difference here was 2.9 mmHg.
Participants with genetic LDL-C scores higher than the median (ergo, lower LDL-C) had an odds ratio (OR) for major coronary events of 0.74 (95% CI, 0.72-0.76; p < .001) compared with participants with genetic LDL-C scores at or below the median, which means a 26% relative risk reduction. The investigators noted that this scaled to an OR of 0.46 (95% CI, 0.43-0.48) per 38.7 mg/dL (or 1 mmol/L) lower LDL-C values. In English, for every 38.7 mg/dL reduction in LDL-C, the risk of major CV events was reduced by 54%.
Participants with genetic SBP scores higher than the median (ergo, lower SBP) had an OR for major coronary events of 0.83 (95% CI, 0.81-0.86; p < .001) compared with participants with genetic SBP scores at or below the median, which translates to 17% relative risk reduction. This scaled to an OR of 0.55 (95% CI, 0.52-0.59) per 10 mmHg lower SBP. Again, in English, for every 10 mmHg reduction in SBP, the risk of major CV events was reduced by 45%.
When I read this the first question I had was, “How do the authors know their scaling/extrapolation exercise is valid, since they are going outside the range of their actual data?”
Well, it seems they anticipated this question. To see if the scaling holds up, the investigators sliced up the scores further, into quartiles, to see if the associated risks were dose-dependent. If the participants were grouped into lower and lower levels of LDL-C, did the associated risk of major CV events get lower and lower? Same question for SBP?
Figure 6, below, from the paper (helpful in that it’s a graph, but less helpful in that you can’t really extract the answer I’m after directly) and eTable 4 from the supplement (much more helpful, but you need to stomach a cumbersome spreadsheet), shown below Figure 6, give us some sense of how these two variables impact vascular disease. In fact, eTable 4 is pretty much one of the coolest things I’ve ever seen, notwithstanding the fact that it appears in a gross serif font—Calibri if my eye is not mistaken—reserved for supplements that no one ever looks at.
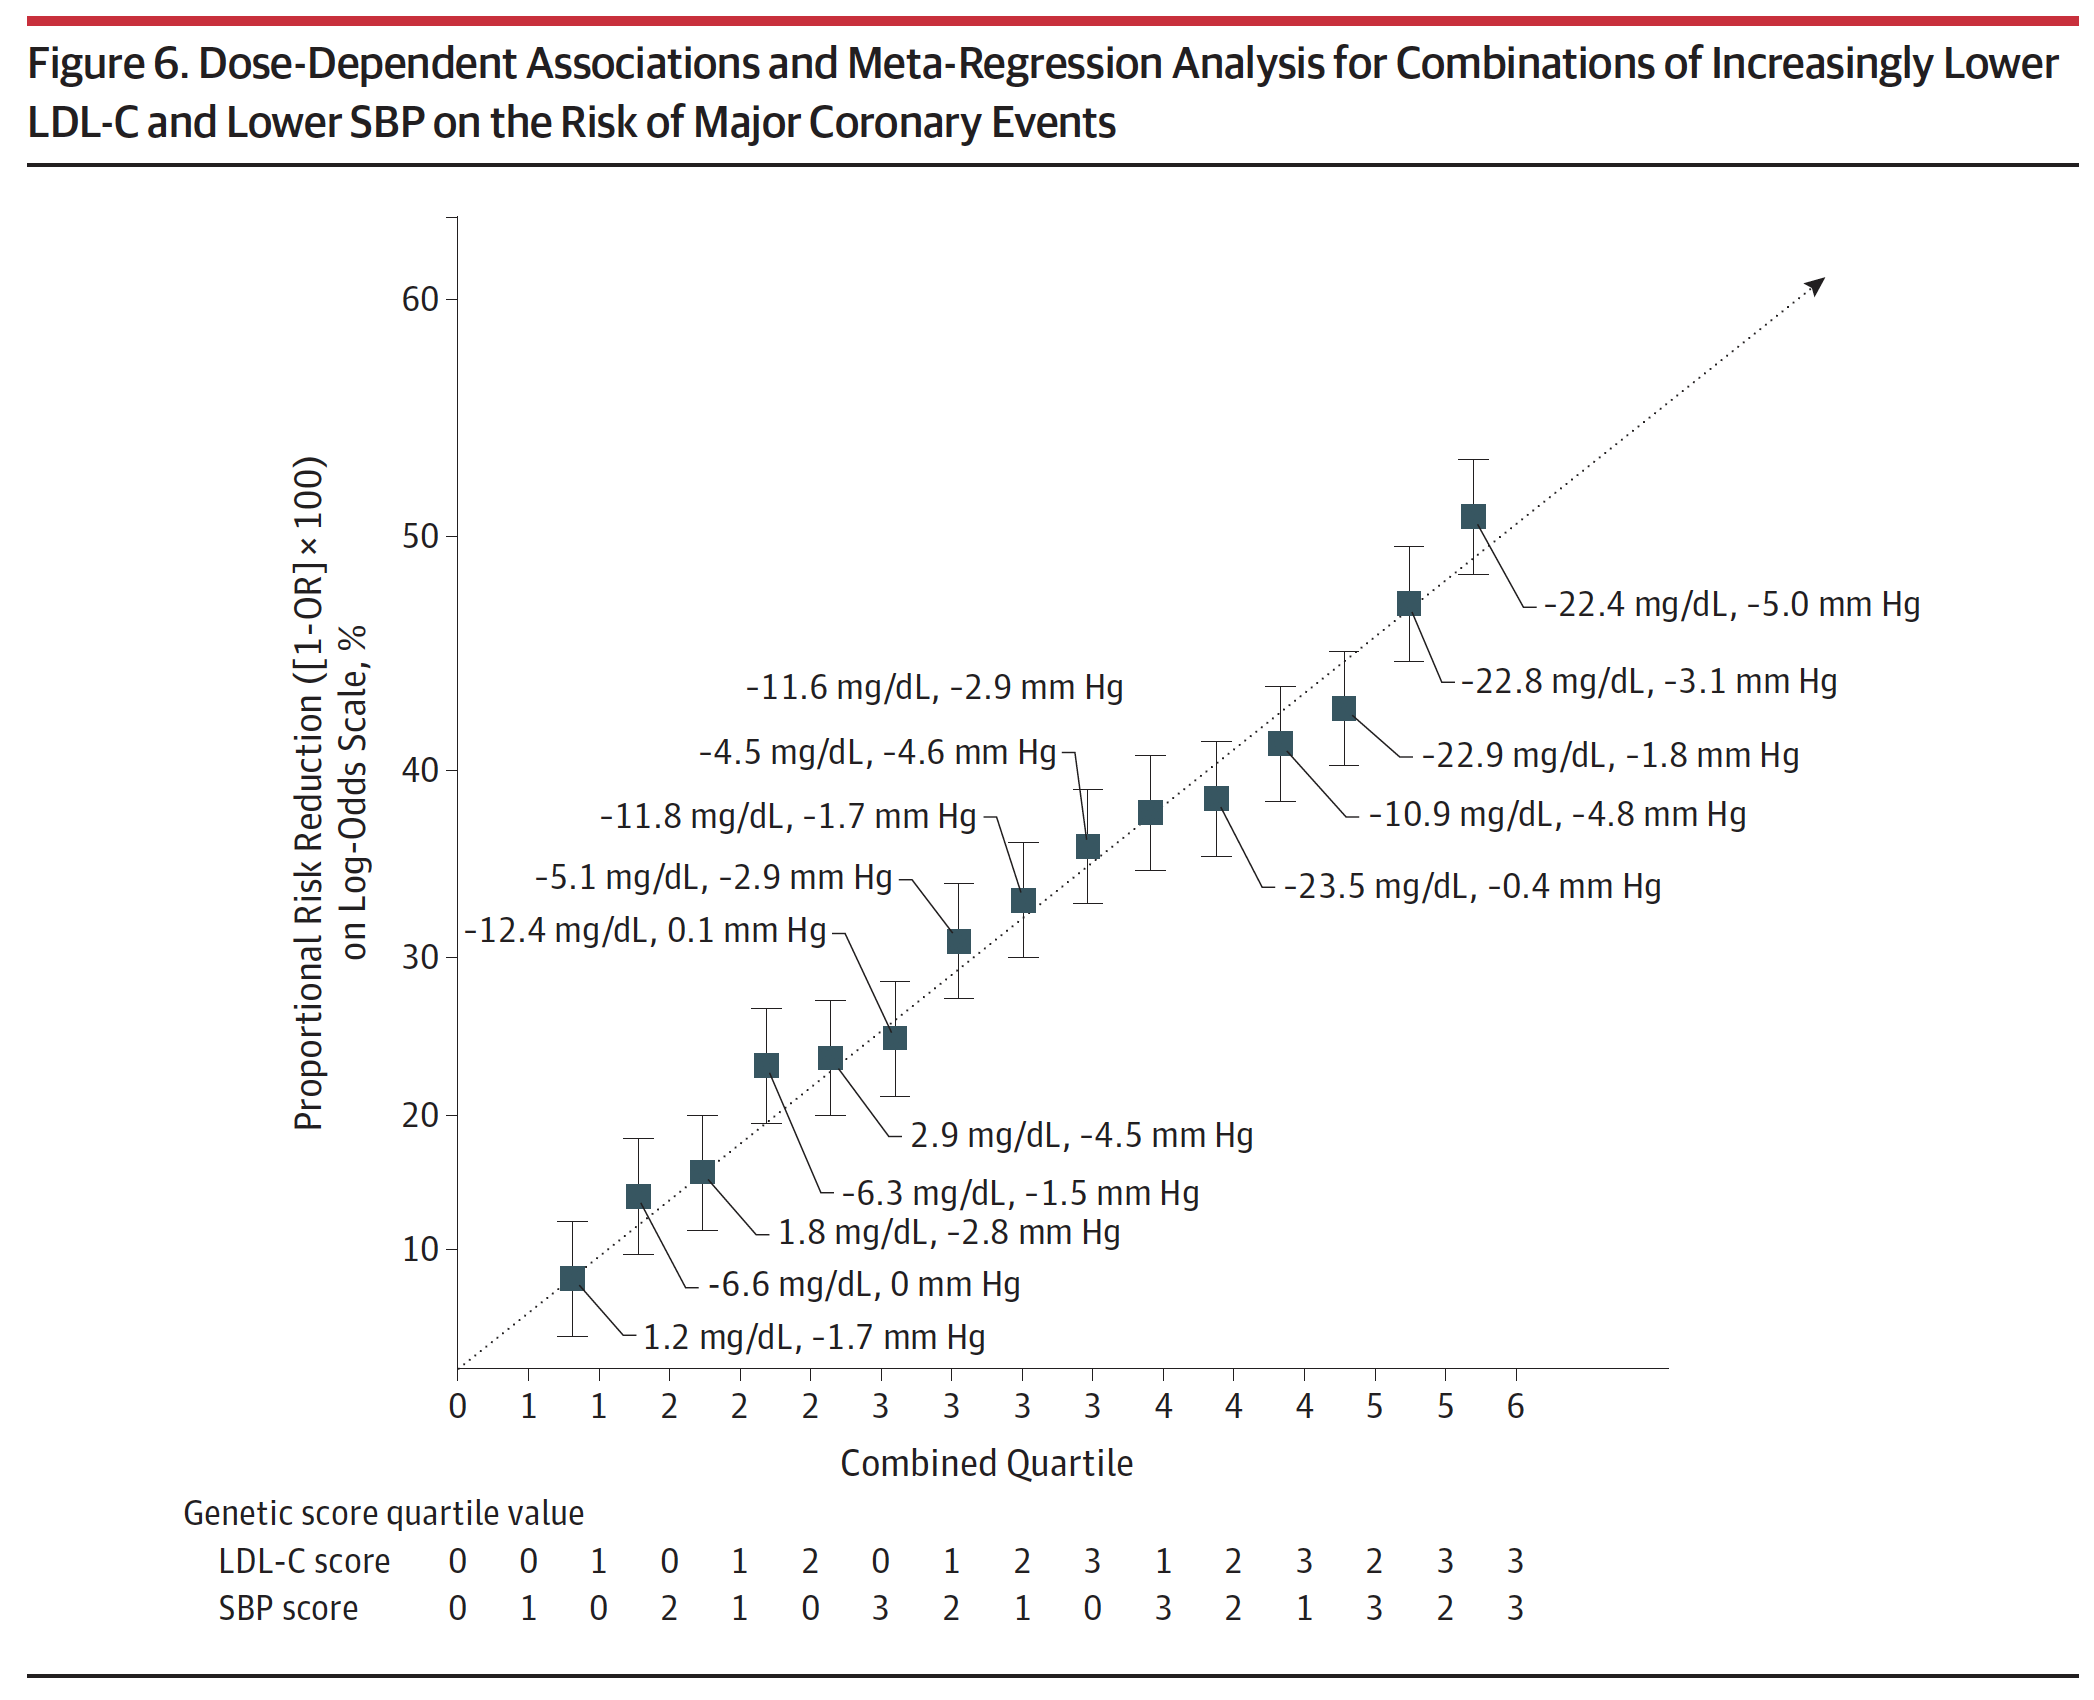
Figure 6. Dose-Dependent Associations and Meta-Regression Analysis for Combinations of Increasingly Lower LDL-C and Lower SBP on the Risk of Major Coronary Events.
Take a few minutes to look at eTable 4. Once you understand the basics, this table is the mother lode of data. I actually plugged the numbers into Excel to play with it and plot various regressions on the boundary cases. Start by considering the extremes: (3,0), (3,1), (3,2), and (3,3) [rows 13, 14, 15, 16]. These represent the people with the lowest LDL-C across all ranges of SBP from least to greatest reduction. You’ll see they all have roughly the same LDL-C reduction (about 22 to 23 mg/dL) and their SBP varies from basically no reduction to a reduction of 5 mmHg. Contrast this cohort with the other extremes: (0,3), (1,3), (2,3), and (3,3) [rows 4, 8, 12, 16]. These represent the people with the lowest SBP across the four quartiles of LDL-C reduction. So even before you look at the table you can guess they all share a similar reduction in SBP (which they do, of about 4.5 to 5 mmHg), while LDL-C drops from basically normal (actually, +2.9 mg/dL) to a reduction of 22.4 mg/dL.
eTable 4. Dose-response analysis of combined exposure to lower LDL-C and lower SBP on the risk of major coronary events.
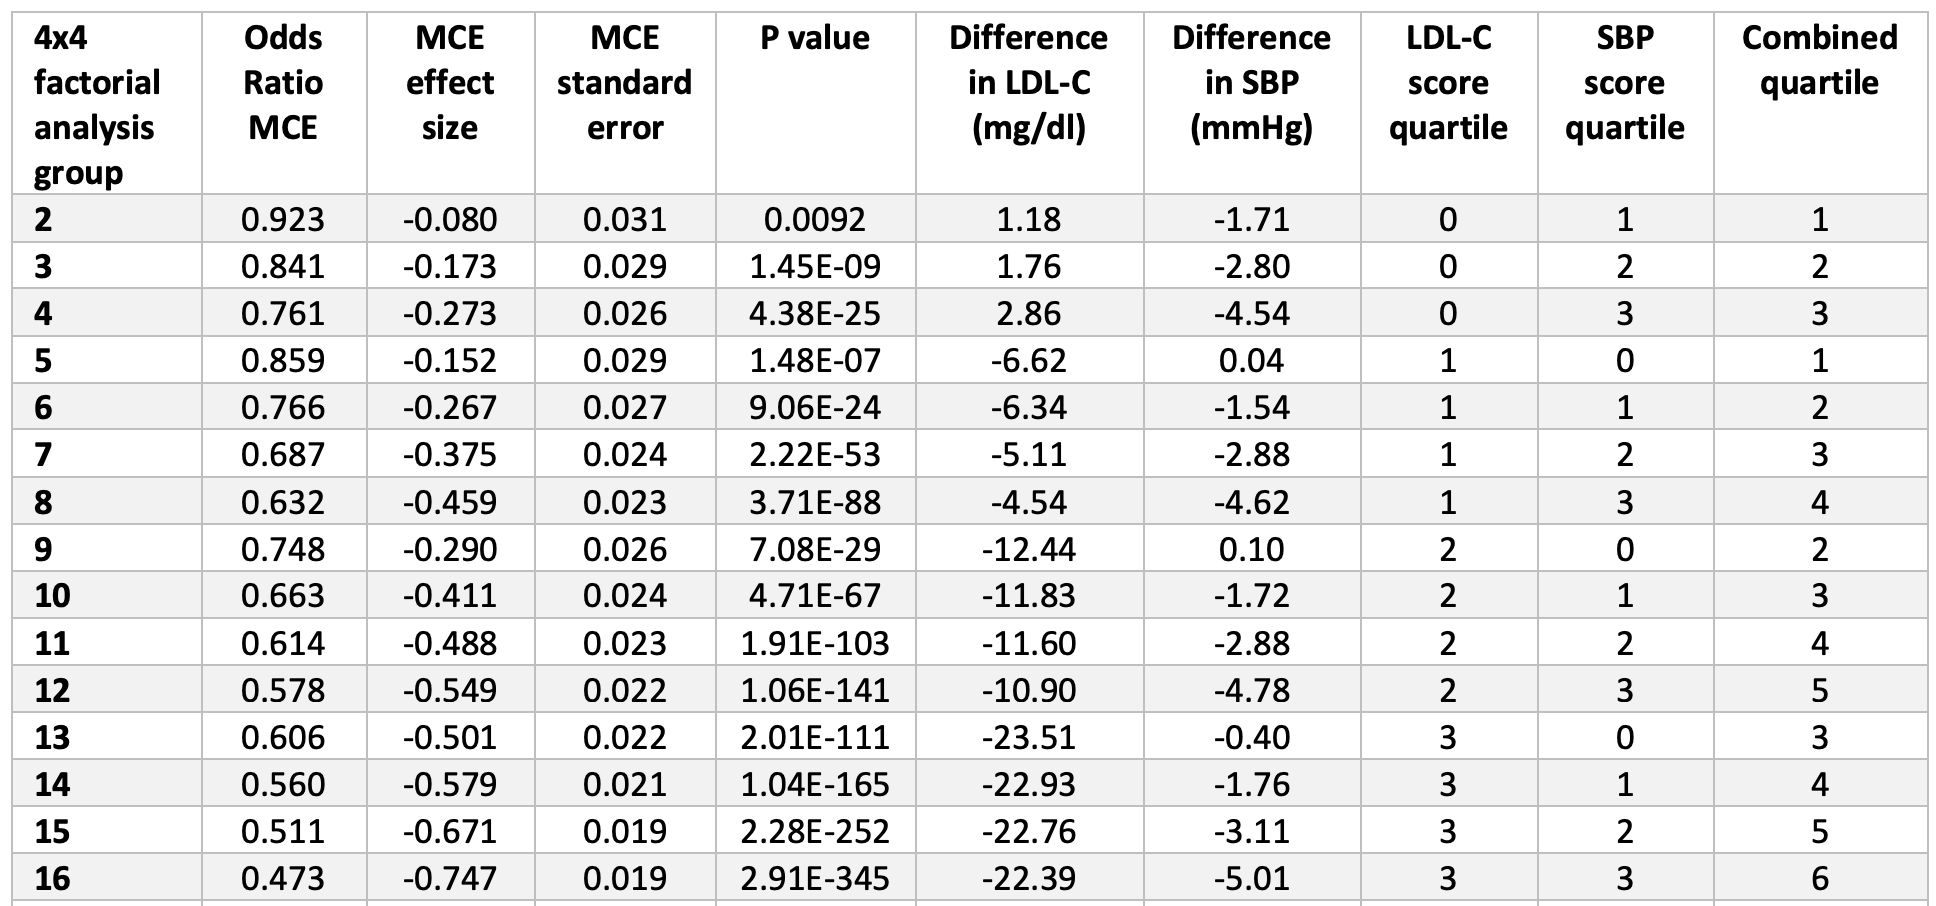
Now, look at the risk reduction of each group (1-Odds Ratio). In the lowest LDL-C group with varying SBP, the risk reduction goes from 39% to 44% to 49% to 53%. In the lowest SBP group with varying LDL-C, the risk reduction goes from 24% to 37% to 42% to 53%. So this suggests the relative magnitude of each, and suggests that LDL-C reduction (in this cohort) is a more potent risk-reducing tool than SBP reduction. But that’s less interesting to me than when you plot the cases, above. The graph of the low LDL-C cohort finds its best fit with either a linear regression or 2nd order polynomial (both curves yield an R-squared of about 0.999). The low SBP cohort is not as linear and finds its best fit with a power curve (yielding an R-squared of 0.988).
This type of analysis actually suggests the extrapolations of the authors might hold (forgive me for being skeptical, but I had to check for myself). Furthermore, the authors note the independence of these two variables—LDL-C and SBP—on vascular risk, at least across the range of their observations.1“In analyses that included the LDL-C and SBP genetic scores as continuous variables,” the investigators wrote, “there was no evidence for interaction between the associations of lower LDL-C and lower SBP with the risk of major coronary events (OR for interaction, 1.00; 95% CI, 0.9996-1.0012; P = .92). Together, these analyses demonstrate that the associations of LDL-C and SBP with the risk of major coronary events appeared to be independent.”
Let’s put all of this into context:
- This Mendelian randomization demonstrates that a reduction of SBP by 5 mmHg and a reduction of LDL-C by 22.4 mg/dL, over the course of one’s lifetime, reduces risk of major adverse cardiac and vascular events by 53%. [And if you play with eTable 4, you can see all other permutations of this—I’m just pointing out the largest one.]
- Because of the frequency of this disease, a relative reduction of this much is also an enormous absolute risk reduction.
- It seems at least plausible that these results can be extrapolated further, which the authors suggest, to a reduction of SBP by 10 mmHg and a reduction of LDL-C by 1 mmol/L (38.7 mg/dL). These yield a risk reduction of 45% and 54%, respectively, and note that these are independent, meaning in each case the other variable is not also being reduced.
- By a nifty little coincidence the greatest boundary case from the actual data, the (3,3) scenario, shows about the same risk reduction as the extrapolated LDL-C without SBP reduction (53% vs 54%).
- Because the effects of SBP and LDL-C were completely independent across the range of their data, the authors go one step further and extrapolate the combined effect of these changes—lowering LDL-C by 38.7 mg/dL *and* lowering SBP by 10 mmHg—and the results suggest an OR of 0.22, or a relative risk reduction of 78%.
- Lastly, in case you missed it, check out the p-values in eTable 4. In the words of J.J. Evans, “Dyn-o-mite!” You’ll likely never see p-values that small outside of MR. MR is no joke since it gets to randomly assign so much genetic material across so many subjects.
I must admit, because of the time and energy that went into interpreting the design and results of this study, I didn’t ask a number of questions that you should always ask when reading studies on exposures and outcomes. For example, what are the absolute risks and are there any confounding variables? Mendelian randomization can provide powerful evidence on mechanisms of disease and trying to determine the potential effects of modifiable exposures and health outcomes, but MR is not immune from limitations. One of the major threats to MR establishing causation is pleiotropy, which is the potential for SNPs to have more than one specific phenotypic effect. What if the same SNP that is associated with lower LDL-C levels also has an effect on some other aspect of CV risk? For example, say it somehow improves endothelial function. We may be fooled into thinking that the SNP confers CV protection because it lowers LDL-C, but it may be protective for some other reason, or its effects on LDL-C may be only telling part of the story.
A good example may actually come from the study we just looked at. If you look at the 100 SNPs used in the genetic LDL-C score, the SNP that had the largest effect size in terms of lower LDL-C levels—a reported -15 mg/dL—happens to be the T allele on rs7412 (the rs number is a reference ID for the SNP). This SNP happens to be part of the APOE genoset evaluation that many people use to find out what alleles they have to determine risk for Alzheimer’s disease (AD). (You inherit two copies, one from each parent, so you fall into the bucket of one of six combinations: 2/2, 3/3, 4/4, 2/3, 2/4, 3/4.) Having one T allele on rs7412 effectively means you have a “2” in terms of APOE status. Having two copies (i.e., rs7412 T;T) means you’re an APOE 2/2, which is associated with a reduced risk for AD. So, if we were looking at AD risk and LDL-C levels in a Mendelian randomization study, it’s possible we might conclude that reduced risk of AD from this SNP is entirely due to its effect on LDL-C levels, when there are a number of other plausible mechanisms (though the evidence is pretty solid that lower LDL-C, which improves vascular health, lowers AD risk by reducing the risk of vascular disease in the brain, which was covered in my podcast with Francisco Gonzalez-Lima).
The point here is that we can still fool ourselves, but MR has the potential to shed more light on potential risk factors for (in this case) vascular disease. No amount of epidemiology could come close to the strength of these associations, the way it did for the relationship between smoking and vascular disease, for example.
I suspect we’ll come back to MR in the future, especially now that we’ve put down a reasonable foundation for probing such studies. For those of you still reading this one, thanks for sticking with it.
– Peter