May 30, 2012

Cardiovascular Disease

The straight dope on cholesterol – Part VI

In this post we’ll address the following concept: Why is it necessary to measure LDL-P, instead of just LDL-C?

Read Time 13 minutes

Previously, in Part I, Part II, Part III, Part IV and Part V of this series, we addressed these 7 concepts:

     #1What is cholesterol?

     #2What is the relationship between the cholesterol we eat and the cholesterol in our body?

     #3Is cholesterol bad?

     #4 How does cholesterol move around our body?

     #5 How do we measure cholesterol?

     #6How does cholesterol actually cause problems?

     #7Does the size of an LDL particle matter?


(Not so) quick refresher on take-away points from previous posts, should you need it:

  1. Cholesterol is “just” another fancy organic molecule in our body but with an interesting distinction: we eat it, we make it, we store it, and we excrete it – all in different amounts.
  2. The pool of cholesterol in our body is essential for life.  No cholesterol = no life.
  3. Cholesterol exists in 2 formsunesterified or “free” (UC) and esterified (CE) – and the form determines if we can absorb it or not, or store it or not (among other things).
  4. Much of the cholesterol we eat is in the form of CE. It is not absorbed and is excreted by our gut (i.e., leaves our body in stool). The reason this occurs is that CE not only has to be de-esterified, but it competes for absorption with the vastly larger amounts of UC supplied by the biliary route.
  5. Re-absorption of the cholesterol we synthesize in our body (i.e., endogenous produced cholesterol) is the dominant source of the cholesterol in our body. That is, most of the cholesterol in our body was made by our body.
  6. The process of regulating cholesterol is very complex and multifaceted with multiple layers of control.  I’ve only touched on the absorption side, but the synthesis side is also complex and highly regulated. You will discover that synthesis and absorption are very interrelated.
  7. Eating cholesterol has very little impact on the cholesterol levels in your body. This is a fact, not my opinion.  Anyone who tells you different is, at best, ignorant of this topic.  At worst, they are a deliberate charlatan. Years ago the Canadian Guidelines removed the limitation of dietary cholesterol. The rest of the world, especially the United States, needs to catch up.  To see an important reference on this topic, please look here.
  8. Cholesterol and triglycerides are not soluble in plasma (i.e., they can’t dissolve in water) and are therefore said to be hydrophobic.
  9. To be carried anywhere in our body, say from your liver to your coronary artery, they need to be carried by a special protein-wrapped transport vessel called a lipoprotein.
  10. As these “ships” called lipoproteins leave the liver they undergo a process of maturation where they shed much of their triglyceride “cargo” in the form of free fatty acid, and doing so makes them smaller and richer in cholesterol.
  11. Special proteins, apoproteins, play an important role in moving lipoproteins around the body and facilitating their interactions with other cells.  The most important of these are the apoB class, residing on VLDL, IDL, and LDL particles, and the apoA-I class, residing for the most part on the HDL particles.
  12. Cholesterol transport in plasma occurs in both directions, from the liver and small intestine towards the periphery and back to the liver and small intestine (the “gut”).
  13. The major function of the apoB-containing particles is to traffic energy (triglycerides) to muscles and phospholipids to all cells. Their cholesterol is trafficked back to the liver. The apoA-I containing particles traffic cholesterol to steroidogenic tissues, adipocytes (a storage organ for cholesterol ester) and ultimately back to the liver, gut, or steroidogenic tissue.
  14. All lipoproteins are part of the human lipid transportation system and work harmoniously together to efficiently traffic lipids. As you are probably starting to appreciate, the trafficking pattern is highly complex and the lipoproteins constantly exchange their core and surface lipids.
  15. The measurement of cholesterol has undergone a dramatic evolution over the past 70 years with technology at the heart of the advance.
  16. Currently, most people in the United States (and the world for that matter) undergo a “standard” lipid panel, which only directly measures TC, TG, and HDL-C.  LDL-C is measured or most often estimated.
  17. More advanced cholesterol measuring tests do exist to directly measure LDL-C (though none are standardized), along with the cholesterol content of other lipoproteins (e.g., VLDL, IDL) or lipoprotein subparticles.
  18. The most frequently used and guideline-recommended test that can count the number of LDL particles is either apolipoprotein B or LDL-P NMR, which is part of the NMR LipoProfile.  NMR can also measure the size of LDL and other lipoprotein particles, which is valuable for predicting insulin resistance in drug naïve patients, before changes are noted in glucose or insulin levels.
  19. The progression from a completely normal artery to a “clogged” or atherosclerotic one follows a very clear path: an apoB containing particle gets past the endothelial layer into the subendothelial space, the particle and its cholesterol content is retained, immune cells arrive, an inflammatory response ensues “fixing” the apoB containing particles in place AND making more space for more of them.
  20. While inflammation plays a key role in this process, it’s the penetration of the endothelium and retention within the endothelium that drive the process.
  21. The most common apoB containing lipoprotein in this process is certainly the LDL particle. However, Lp(a) and apoB containing lipoproteins play a role also, especially in the insulin resistant person.
  22. If you want to stop atherosclerosis, you must lower the LDL particle number.
  23. At first glance it would seem that patients with smaller LDL particles are at greater risk for atherosclerosis than patients with large LDL particles, all things equal.
  24. “A particle is a particle is a particle.”  If you don’t know the number, you don’t know the risk.
  25. To address this question, however, one must look at changes in cardiovascular events or direct markers of atherosclerosis (e.g., IMT) while holding LDL-P constant and then again holding LDL size constant.  Only when you do this can you see that the relationship between size and event vanishes.  The only thing that matters is the number of LDL particles – large, small, or mixed.


Concept #8 – Why is it necessary to measure LDL-P, instead of just LDL-C?

In the growing list of reasons why I used to refer to myself as “chick-repellant” in college, I have a confession to make: I find the topic of statistical concordance and discordance to be so exciting, I sometimes have a hard time containing myself. This may explain the paucity of girlfriends in college. Let me use an example to illustrate the distinction between these terms.  Let’s say you want to predict the change in home prices in the following year (I used to model this for a living).   There are at least a dozen parameters linked to this, including: GDP growth, unemployment, interest rates (both short term and long term, though to different degrees), housing inventory (i.e., how many houses are on the market), housing absorption (i.e., how quickly houses go from being on the market to being sold), major stock indices, and consumer confidence.  Historically, from the mid-1990’s until about the fourth quarter of 2006, this worked like clockwork.  While each of these variables had differing strengths of predicting changes in home prices, they all moved together.  For example, when GDP growth was robust, unemployment was low, interest rates were modest, housing inventories were about 60 to 90 days, etcetera.  All of these variables pointed to a predictable change in home values.

Around Q42006 (i.e., last 3 months of 2006), one of these variables began to deviate from the others.   The details aren’t important, but the point is one variable began to suggest home prices would fall while the others all pointed to a continued rise.   Prior to Q42006 these parameters were said to be concordant – they all predicted the same thing – either up or down.  By 2007, they became discordant – one variable said the sky was falling while others said everything was fine.

This was true on the “micro” level, too. [What I described above is called “macro” level.]  As a lender, it should be very important to know the risk of each and every loan you make (clearly this was part of the root problem in the age of mass securitization).  Will this person pay the loan back or will they default?

Same game here, but now a new set of even greater variables.  As a lender, if I want to know if YOU will default, I will want to know a lot of things about you, such as your agency credit risk scores, your bank account activity, payroll activity, how much you’re borrowing relative to the value of your house, where your house is located, and about 50 other things (literally).

Not surprisingly, the same thing that happened on the macro side happened on the micro side.  It became difficult to predict who would default and would not default because there were so many variables to consider and lenders didn’t know which ones were still predictive.  The models that predict default are very sensitive to the balance of these inputs.  When all of the variables are concordant, their accuracy is prophetic, as was the case from the mid-1990s until late 2006.  When some variables become discordant with each other, especially variables that were historically concordant with each other, really bad stuff happens, as became evident to me, personally, one Thursday afternoon in November 2007.  It became clear the sky was about to fall.  And, of course, it did.


What does real estate have to do with atherosclerosis?

Fortunately, predicting heart disease is a little easier than predicting changes in home prices.  It’s not perfect, of course, but it’s pretty good.  Why is it not perfect? For one thing, we can’t do the “perfect” experiment.  The “perfect” experiment would look something like this:

Take 100,000 people and randomize them into four matched groups, A, B, C, and D.  Wave a magic wand (you can see why this experiment hasn’t been and won’t be done) and give the folks in Group A an LDL particle concentration of, say, 700 nmol/L; those in Group B you give 1,200 nmol/L; those in Group C you give 1,600 nmol/L; and those in Group D get 2,000 nmol/L.

In our dream world, due to the randomization process, these four groups would be statistically identical in every way except one – they would, thanks to our magic wand, have a different number of LDL particles.  We would follow them without further intervention for 10 years and then compare their rates of heart disease, stroke, and death.

There are some areas in medicine where we can do such experiments.  But, we can’t do this experiment for this question.  Even when we do the next best thing — give people a drug that lowers their LDL-P and measure the impact of this intervention — there is always a chance we’ve done something in addition to “just” lowering LDL-P.   If you’ve been reading this series, you no doubt know my thoughts on this: while other factors are likely to be involved the pathogenesis of atherosclerosis (e.g., endothelial “health”, normal versus abnormal inflammatory response) the primary driver of atherosclerosis is the number of apoB trafficking lipoproteins in circulation, of which LDL particles are the vast majority.

The data below should further clarify this association.


What do concordant LDL-C and LDL-P values look like?

Among the two largest studies tracking the association between cholesterol and atherosclerotic mortality are the Framingham study and the MESA trial (the two largest trials were AMORIS and INTERHEART).  The figure below, which I’ve graciously borrowed from Jim Otvos, shows the risk stratification of LDL-C (top) and LDL-P (bottom) from the Framingham study and MESA trial, respectively. As you can see, conveniently, LDL-C values in mg/dL are about 10x off from LDL-P values in nmol/L.   In other words, in the Framingham population, the 20th percentile value of LDL-C was 100 mg/dL, while the MESA trial found the 20th percentile of the population to have an LDL-P concentration of 1,000 nmol/L.  As you will see by the end of this post, this “rule of the thumb” should never be used to infer LDL-P from LDL-C.
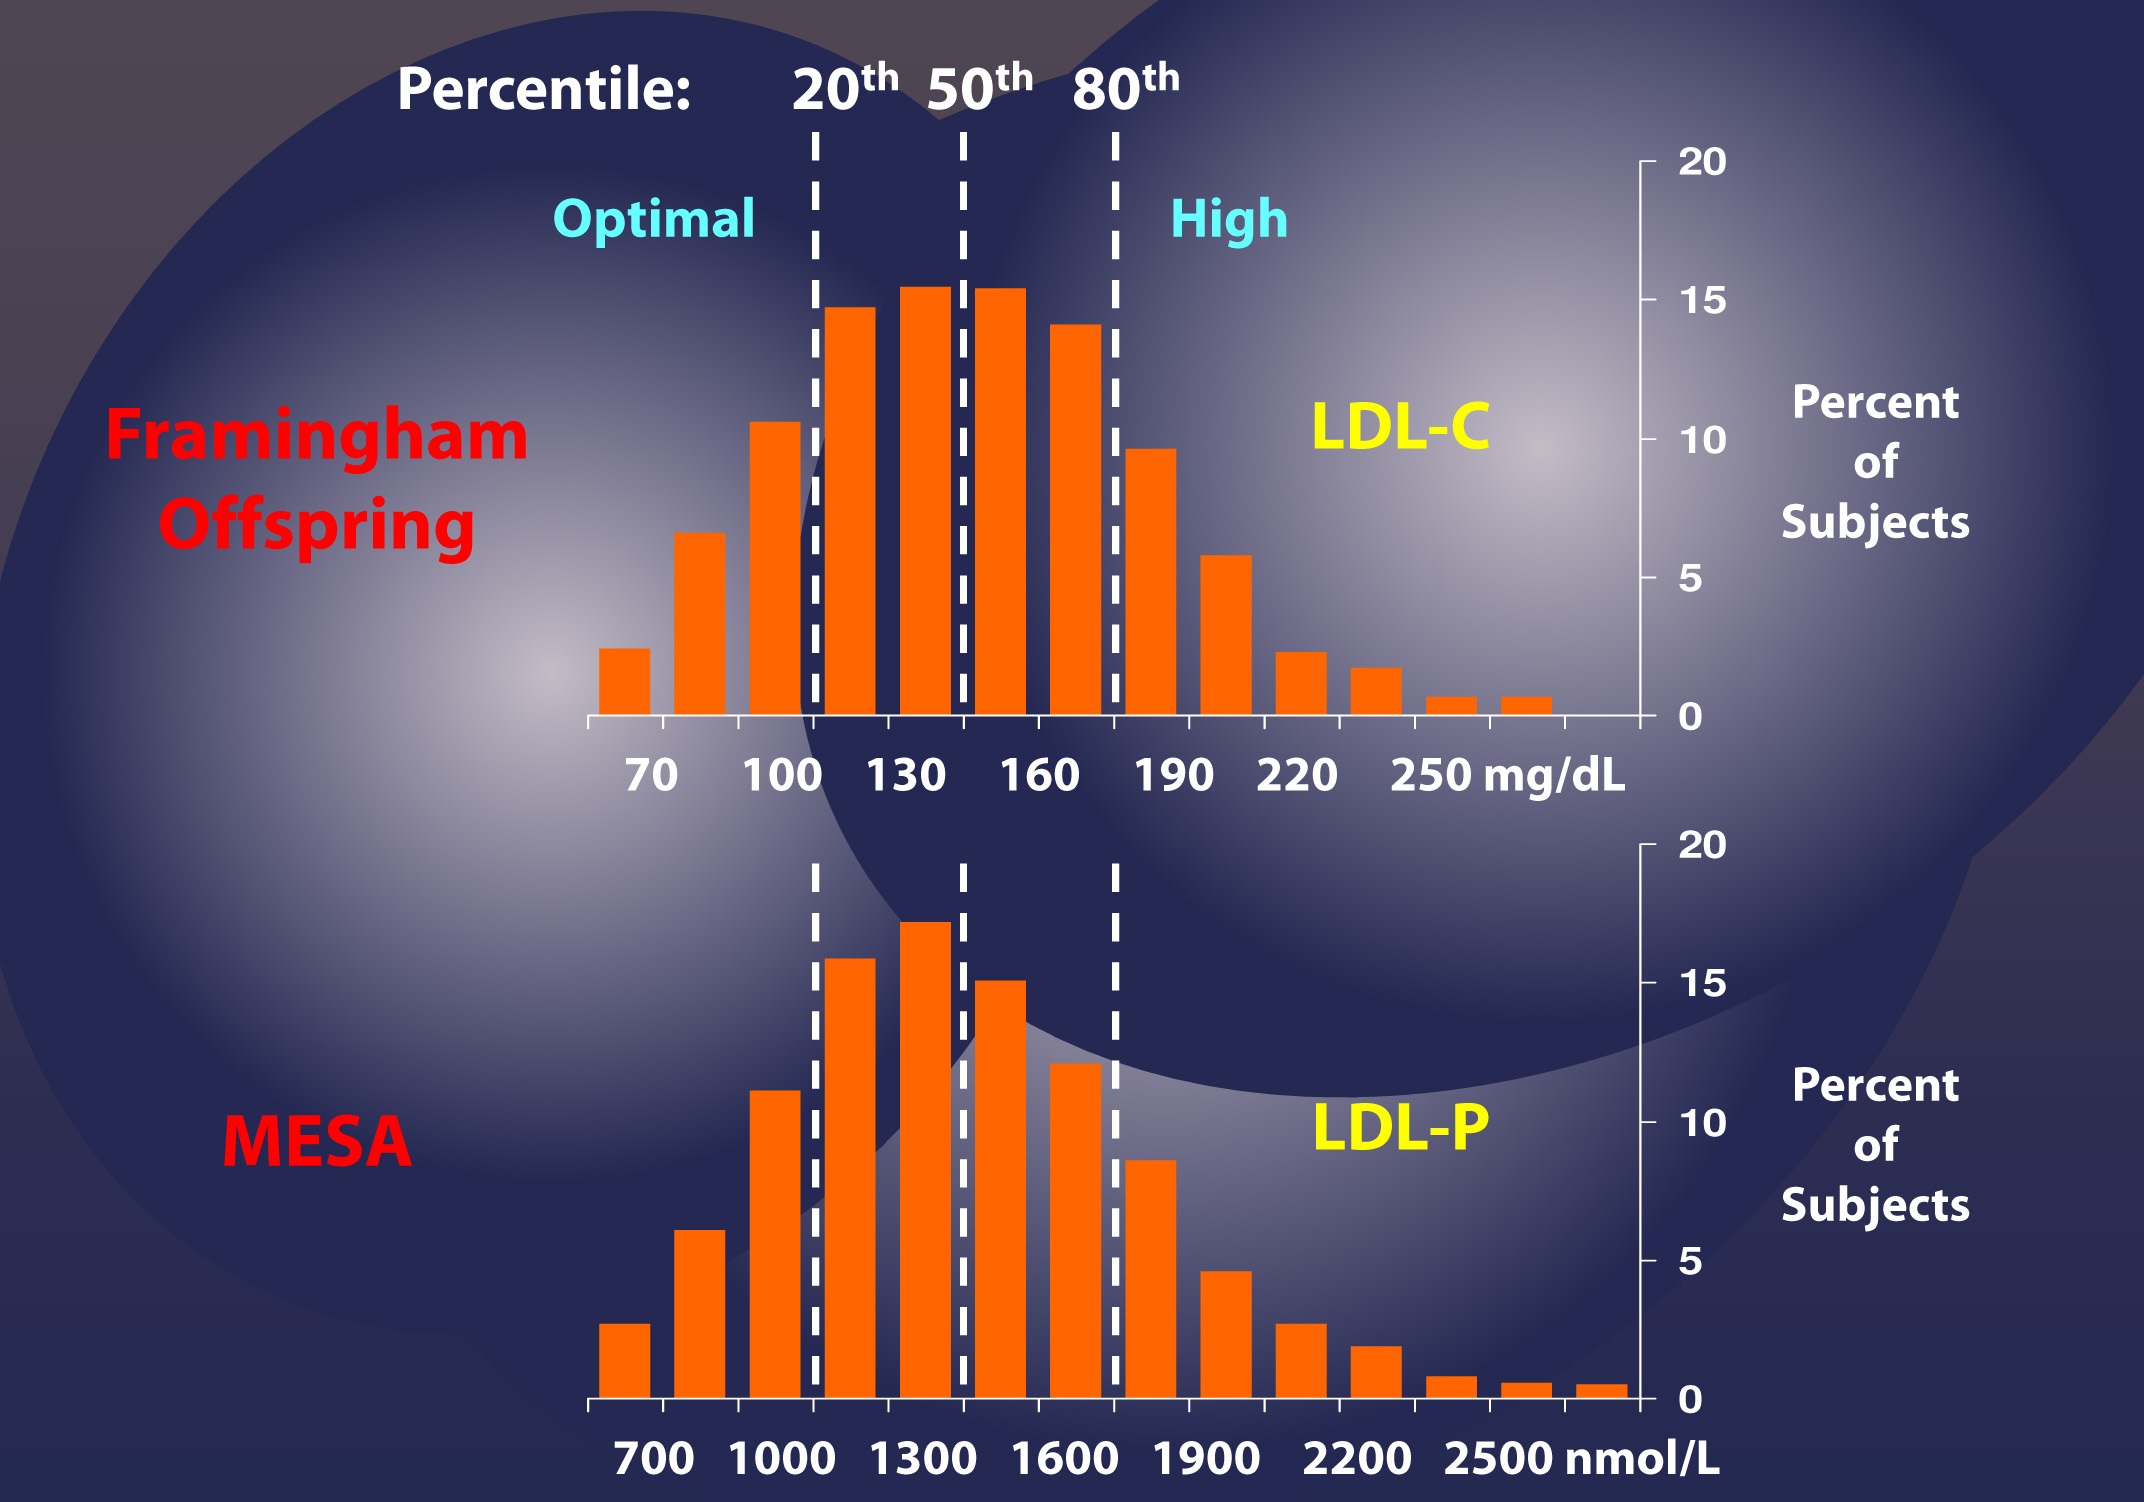
 

Cut-off points for LDL-C and LDL-P
Image credit: Jim Otvos

If this were always the case – that is, if LDL-C and LDL-P were always concordant – we could conclude that LDL-C and LDL-P would be of equal value in predicting heart disease.  Obviously this is not the case, or I wouldn’t be making such a fuss over the distinction.  But how bad is it?


What do discordant LDL-C and LDL-P values look like?

The figure below, from the Journal of Clinical Lipidology, shows the cumulative incidence of cardiovascular events (e.g., myocardial infarction, death) over time in three sub-populations:

  1. Those with concordant LDL-P and LDL-C (black line);
  2. Those with discordant LDL-P and LDL-C (LDL-P>LDL-C, shown by the red line);
  3. Those with discordant LDL-P and LDL-C (LDL-P<LDL-C, shown by the blue line).

This analysis was done using a Cox proportional hazard model and was adjusted for age, sex, and race.  The steeper the line the more people in that sub-population died or experienced adverse cardiac events relative to other sub-populations.  In other words, the folks in the red group had the worst outcomes, followed by the folks in the black group, followed by the folks in the blue group.
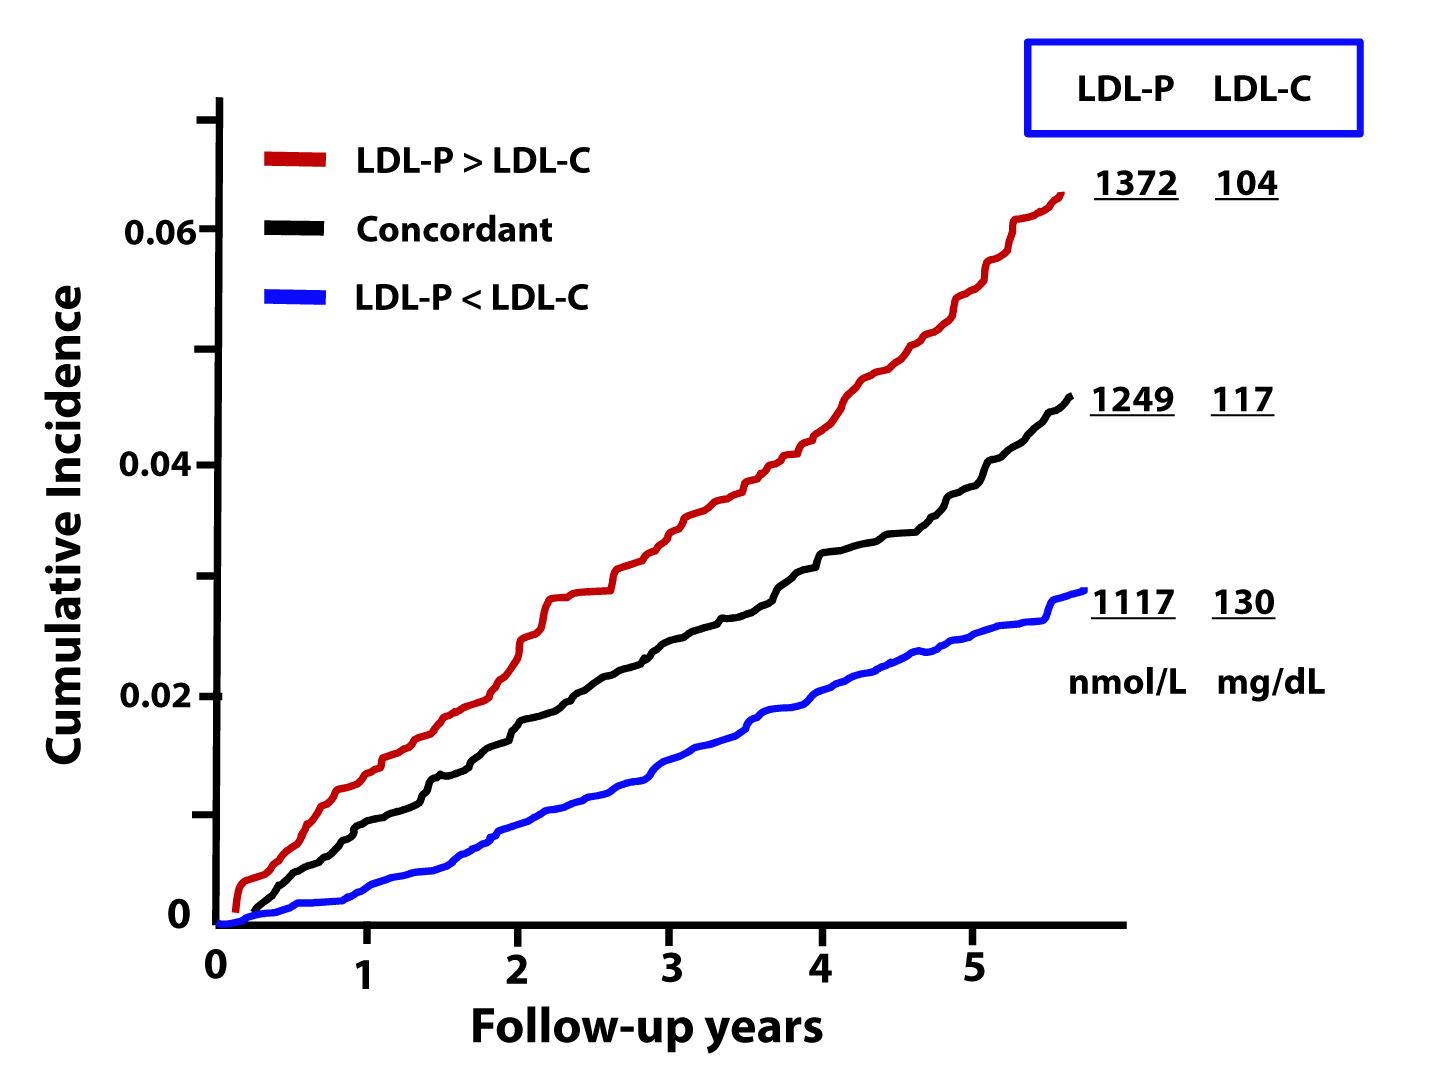
 

MESA LDL-P vs LDL-C

What can we infer from these data?

First, we confirm what I alluded to above.  Namely, that a non-zero percent of the population do not have LDL-C and LDL-P values that predict the same level of risk.  However, and perhaps more importantly, we get another look at an important theme of this series: LDL-P is driving atherosclerotic risk, not LDL-C.   If LDL-P and LDL-C were equally “bad” – even when discordant – you would expect the blue line to be as steep as the red line (and both to be steeper than the black line). But this is not the case.

Let’s look at these data parsed out another way.  Below we see the four possible subgroups, from the top:

  1. Not low LDL-P, low LDL-C (red line);
  2. Not low LDL-P, not low LDL-C (yellow line);
  3. Low LDL-P, low LDL-C (black line); and
  4. Low LDL-P, not low LDL-C (blue line).

Note that “low” is defined below the 30th percentile and “not low” is defined as greater than 30th percentile for each variable.   This figure is even more revealing than the one above.  Again, it demonstrates the frequency of discordance (about 20% in this population with these cut-off points), and it shows the importance of LDL-P’s predictive power, relative to that of LDL-C.

In fact, though not statistically significant, the highest risk group has high LDL-P and actually has low LDL-C (I’ll give you a hint of why, below) while the lowest risk group has low LDL-P and not-low LDL-C.  *This is not a typo.


MESA LDLp vs LDLc 4 groups

The highest risk and lowest risk groups are those with discordant LDL-C and LDL-P.  The high risk group has high LDL-P and low LDL-C, while the lowest risk group has high LDL-C with low LDL-P. Only a minority of physicians would know that there is a segment of the population with elevated LDL-C who are at low risk! The same conclusion will be drawn from the next study.

Let’s look at an even longer-term follow up study, below.  This study followed a Framingham offspring cohort of about 2,500 patients over a median time period of almost 15 years in each of the four possible groups (i.e., high-high, high-low, low-high, and low-low) and tracked event-free survival.  In this analysis the cut-off points for LDL-P and LDL-C were the median population values of 1,414 nmol/L and131 mg/dL, respectively. So “high” implies above these values; “low” implies below these values.  Kaplan-Meier survival curves are displayed over a 16 year period – the steeper the slope of the line the worse the outcome (survival).
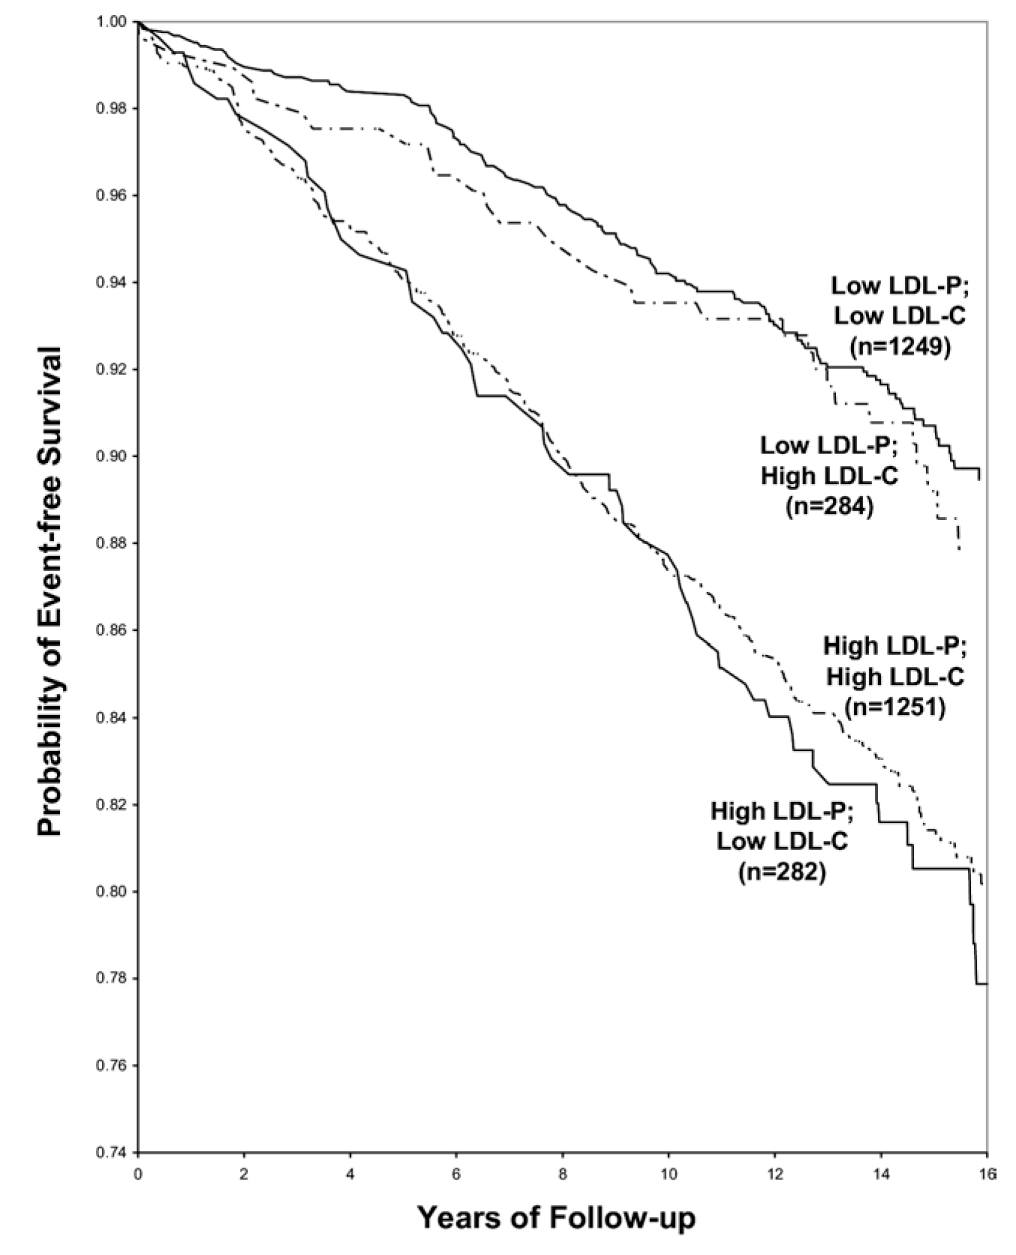
 

Survival curve
Image credit: Cromwell et al., 2007

The same patterns are observed:

  1. LDL-P is the best predictor of adverse cardiac events.
  2. LDL-C is only a good predictor of adverse cardiac events when it is concordant with LDL-P; otherwise it is a poor predictor of risk.

Amazingly the persons with the worst survival had low (below median) LDL-C but high LDL-P.  The patients most likely to have high LDL-P with unremarkable or low LDL-C are those with either small LDL particles, or TG-rich / cholesterol poor LDL particles, or both (e.g., insulin resistant patients, metabolic syndrome patients, T2DM patients).   This explains why small LDL particles, while no more atherogenic on a per particle basis than large particles, are a marker for something sinister.


Populations where LDL-P and LDL-C discordance are even more prevalent

As I described above, the discordance between LDL-P and LDL-C is exacerbated in patients with metabolic syndrome. The figure below, MESA data, again borrowed from Jim Otvos, presents this difference in an elegant way.  The horizontal axes show LDL-P concentration in the usual units, nmol/L.
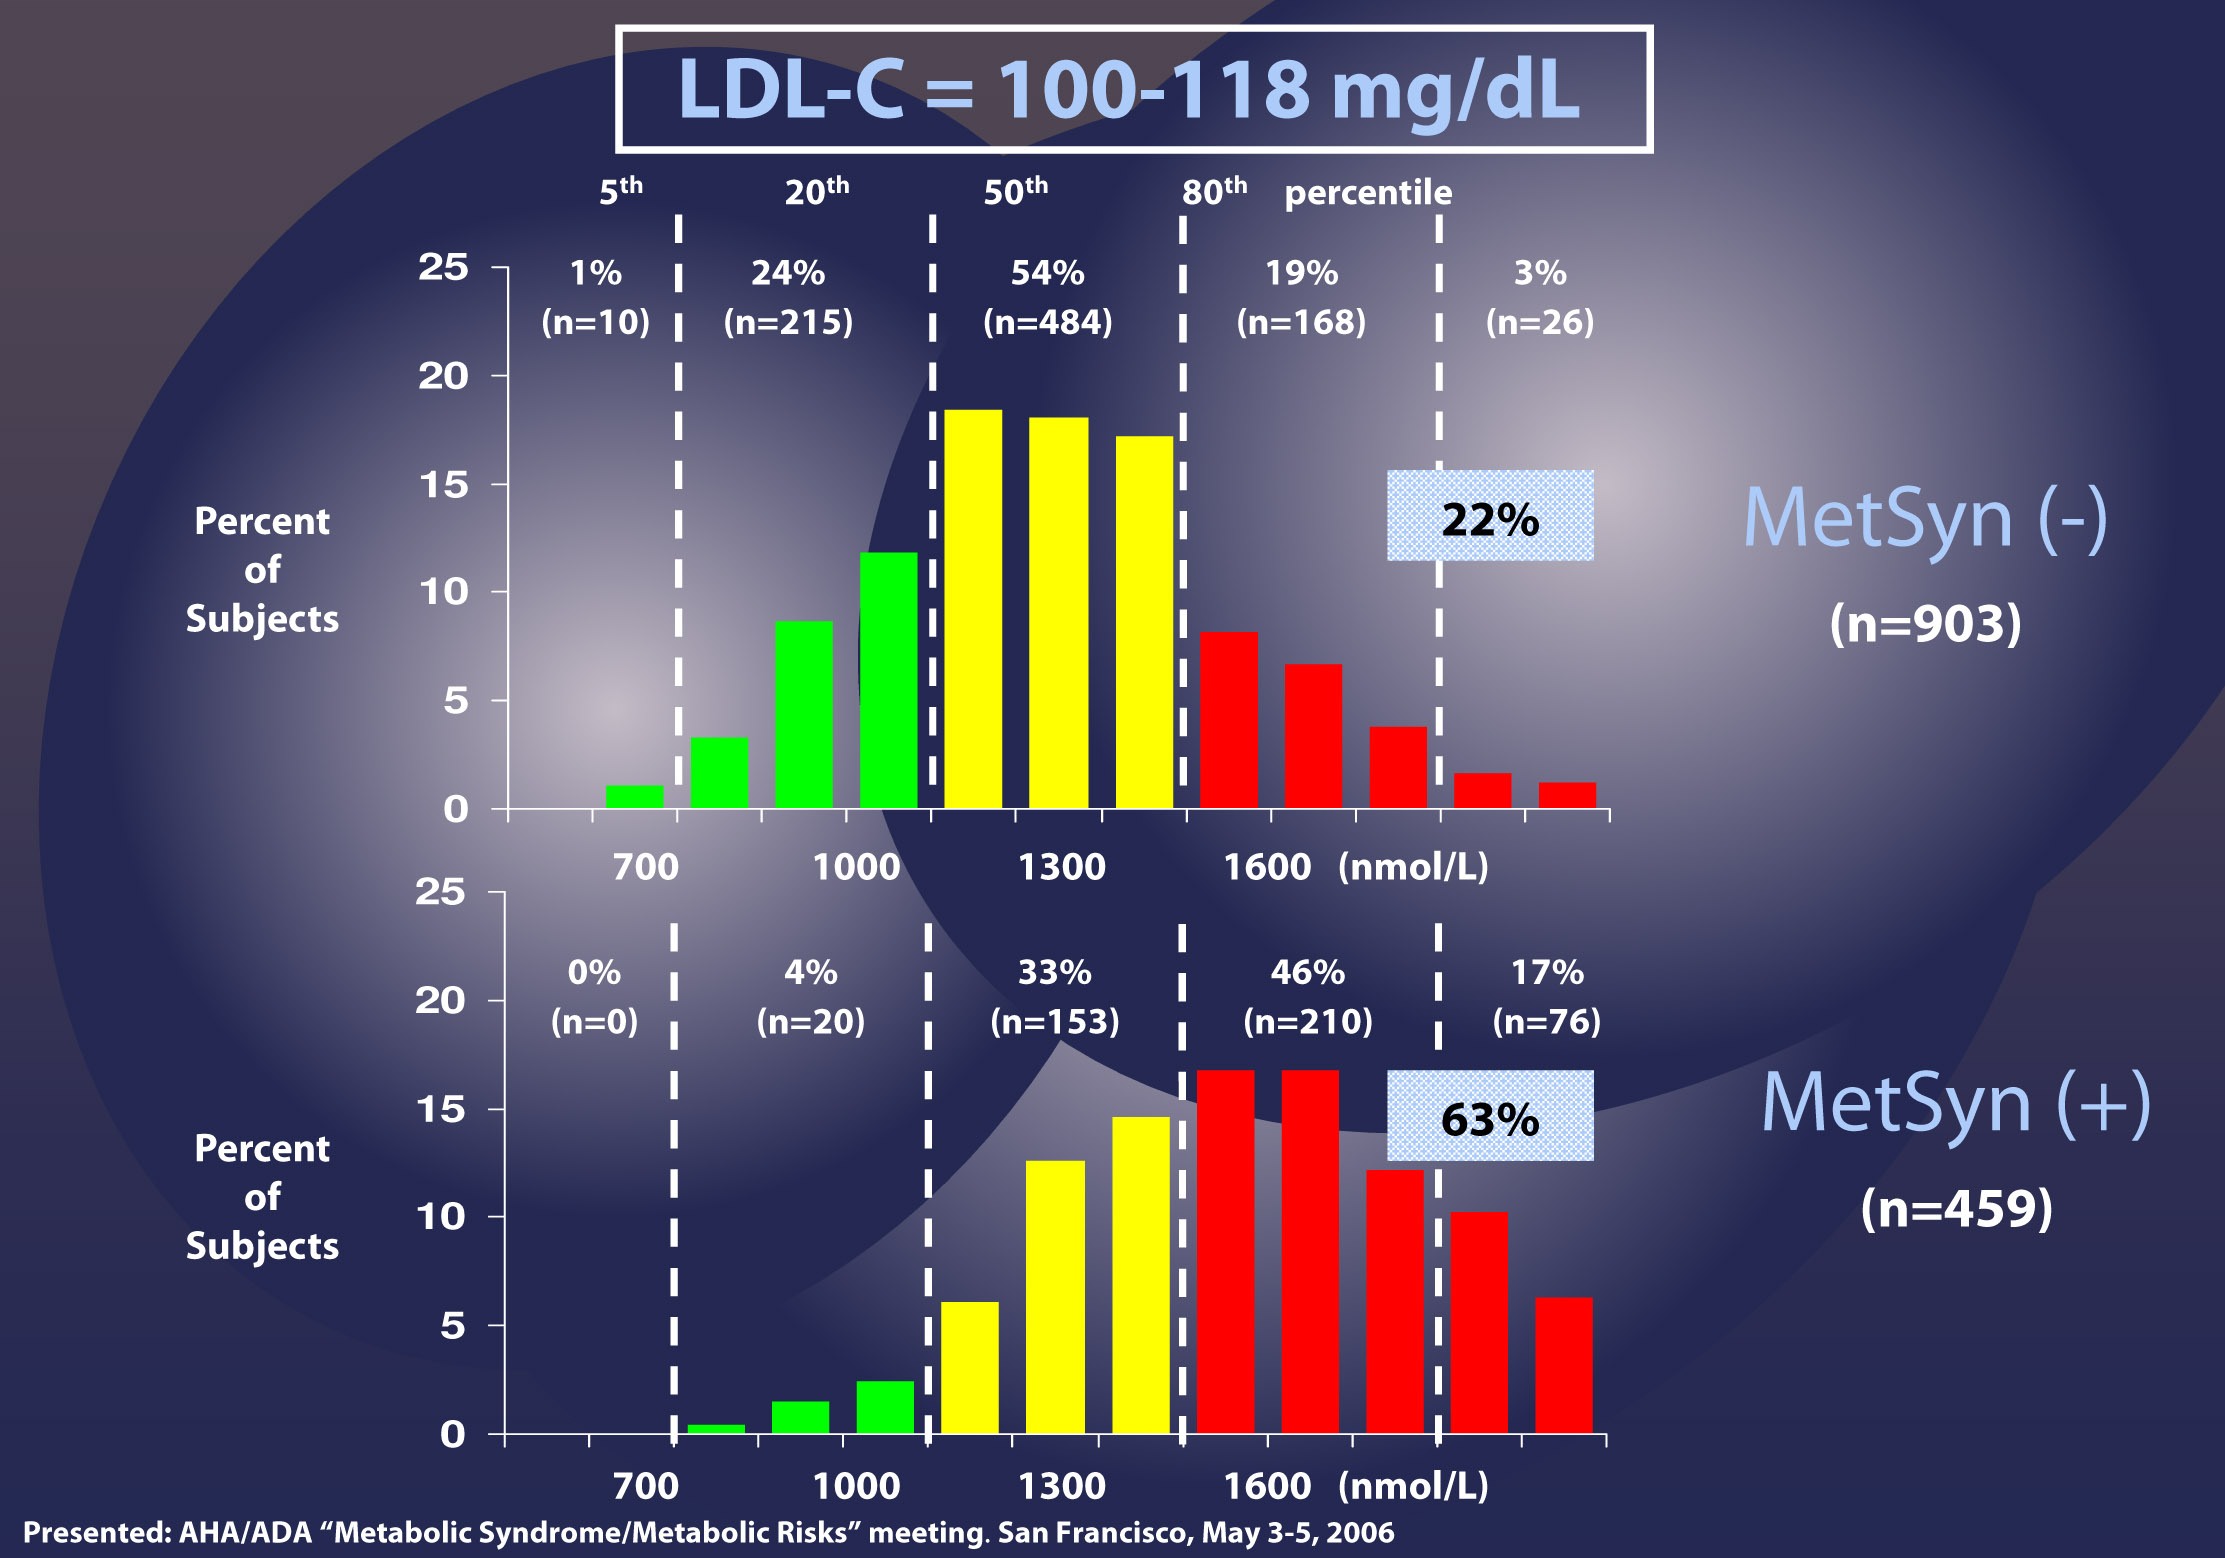
 

Otvos ADA
Image credit: Jim Otvos

Patients with LDL-C between 100 and 118 mg/dL (i.e., second quartile of risk: 25th to 50th percentile) are shown without metabolic syndrome (top) and with metabolic syndrome (bottom).  In the patients without metabolic syndrome, LDL-C under-predicts cardiac risk 22% of the time, consistent with the population data I have shown you earlier.  However, when you look at the patients with metabolic syndrome, you can see that 63% of the time their risk of cardiac disease is under-predicted.  Again, not a typo.

There are so many subsets and cut-off points that I could devote ten more posts to showing you every one of these analyses.  Let me finish this point with the most recent, hot-off-the-press (actually, still in press in the American Journal of Cardiology, though you can get a preprint here) analysis of which Tom Dayspring is one of the authors.
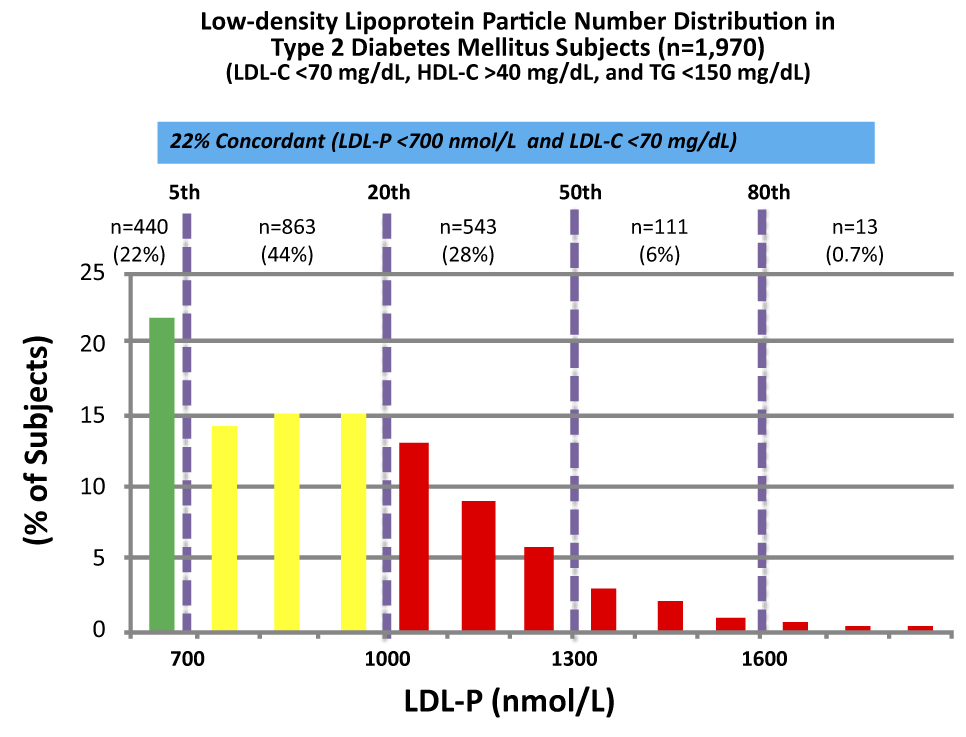
 

Evaluation of Low-Density Lipoprotein Particle Number Distribution
Image credit: Malave et al., 2012

These data were collected from nearly 2,000 patients with diabetes who presented with “perfect” standard cholesterol numbers: LDL-C < 70 mg/dL; HDL-C > 40 mg/dL; TG <150 mg/dL.  However, only in 22% of cases were their LDL-P concordant with LDL-C.  That is, in only 22% of cases did these patients have an LDL-P level below 700 nmol/L.

Remember, LDL-C < 70 mg/dL is considered VERY low risk – the 5th percentile.  Yet, by LDL-P, the real marker of risk, 35% of these patients had more than 1,000 nmol/L and 7% were high risk.  When you do this analysis with the same group of patients stratified by less stringent LDL-C criteria (e.g., <100 mg/dL) the number of patients in the high risk group is even higher.

The real world tragedy: 90-95% of physicians, including cardiologists, would bet their own lives that persons with an LDL-C < 70 mg/dL have no atherosclerotic risk. 

Tim Russert, shortly before his death, had his LDL-C level checked.  It was less than 70 mg/dL.  Sadly, his doctors didn’t realize they should also have been checking his LDL-P or apoB.  The figure below, which is from one of Tom Dayspring’s presentations, shows data from this study of nearly 137,000 patients hospitalized for coronary artery disease between 2000 and 2006.  As you can see, LDL-C fails to even reasonably predict cardiovascular disease in a patient population sick enough to show up in the hospital with chest pain or outright myocardial infarction.
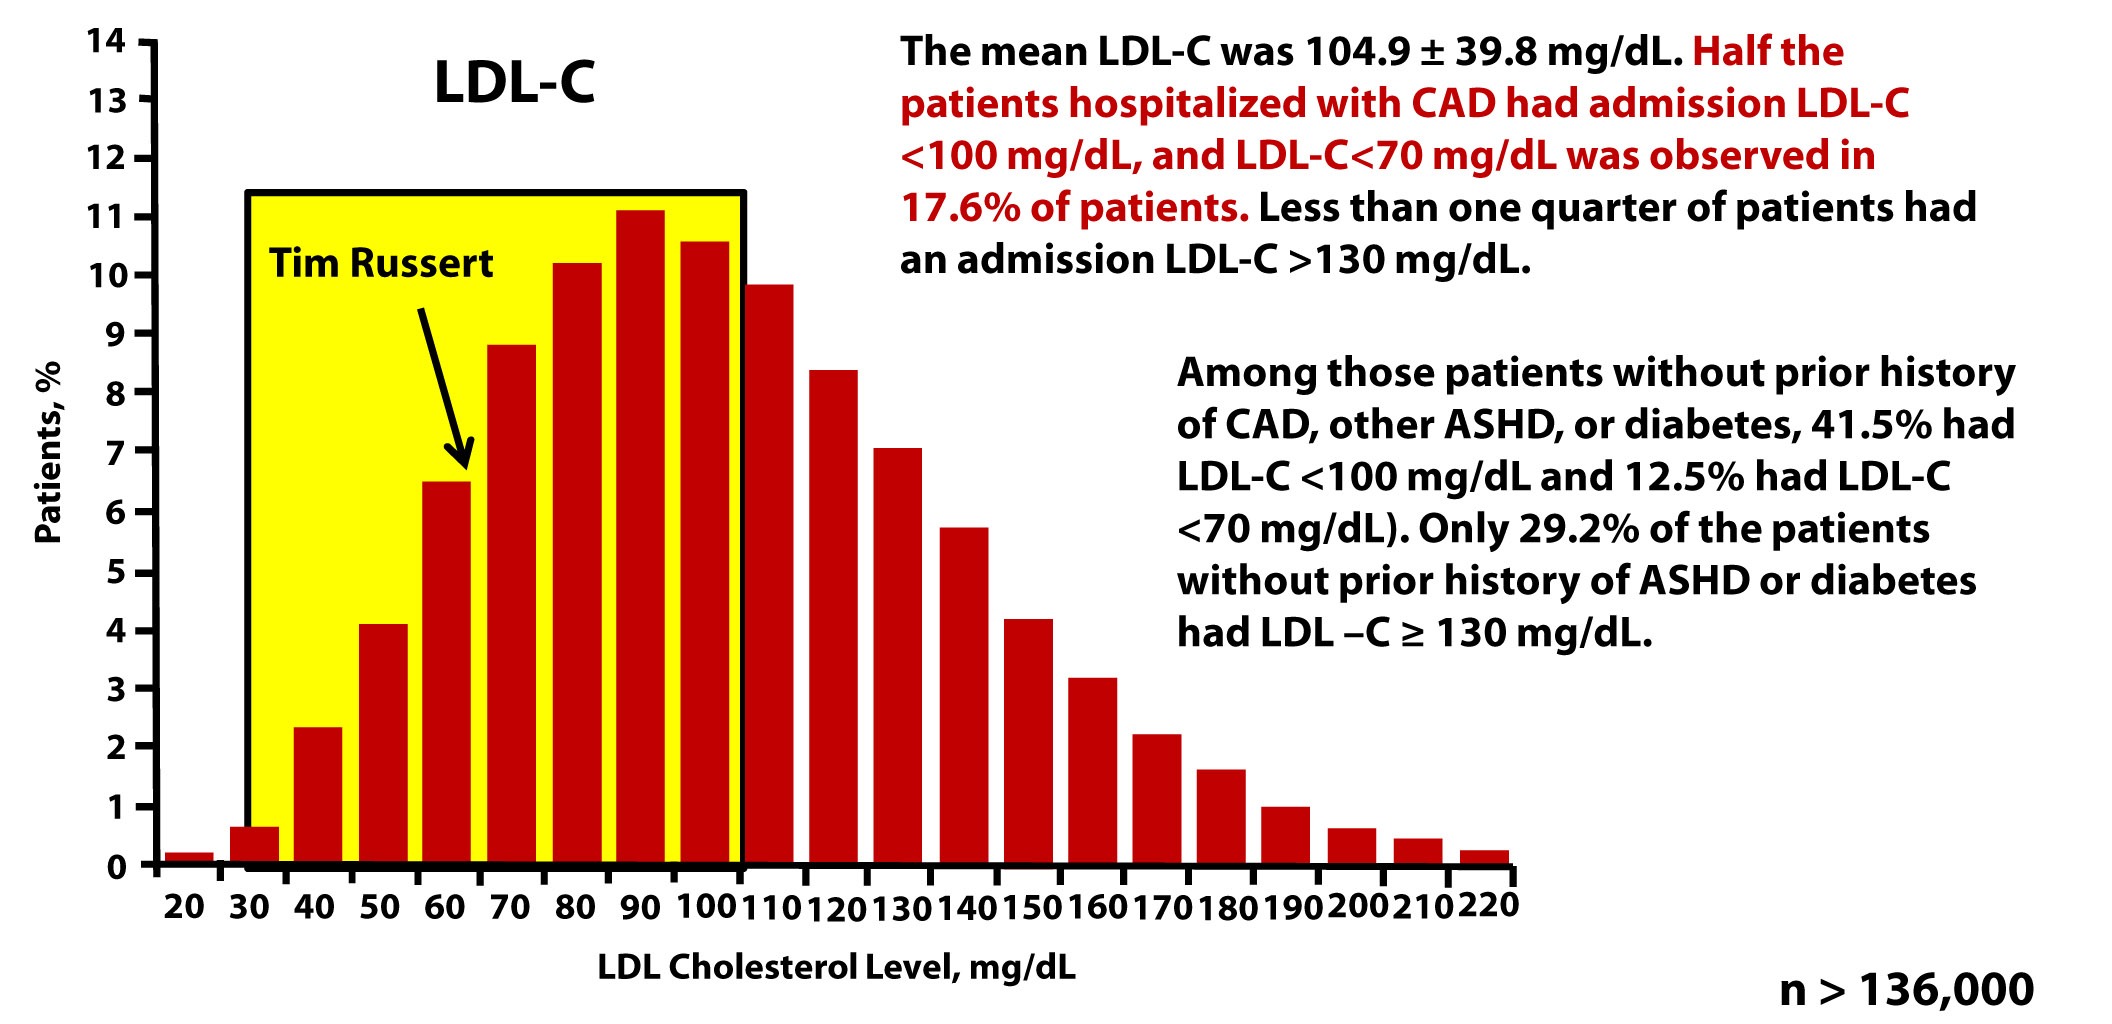
 

Insulin Resistance Lipids & Lipoproteins

Why are LDL-C and LDL-P so often discordant?

Think back to what you learned in a previous post in this series.  LDL particles traffic not only cholesterol ester but also triglycerides.  Each and every LDL particle has a variable number of cholesterol molecules which, because of constant particle remodeling, is constantly changing.  In other words, of the several quadrillion LDL particles floating in your plasma, no two are carrying the exact same number of cholesterol molecules. It takes many more cholesterol-depleted LDL particles than cholesterol-rich LDL particles to traffic a given cholesterol mass (i.e., number of cholesterol molecules) per volume of plasma (i.e., per dL).  Core cholesterol mass is related to both LDL particle size (the volume of a sphere is a third power of the radius — it can take 40-70% more small particles than large LDL particles to traffic a given cholesterol mass) and the number of TG molecules per LDL particle.

TG molecules are larger than cholesterol ester molecules, so as the number of TG molecules per particle increases, the number of cholesterol molecules will be less – in a very non-linear manner. Regardless of size it takes many more TG-rich LDL particles (which are necessarily cholesterol-depleted) to traffic a given cholesterol mass than TG-poor LDL particles.  The persons with the highest LDL particles typically (though not always) have small LDL particles that are TG-rich.  These are incredibly cholesterol-depleted LDL particles.


Summary

Take a look at this figure below from the 2011 Otvos et al. paper I referenced above.  It’s a scatterplot of each data point (i.e., patient) in the study. The solid red line shows perfect concordance between LDL-P and LDL-C.  The dashed red lines show a +/- 12% margin on each side.  Look at how many dots (remember: each dot represents a person) lie OUTSIDE of the dashed red lines. Now look again.
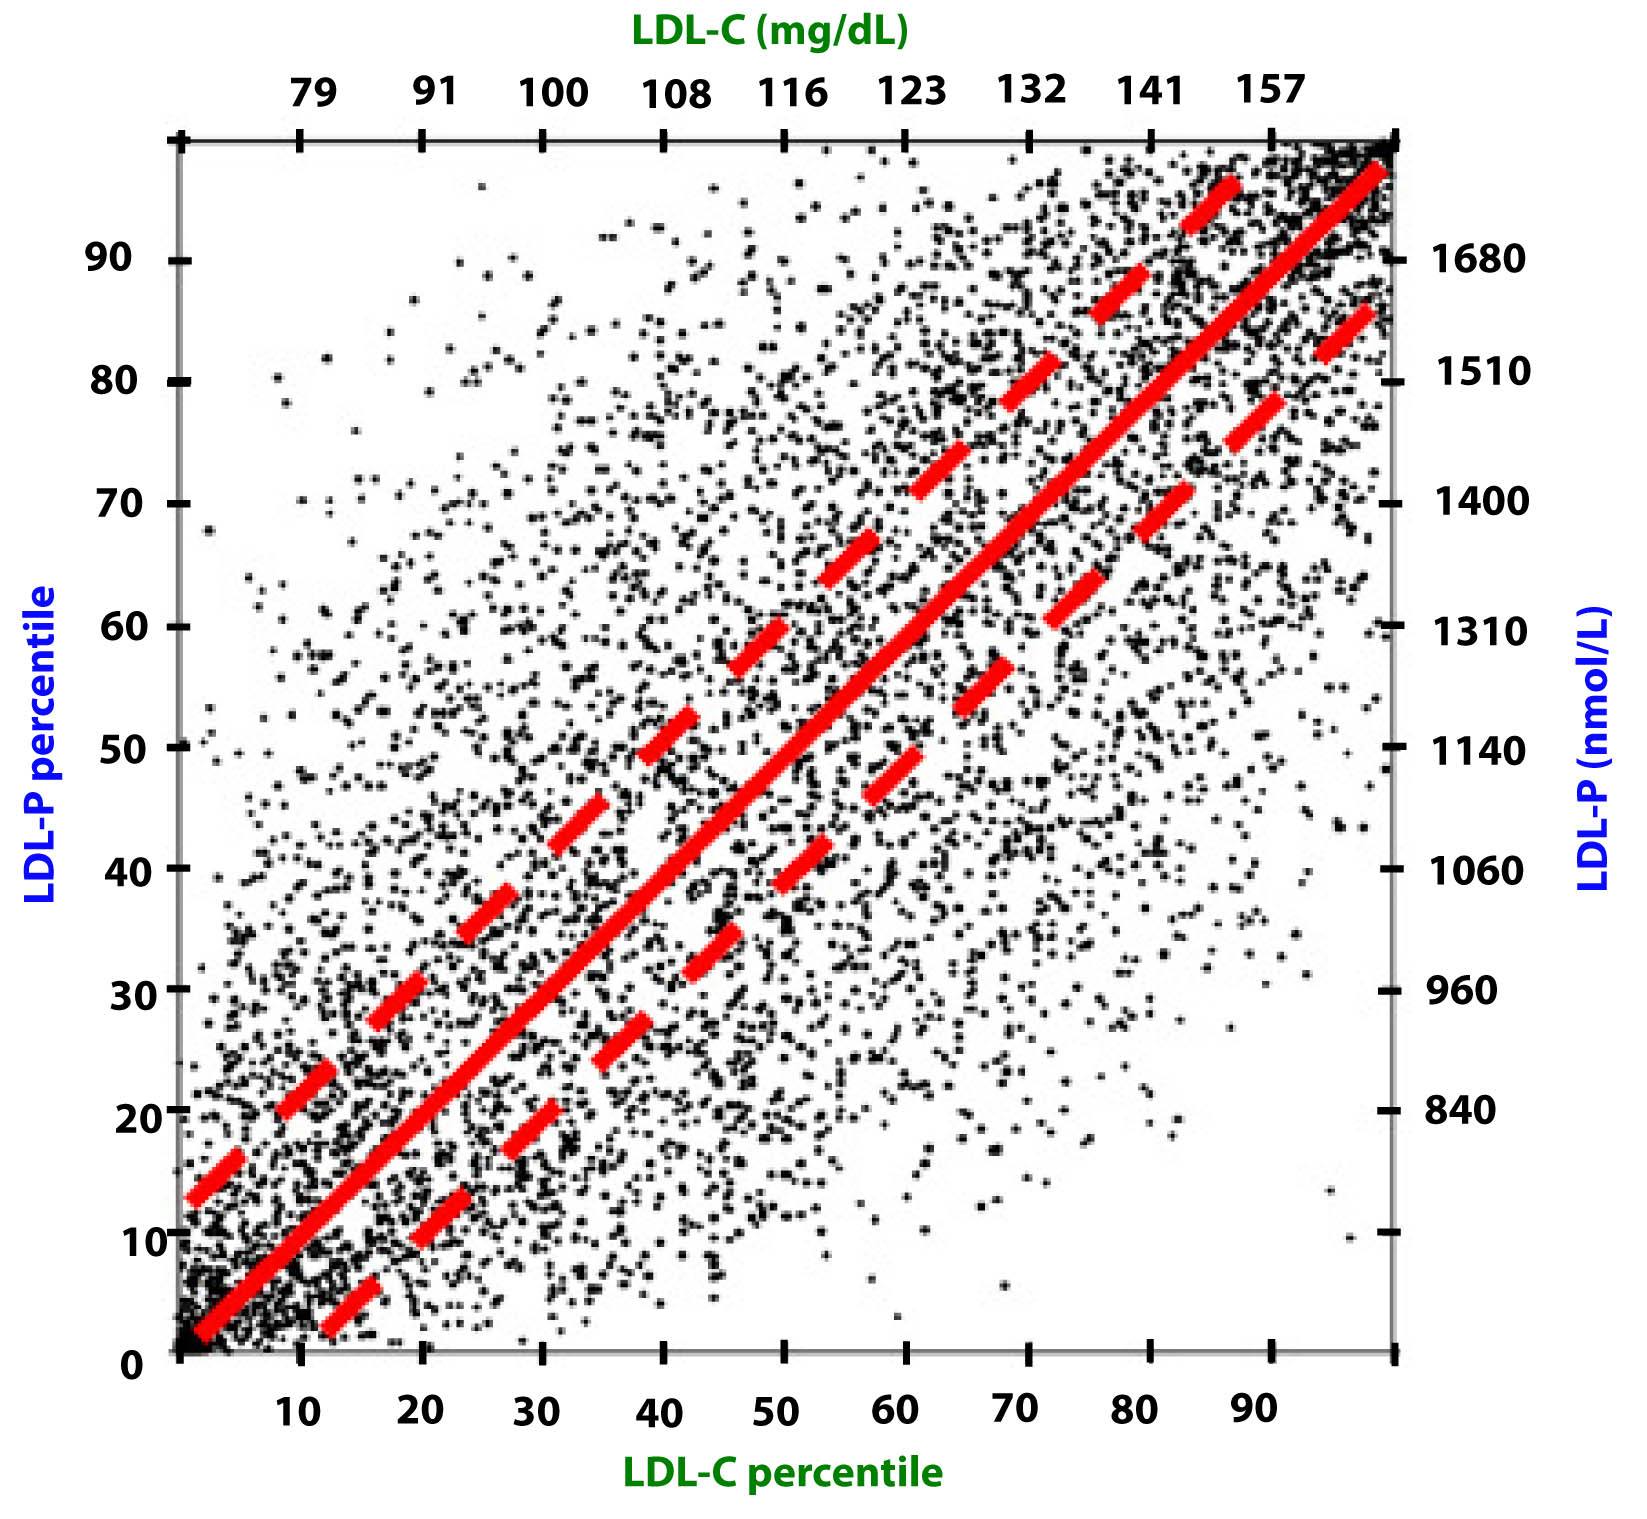
 

MESA LDLp vs LDLc J Clin Lip2011

When people argue with me about why it’s unnecessary to check LDL-P or apoB because it’s much easier and cheaper to check LDL-C, I like to remind them of what Clint Eastwood would probably say in such a situation:  You’ve got to ask yourself one question: Do I feel lucky? Well, do ya, punk?”


  1. With respect to laboratory medicine, two markers that have a high correlation with a given outcome are concordant – they equally predict the same outcome. However, when the two tests do not correlate with each other they are said to be discordant.
  2. LDL-P (or apoB) is the best predictor of adverse cardiac events, which has been documented repeatedly in every major cardiovascular risk study.
  3. LDL-C is only a good predictor of adverse cardiac events when it is concordant with LDL-P; otherwise it is a poor predictor of risk.
  4. There is no way of determining which individual patient may have discordant LDL-C and LDL-P without measuring both markers.
  5. Discordance between LDL-C and LDL-P is even greater in populations with metabolic syndrome, including patients with diabetes.  Given the ubiquity of these conditions in the U.S. population, and the special risk such patients carry for cardiovascular disease, it is difficult to justify use of LDL-C, HDL-C, and TG alone for risk stratification in all but the most select patients.
  6. This raises the question: if indeed LDL-P is always as good and in most cases better than LDL-C at predicting cardiovascular risk, why do we continue to measure (or calculate) LDL-C at all?

Photo by Aldric RIVAT on Unsplash

Disclaimer: This blog is for general informational purposes only and does not constitute the practice of medicine, nursing or other professional health care services, including the giving of medical advice, and no doctor/patient relationship is formed. The use of information on this blog or materials linked from this blog is at the user's own risk. The content of this blog is not intended to be a substitute for professional medical advice, diagnosis, or treatment. Users should not disregard, or delay in obtaining, medical advice for any medical condition they may have, and should seek the assistance of their health care professionals for any such conditions.

320 Comments

  1. I didn’t see a recommendation to eat pancakes with lots of syrup. Where is this? Or is this the punch line to a joke I’m slow to catch? Great series btw. Thanks.

  2. Great job again! By the time you are finished with this series you will be able to turn it in to a book.
    Aside from metabolic syndrome, can’t genetics affect LDL size?
    There are high carb eating populations with low levels of heart disease and would have to assume LDL-C/LDL-P discordance not different from here.
    It would be nice to see studies of LDL-C/LDL-P in countries such as Japan and France where low O6,sugar,etc are eaten and see what the heart disease issues are there.

    • Peter, Very pleased to hear you will be addressing APOE4 in the future. FWIW, this is the source of my previous questions.

      The dimension I am most interested in is resolving an apparent heart/brain dilemma. Although probably a blog series as big as this if ever done, to me, the collective evidence suggests APOE4’s may want to *higher* LDL levels to overcome inferior transport of cholesterol to/within the brain (to avoid neurodegeneration). But of course this would be bad for the heart, unless this could be mitigated by controlling inflammation as discussed in previous posts.

      Can’t wait for the next (and other future?) post(s)!

  3. WOW!
    This isn’t a slog. Its sooo amazing! I was an art major in college and learning all this stuff is sooo cool!! Are you going to get into TG genesis…like how its actually made and from what? I know people say that TG goes down on LC eating but I really want to know why, Peter style.

    • Great question. They are much more concordant than LDL-C and LDL-P, but not 100%. In my personal experience about 2-4% of folks have discordant apoB and LDL-P, but this is obviously quite rare. Remember, though, when I talk about apoB, I’m only talking about the direct measurement, not the estimate.

  4. Peter, I’ve always thought the biggest problem is with whoever came up with the supposed standards of ‘normal’ or ‘good’ cholesterol levels. LDL-C of 100, HDL-C of 40 and TG of 150 is abysmal.

    Why do we have such low expectations?

    You have to look at all three components and the target range should by LDL-C 60 and TG < 75. I've got a buddy who had LDL-C at 72, which by itself looks great but is useless by itself. His HDL-C was only 24 and all his uncles died at an early age of a stroke (dad didn't die but was half-paralyzed). His doctor told him he'd be lucky to get his HDL-C up more than a few points, and the most he'd ever seen it go up was 5 points, lol. What a joke. We got his up to 43 in about 6 months and there is not doubt we can get it over 60.

    Thank you for contributions. We need more people like you to challenge the status quo because this problem is very fixable with a good comprehensive health plan.

    • Weird, something got cut off in one of my sentences and it hapenned again in this comment before I edited it and got rid of the greater than, less than symbols. The target ranges of standard cholesterol in my opinion should be LDL-C less than 75, HDL-C greater than 60 and TG less than 75. Whoever came up with the current standards needs to be put out for pasture 🙂

    • Dr. Dayspring, the study from where you pulled your graph info seems to support the point I was trying to make (which wasn’t about particle numbers).

      In the study of the 136,000 folks, only 1.4% of them had HDL greater than 60 and LDL less than 70.

      My point is that most people, doctors included, think you are fine with LDL-C less than 100, HDL-C greater than 40 and TG less than 150. That standard really needs to significantly change.

      As you pointed out in your graph, LDL-C is completely useless as a stand-a-lone figure, even when it’s less than 70.

      While you and Peter are educating your profession about LDL-P (which most doctors have never heard of) getting them also to change the standard cholesterol levels of what is acceptable (which they all have heard of) would benefit a lot of people.

      If people, most doctors included, understood that you may be at high risk unless your LDL-C is less than 75, HDL-C greater than 60 and TG less than 75 (and you have to meet all three criteria, not one or two), it would focus them much better on the fact they have a lot of work to do and not settle for the current low expectations we have with the current standards.

      A big thank you to you and Peter for your pioneering work in this field. Best of luck to you guys in your research.

    • Hey Peter, since you brought up your modeling days (financial that is) in this piece, it always cracks me up how those fancy models work great for X number of years until they blow up.

      The problem with them is they do great in a 2 dimensional world for awhile (kind of like an academic simulation) but there is usually a 3rd dimension they miss that ultimately bites them in the butt. The same problem is playing itself out now in the markets in other ways.

      It took the housing price model until Q4 2006 to finally have one variable show as discordant? Wow, what a disaster!

      • Don’t even get me started on the pitfalls of regression-based modeling… that could be (and probably is somewhere) an entire blog…

    • “…keep this theme in mind when we eventually have our discussion around hypothyroidism…”

      I’m looking forward to this part, as a long-term low-carber with hypothyroid issues, including a poor T3/rT3 ratio. Any idea when you might get to this?

    • I’m glad you are going to be discussing T3/rT3 issues because T3 directly influences LDL-Receptor expression which will impact serum levels of LDL-P and LDL-C.

    • Jeremy: “In the study of the 136,000 folks, only 1.4% of them had HDL greater than 60 and LDL less than 70.”

      Just musing, but that by itself tells us nothing about risk. We’d need to know those comparable numbers per person among the general population — do we know that? i.e., if only 1.4% of all adults in general ALSO have those same “ideal lipid levels” of HDL/LDL, then there’s nothing protective that that. Maybe that’s an unusual combination in a person. And even THAT data still wouldn’t tell us much unless it’s age-adjusted.

      Maybe this general population LDL/HDL data can be found in NHANES, haven’t checked, but it’s not explicitly stated in the study, which is odd because it seems to me to be an obvious thing to include if data is available.

  5. Peter, could you please speak to ratios? I have very high TC and LDL, but also very high HDL. My apoB from VAP test was 180, but if converted to ratio of B/A-1, I’m sure it would be quite favorable. Like many low carb eaters, I have no other indications of heart disease, insulin resistance or met sym. Until now, I have been placidly ignoring these tests on the basis of “Pattern A” and good ratios; your approach challenges reliance on Pattern A but are you also challenging ratio information? Thanks very much.

    • Ratios provide guidance, but should not be used for treatment. We treat LDL-P, but often the ratio of LDL-P to HDL-P or TG to HDL-C or ApoB to ApoA1 serve as quick checks of where you’d want to be (ideally, below 30, 1.0, and 0.34, respectively).

    • HDL-C is not apoA-I They also can be very discordant We now know thinking high HDL-C is protectove or low HDL-C is necessarily a riskfactor is BS Go with apoB The level you mention is a horrific nightmare The HDL has little meaning

      But the VAP apoB is calculated– do not beleive it Get it via proetin immunoassay

  6. From a discordant- LDL-C 94, LDL-P 1723, TG 84
    On a low carb diet for 2 years.
    Is there any data that quantifies the incidents of heart disease with high LPL-P? I know that in the Framington study numbers were manipulated with percentages with the actual incidents were quite small. It would be more meaningful to me to see that if you were at a certain level of LPL-P then you had a 1 in 10 chance of heart disease or 2 in 10 at another level. It would just give some quantification to the risk. I assume however that we just do not have the empirical data to have those kind of statistics.
    The series has been very informative but also scary for those of us who are doing what you are supposed to do and still have high LDL-P.

    • Larry, you’re asking a great question, but to do it justice I need to explain a few things in more detail. Could you sit tight for another week or so? I think this issue is important enough to make sure everyone understands.

    • Larry,
      I have a similarly unusual, but somewhat different, lipid profile. Please see my general comment. I would be curious what your HDL-c is — that would give a more complete picture. In any event, I can identify with your query, and have done a lot of research on my own behalf.
      My practical advice would be to get a coronary calcium score as a starting point, and go from there. Also, make sure you are fully aware of your status with regard to glycemic regulation. Get (and/or review) both an HbA1c and fasting-glucose. If appropriate follow up with an oral-glucose tolerance test and go from there.
      All of these tests are much more reliably indicative of both status and future risk than blood lipids (advanced or not), based upon my reading of the literature.
      Good luck.

  7. “I’ve been hanging on the edge of my seat — really surprised me at the end where you recommend eating more pancakes.”

    Well, at least now I understand why “Confused” over on The Diet Doctor’s blog is claiming that you’ve abandoned the insulin hypothesis and gone back to the lipid hypothesis. Looks like “Confused” just skipped over the post and only read the first comment!

    • OK I was all ready to apologize again, but reading Mr. Confused’s comment on Dr. Eenfeldt’s blog, I think he’s implying that anyone who attributes anything of importance to anything having to do with cholesterol is preaching the “lipid hypothesis”, plus he doesn’t seem to like the blog name change!

    • “…anyone who attributes anything of importance to anything having to do with cholesterol is preaching the “lipid hypothesis”…”

      It took me a while to figure that out. You’re right, of course – sorry if it sounded like I was accusing you of something, Kevin.

  8. Part VI is wonderful. I’m eager to learn more.

    In a different part of the site, you mentioned your current diet and maybe said something like 50 grams/day in protein. I’m guessing that’s a bit low by US standards/customs. I’m also guessing you want to avoid having the body convert excess protein to sugar? That left me wondering, what do you eat that has all the fat calories?

  9. LDL-P is a better risk marker than LDL-c; no argument. But it is still not a very strong risk marker, by the numbers. I do not believe that LDL particles are THE CAUSE, but rather just one of many secondary co-factors, for atherosclerosis.
    I recommend the following paper (Ron Krauss et al) as state-of-the-art risk assessment based upon ONLY blood lipids: https://www.ncbi.nlm.nih.gov/pmc/articles/PMC2772123/
    PC2 is the strongest indicator, and it is INDEPENDENT and a function of many sub-fraction values within the lipid profile (including HDL and LDL types).
    Neither Krauss nor Otvos himself seem to think that NMR is justified for most people. Both are on the record — here’s Otvos: https://circ.ahajournals.org/content/119/7/931.short
    Aren’t HDL-c and Tg’s adequate to see what’s going on in the vast majority of cases?
    What about endothelial function? Of course, this is presently not measured in clinical practice.
    Believe me, I care a lot about these issues — I am not trying to be glib. My lipids (mg/dL) are: LDL-c=245;Tg=77;HDL=77. I just had a CT scan result w Agatston score = 0. I have maintained a diet that is probably highly ketogenic (very-low carb, limited protein) for 2 1/2 years. I am 53 years old. I find that a substantial (double-digit) percentage of those on such diets long-term have very high LDL-c. Childhood-epilepsy studies and bariatric-physician experience demonstrates this.
    I think that NMR is a great tool — I am rooting for LipoScience to be successful. But I really think that you are overemphasizing the importance of one risk marker much too much. And the primary clinical use of this tool — prescription of cholesterol-lowering drugs — I believe is totally unjustified in the vast majority of cases.
    I suspect that the LDL particles end up in plaques as a result of their role in the INNATE immune system. Avoid overwhelming this system by avoiding the primary cause(s) of injury to the cardiovascular endothelium, and I suspect LDL-P is meaningless.

    • Hi Ken:

      “I find that a substantial (double-digit) percentage of those on such diets long-term have very high LDL-c”

      Yes reading the most common low-carbs blogs also gives me this impression. But I also think, as Dr. Westman says, that most people are doing low-carb incorrectly – the “Chet Atkins” diet.

      Post-menopausal women stall out on low-carb frequently; and it seems also that middle-aged men on low-carb develop these very high LDL-C numbers. I don’t see any blogs of middle-aged men talking about how low-carb fixed ALL their numbers. But maybe I just don’t know the right blogs?

      Do these guys all need statins immediately or are they doing low-carb wrong? Does everyone need to go back to 30 total carbs and just stay there forever?

      Why do so many middle-aged men and women have inferior outcomes? Is it because they only have 20-30% of their beta cells still functioning?

      Really curious about this. It does seems anecdotally as if most men’s C number rises astronomically after a year or so on low-carb. Maybe Peter will answer this shortly. I hope so!

      • I completely agree with Eric’s assertion (in fact, I’m having breakfast with Eric in an hour). This brings up a much larger question that I’m sure I will detail more closely in this series: It is possible that all of the risk stratification we have for heart disease is predicated on someone consuming a normal Western diet? Furthermore, is it possible that once the body stops relying on glycogen and turns over to metabolic pathways of ketosis that the “numbers” we target as “normal” are irrelevant? I think I know the answer for some physiologic parameters, but I’m still trying to develop my “universal theory” uniting it all.

    • Brilliant, Peter. I wondered the same thing about the validity of data arising from the particular set of humans living at a particular time, while looking at the first (Framingham) chart, above. Even if the study involved a lot of people over a long period of time, the data could still have something or nothing to say about us today.

      In other words, with LDL-P we are still talking about an association, not a cause, right? In the Framingham data selected, how were confounding factors controlled?

      We just don’t know if the predictive power of LDL-P and cardiovascular health, as good as it might be, arises from good diet, bad diet, or some other “lifestyle”, or even another metabolic agent (biochemical activity) . . . do we? For example, what are the chances that any statistically significant group within that Framingham population ate high fat, moderate protein, and low carb?

      (Pedantic aside: to “beg the question” does not really mean “to raise the question”. You like logic, I think, and this phrase is a term of art, a rhetorical flourish, signifying that the question contains its answer, so that the question is redundant.)

      One other unrelated and possibly trivial question: when you refer to the physical structure, the geometry, of the lipoprotein molecule, and the third power of the radius, you imply that the structure is spherical. Your lovely illustration in Part 1 also shows the molecule as spherical. Is it spherical, or is that just a convenience of illustration?

      Forgive the prolixity. Your work is extremely thought-provoking, highly enjoyable, and incredibly valuable. Many thanks indeed!

      Patrick

      • Yes, the particle is a sphere, hence the 3rd power. You are correct about the associate of LDL-P (and every single other disease marker we look at!). Note the “magic wand” experiment I give up front. Absent THAT experiment, we can never know. So we do other things:
        1. We look at populations with seemingly similar enough other traits, yet large enough disparity in 2 factors: the suspect risk maker AND the disease.
        2. We look at experimental interventions that manipulate the suspect risk factor and measure the impact on risk.

        Both of these have problems, though, and I don’t see how we overcome them:
        1. This does not establish true CAUSE and EFFECT.
        2. These interventions do many more things than just impact one risk factor.

    • I’ve been resisting the urge to publish my personal numbers because I didn’t want to have Peter think I was asking for medical advice. 🙂

      However, it looks like I’m not alone here in “statistical outlier land”, and I am very inclined to agree with Ken McKillop: I certainly wouldn’t dismiss the ratios’ predictive power and blindly adopt LDL-P / ApoB absolute numbers.

      First, a few of my personal numbers:
      TC = 297 mg/dL
      LDL = 210 mg/dL
      ApoB = 119 mg/dL
      Now, these three look pretty consistent, right? according to most guidelines and studies, I’m squarely inside the *top* quintile (80%!!!) of arterial disease risk, and any honest doctor following those “lipid hypothesis” guidelines would not let me exit their consultation room without putting me on statins or something of the kind. Which is why I’m currently avoiding “standard” doctors, I simply don’t have the patience to educate them.

      Now let’s take a look at the rest of the profile:
      HDLc = 76 mg/dL
      TG = 51 mg/dL
      ApoA1 = 153 mg/dL
      It’s starting to look a lot better, no?

      Here’s a few ratios taken as “best innovative indicators compared to standard lipid profile” from several studies:
      ApoB / ApoA1 = 0.78
      TG/HDLc = 0.67
      TC/HDLc = 3.9
      LDL/TG = 4.1
      Now, most of these put me in the *bottom* quintile of arterial disease risk. Some even put me in the 10%, 5%, or lower risk category!!

      Add to this a PCR = 0.03 mg/dL, Homocistein = 1.7 mg/L, and Cortisol = 10.9 ug/dL, and what do you get? A very healthy guy!!!

      What is currently protecting me from the maddening effects of cognitive dissonance is my faith in the practical benefits of the lifestyle I lead. I’ve followed a VLC/Paleo diet for almost a year, I exercise moderately but regularly (mostly HIIT), I’ve lost all my extra flab (solidly resting at 12% body fat mass – “looking good naked”) and I’ve got a rock-solid metabolism (much better than the previous 2 decades).

      So, which is it? Am I at a “very high” or at a “very low” risk? We can’t have it both ways, and there doesn’t seem to be much space for grey area with these numbers. My arterial disease risk seems to firmly depend on who I show them to.

      So that was my personal reason for not believing in the “particle concentration gradient” theory.

      Furthermore, I’m an engineer who is used to dealing with complex dynamic systems, filled with feedback loops and hidden state caches. I believe this description applies equally well to both a Human body or a network of computers or an electro-mechanical system. And my experience with complex dynamic systems tells me that you should never just look at a simple number and expect it to tell you all that you need to know. Everything is relative in Nature and Physics, and I expect relative numbers to trump absolute numbers almost in every situation. The devil is in the details: finding the right absolute numbers to build the relative model.

      For each “force” in our bodies there are one or more “forces” that counter it; we are just filled with an enormous amount of feedback loops that up-regulate and down-regulate almost all of the stuff we have in our blood and in our cells, as well as localized reservoirs that will compensate and confound all our efforts to linearise our observations. I can’t just take a simplistic “plumbing” analogy and consider it a realistic one regarding such a complex system.

      In the case of arterial damage, not only is there the concentration of ApoB-containing particles, there are also their oxidation factors, the robustness of the endothelium, and the several reversing mechanisms that remove the toxic cholesterol portion. So an honest scientific approach to the subject cannot and should not look for a single absolute number, taken from a surrogate test, and call it a day. A high-fidelity *independent* model must be built. LDL-P/ApoB looks like a good starting point, but you certainly can’t stop there!!

      Well… that was far longer than I meant to, sorry. 🙂
      And sorry if I came out too harsh, I am merely expressing my frustration with the “state-of-the-art”. 😉

      I’m eagerly awaiting for the instalment where Peter digresses on the contextual difference of Low Carbers and Ketotic people. 😀

      • Vasco, I can’t disagree with anything you’ve laid out. Your logic is sound and the lack of definitive answer only speaks to the gaping holes in our knowledge as I’ve commented on several times (but it’s worth repeating): Everything we have learned in the last few decades about lipidology must be taken a very important caveat — it was learned on a population of carbivores…
        So what should we do about it?

    • Well, for one, we should be a lot more discretionary and integrative in the collection of data.
      Context matters a lot (and it doesn’t take a Denise Minger to find that out) 🙂
      So, maybe we should pool all the data from the Paleo/Primal/LowCarb crowd?… as a physician, you must have a much better idea than I about which data to collect, and when.
      I believe there is already such a web site to collect low carber clinical data, can’t remember the name. Perhaps the “influential leaders” of the paleosphere should launch a campaign on all the blogs to get people to log their data?
      Sure, the credibility of such data would constantly be challenged, but something tells me that this would not be a problem for our community… after all, we wouldn’t have made such life-altering changes if we didn’t trust each other in the first place. 😉

    • Dittos again to Vasco. Similar background and situation and see fully the merit of further research. Very much like the idea of using the paleo/LC community data as a research dataset.

      Can’t wait to see your ‘just the thing,’ Peter. Count me as a willing guinea pig!

    • Peter, is your “just the thing” perhaps a launching study within the NuSI framework?
      As good as that sounds, I was thinking more in the lines of cheaper and more robust data analysis.

      To illustrate…

      You know how the satellite and astronomy people gather their data, right? it’s noisy as hell, filled with distorting factors, but in the end they come out with these beautifully detailed awe-inspiring pictures that show so much high-resolution goodness about our universe and planet that it almost makes us cry. 🙂

      Well, it’s all done by statistical power over astronomic (pun intended) amounts of data. In the computer world, more data is always better, even if it is incredibly noisy. Given enough (noisy) data, the patterns of truth emerge.

      So, in my view, instead of trying to make sure that the data is free of noise (confounding factors) or unbiased, I believe the most productive strategy would be to make sure we have enough of it.

      That’s why I suggested a paleo community project, because this way we could easily harness a million data points, noisy as they would be, and thus have enough data to filter through. Plugging the blood test results of a few thousand low carbers along 3 or 4 year quarters, as well as punching into the same database the equivalent data taken from all the studies already available, would probably allow us to take a fresh look at the results of those long-standing studies.

      I say “get a few million data points”, and let the data patterns emerge by themselves. Instead of continuously falling into confirmation bias traps and wasting time with trial-and-error approaches, get a statistics team to swim in a pool of data as large as the 7 oceans and let them identify the confounders as well as the independent correlations.

      And most of this could be done with the help of volunteers, costing almost nothing (fan of wikipedia and peer-to-peer communities here). 🙂

      Just my two cents.

    • Meanwhile, here’s a few dots for you to connect. 😉

      1.High glucose concentrations induce TNF-alpha production
      2.TNF-alpha disrupts endothelial function

      I just ran a fast search and diagonally scanned the papers, I’m sure you’ll find lots of objections about applicability and relevance. There are probably many better studies to enforce this thesis, but I’m not a full time researcher who is paid to write reviews. 🙂

      Still, this is the sort of thing I expected to see researched nowadays – what links metabolic syndrome to arterial disease? – not the same old thing of trying to eek out predictive power from lipid panels.

      It also reinforces my growing notion that cholesterol numbers mean little to nothing regarding arterial disease in the case of LCHF practitioners.

      • Vasco, if there’s one thing I like about you (and there are many!), it’s that you’re always willing to admit the limitations of something. This work, as you suggest, is no exception. It’s tempting in science to look at interesting studies, like these, and extrapolate to other states. This is not necessarily a bad thing, but when we do this at the expense of millions of patient-years in data that we have on other more well understood mediators of CVD, it’s a bit like saying the credit crisis we’re still in is due to the fact the real estate agents are paid commission only on the sale price of a house. Sure that fed into the problem, but it wasn’t the first-order term. Besides, agents have always been paid commission in that fashion. What was unique in this case was the confluence of events: exceptionally cheap capital, mass securtization of loans, an after-market for said securitized loans, and horrible lending practices. Which of these events, if not present would have prevented the greatest destruction of wealth we’ve ever seen? I’d argue if interest rates were higher, lending practices were reasonable (e.g., LTV must be less than 80%), and lenders had to keep some amount of risk on their books, none of this would have happened. Did the fact the real estate agents had incentive to sell house to anyone, even if they couldn’t afford it, make it worse? Of course. But to say that caused the problem in the first place is to miss the point.

        Inflammation clearly makes this problem worse, but to negate the effect of the molecules that actually carry the cholesterol into the subendothelial space and start this inflammatory process is also missing the point. I can tell I’m not going to convince you of this, but hopefully I can provide a balanced counterpoint for others to make up their own mind.

    • No, Peter, you’ve already convinced me with this quite analytical and detailed model. 🙂
      According to the available evidence, inflammation is a consequence, not a cause. Fine. 🙂

      But I still think that LDL-P is NOT the first-order causal factor in atherosclerosis.
      You know, I’m re-reading GCBC, and the whole chapter about insulin and cardiovascular disease makes me wonder how you could name your blog (initially) as “The War on Insulin” and then forget about insulin in this series of articles about cholesterol. 😉

      In fact, according to Taubes, the smoking gun of arterial wall disruption is most probably in the hands of insulin.
      To me, it looks like it is the combination of active disruption (by insulin and blood sugars) AND the available by-standing ammunition (Apo-B containing lipoprotein particles) that is responsible for atherosclerosis.

      Which begs the question (which I take it is being observed in people like me), that perhaps a high Apo-B particle count (high LDL-P) is NOT much more atherosclerotic than a low LDL-P, while in the *absence* of high insulin?…

      So the first-order factor in this disease can very well be insulin resistance and corresponding hyperinsulinemia, with LDL-P being just a powder keg to fuel the fire. Taubes pretty much summarized the data for this case; is there any evidence to the contrary?

      We know that these studies are biased toward carb-eating populations, so… the question remains, I think, open.

      • Vasco, here’s my response to your similar question on the other post:

        This is a very good point, Vasco, and it is the heart of the argument/thesis put forth by folks like Gary Taubes, Eric Westman, and several others, as to why the standards of predictive cut-offs may not apply to the population you describe. However, until we do a properly designed clinical trial to test this hypothesis, it remains a hypothesis. It makes sense, I agree, but we only have bits of the story worked out. Remember the words of Thomas Henry Huxley (Darwin’s “bulldog”): “The great tragedy of science is the slaying of a beautiful hypothesis by an ugly fact.”

    • Sorry for the duplicate comment, Peter, I initially put it in the wrong post and then requested its deletion, but I guess it didn’t work out. 🙂
      So, this NUsI trial that is coming forth, will it cover this angle of insulin too? Or is it just designed to eliminate the confounders of carb-loaded nutrition?

  10. I just received my cholesterol numbers from my doctor after experimenting with a diet comparable to yours–almost identical even–for the last five months. My doctor had a panic attack. My total cholesterol was 457, the highest it has ever been. My HDL was 65. My LDL was 377, which constrained the nurse to tell me to lower these levels in the next four months or statins could be in my future. Of course, the size dimension of the LDLs wasno part of the test. Nor did she specify my triglyceride level, which annoyed me.

    Those are high numbers, I will admit. I’m committed to this diet–it has provided nothing but weight loss and energy for me–but I’m unsure how I should address these numbers with my doctor.

    • Hi Shane,
      Interesting — your numbers are unusual (like mine) but not rare at all on a ketogenic diet. Your doc MUST have the Tg number, by the way, unless your panel was unfasted and LDL-c measurement was direct. It’s possible but I doubt it. I think you might be interested in this interview: https://livinlavidalowcarb.com/blog/ask-the-low-carb-experts-episode-15-exploding-the-low-carb-myths-dr-eric-westman/14183
      In it there are two questioners like us, and Dr. Westman indicates that this type of lipid profile is “classic” for long-term low-carb dieters. You are not yet “long-term”, and part (or even all) of your increase in LDL-c could be due to “transient hypercholesterolemia” — a well known effect following change to low-carb. I recommend strongly against statins or other drugs. I know of about a dozen low-carb bloggers with lipids similar to ours. They are all in excellent health. Barry Groves has been doing it longest — four or more decades, I think.
      I would also recommend to you the same as in my reply to Larry Sumners.
      Bon chance, mon ami!

    • Hi Shane,

      “the highest it has ever been”

      Again, anecdotally from reading the common blogs, it seems as if men really don’t get better numbers for 6-9 months after they’ve changed to low carb. Especially if you are losing a lot of weight. So if the blogs are any guide, you may have tested too early.

      Following NANY’s advice, you should drop your daily carbs by 10g total a day at least, or even go down to 20g total period and stay there for several months. Then go for your retest. You may have more metabolic damage than you think, and as a result, a very low carb tolerance.

      If that doesn’t work, I guess Peter would recommend you think about drug therapy. But you have to find out what works for you, right? N=1 as they say. Good luck and don’t give up!

      • Actually, what I would recommend is asking the same questions I posed to Peter-NZ with respect to vit K supplementation. Which is the bigger risk?

        1. NOT taking drug X to lower your LDL-P, assuming the results of the trials are relevant to YOU (the only person who matters)?, or
        2. Taking drug X, assuming the opposite?

    • Shane, I’m not an expert in this, but my understanding is that if you are in the process of losing fat mass (weight), then your lipid profile can be skewed by this (after all, you’re dumping pure fat from your fat cells into your general circulation on top of what you are eating). So maybe once you are weight stable, your lipid profile may be more predictive. It would be interesting to see what Peter or Dr. Dayspring’s experience is with this.

      • This is correct, though I can only comment from personal experience and that of others. I actually am not familiar with this body of literature.

    • Shane,
      What were your numbers prior to starting a paleo diet?
      Are you losing weight?
      Do you have access to apoE genotype testing?
      Google ‘ApoE and diet’ and you will get some additional info that may be helpful…

    • I followed Ken’s link above to the podcast interview with Dr. Eric Westman.

      Dr Westman makes a rather interesting observation. If LDL-C plays a beneficial role (he mentions the transportation of vitamins, and like Dr Attia he uses the boat-cargo metaphor), then we should be cautious about intervening to reduce LDL-C, and perhaps not concerned about a supposedly high number. After all, if it’s doing something good, why try to eliminate it? And when we raise it, we are not choosing to raise it per se; rather, it rises as a consequence of following a healthy diet. Gary Taubes observes, in WWGF, that it’s difficult to accept the idea that a diet that is good for you can also be bad for you. Also note, as we understand, thanks to Dr Attia’s seminar here, LDL-C does not equate to LDL-P, and does not correlate with risk for atherosclerosis.

      As Vasco points out, there are multiple moving parts that are linked in this system involving the lipids and cardio-vascular network. You manually tinker with one thing, and you can expect other components automatically to change their functioning too. The law of unintended consequences operates.

      In writing this, I’m passing along my own self-reassurance about the standard lipid panel results (mine show similarly so-called high LDL-C, calculated, and directly measured via VAP). I’m aware of the confirmation bias–I’m surely finding evidence to support what I already want to believe. But that does not mean that it’s wrong, either.

      • It’s a fair point, and Eric Westman and I had breakfast yesterday and discussed this exact issue at length. I think it’s safe to say we both agree the answer is not known. His hypothesis is reasonable, but not really tested rigorously. One could make the same point about my hypothesis, given that everything I’ve extrapolated is based on people eating carbs.

  11. P.S. I should have included one apo-B test resulting in a reading of 165mg/dL. I think that this would convert to an LDL-P = ~2300nmol/L. My LDL-c = 243mg/dL at the same time.
    My fasting insulin is <2mIU/L (below lowest measurable reading w commercial equipment).
    Interesting, eh? What do you think, Peter?

    • apoB suggests a high LDL-P, but the conversions are best-guesses. Might as well find out. Get a sterol panel while you’re at it. You sure don’t “look” IR, but I would not be comfortable with numbers that high.

    • Ken, you may be interested to know that my apo-B and LDL-C numbers are identical to yours. Apo-B is 162 mg/dL and LDL-C is 242 mg/dL, but I also happened to get an NMR test at the same time and my LDL-P measured pretty high at 3198nmol/L. This is after 1 year of eating HFLC, the last 6 months of which I’ve remained at a stable weight.

  12. So what does it mean if you have high LDL-P and LDL-C and high HDL but very low trigs and you’re on a paleo diet?

    NMR test results

    LDL-P 1500nmol/L
    LDL-C 188mg/dL
    HDL-C 59 mg/dL
    Triglycerides 36 mg/dL

    HDL-P 28.5 umol/L
    Small LDL-P 127 nmol/L Ref range <= 527

    • If the total particle count is high but appx 91.5% of it is large and only appx 8.5% is small and dense is that really bad?

      • Yes. A particle is a particle. Statistically speaking, someone with lots of large particles will have fewer, but once you know the particle number, size doesn’t predict risk.

    • Hi Charles:

      “very low trigs and you’re on a paleo diet”

      I guess from what Peter has written, your low trigs are because you’ve been good about avoiding wheat and sugar. However, many people on the paleo diet now eat potatoes and rice.

      So my first thought – derived from Dr. Westman – is that you may still be eating too many carbs for your personal tolerance. Your beta cells may be damaged from decades of the SAD. Have you considered dropping your carbs to 30g total a day for 6 months and then re-testing?

      I know quite a few people on the Atkins forum used to be paleo but came back to Atkins because they saw that they needed the very strict framework of the Atkins plan. Have you ever considered that your current paleo plan may be too liberal for you right now?

    • Charles,
      Lest you think that your LDL-P is HIGH — it is right around mean for healthy males with no CVD, according to this paper/study by Otvos, Cromwell et al (Table 1): https://www.ncbi.nlm.nih.gov/pmc/articles/PMC2720529/
      Note in Table 2 also that your LDL-P is well below mean for your category (low Tg’s/high LDL-c).
      Your numbers look great from my point of view (but then, I am admittedly biased :))

  13. This study found that the association between mortality rates and familial hypercholesterolemia has varied greatly over time:

    https://www.ncbi.nlm.nih.gov/pmc/articles/PMC31037/?tool=pubmed

    The authors conclude:

    “We found that the excess mortality from familial hypercholesterolaemia varied over time. In the 19th century, mortality seemed lower than in the general population. It rose after 1915, reached a maximum during the 1950s, and decreased thereafter. During the decades with excess mortality, survival in the branches of the pedigree differed significantly, ranging from normal life expectancy to severe excess mortality. This large variation of risk suggests that previous studies, with families based on selected patients, may have overestimated mortality. Moreover, such large variation in mortality in two directions (over time and within generations) in a pedigree indicates that the disorder has strong interactions with environmental factors.”

    I wonder how LDL-P correlated with heart disease risk in the 19th century.

    • I wonder how homogeneous this population was over time, also? Studies with heterogeneous populations will always have trouble correctly identifying relationships between risk and mortality. I’m guessing people were dying of infectious diseases so rampantly in the 1800’s that dying of heart disease at 45 wasn’t a big enough difference to account for their disease.

    • But isn’t it true that your analysis shows the COMBINATION of high LDL-P levels and the other characteristics of the subjects in the studies are associated with higher risk? For example, it’s possible that high LDL-P combined with a standard diet of highly-processed food is where the risk lies.

      Wouldn’t good science control for these concomitant factors? Isn’t it possible that someone with a very different diet from the subjects in the studies could have high LDL-P but low mortality risk?

      • Yes, but the problem is virtually everyone in these studies is consuming a “standard” diet. Additionally, they typically do not even attempt to control for diet. It just hasn’t been a focus, unfortunately.

  14. Great series, I learned a lot. I have a couple questions though:
    1. If the partial pressure (concentration) of LDL-p causes the particles to migrate behind the endothelium wall, the this action should be observed for all particles in the blood (as long as they fit). What makes the APO-B particles so pathogenic, and not other particles that may be floating in the blood?
    2. If someone’s metabolism is fat-adapted, and they burn triglycerides as their primary fuel,and the triglycerides are carried by LDL, would that cause higher blood trigs, and more LDL particles? It seems to be if we are buring fat, then there would be more of it in our blood stream.

    • Good questions. Question 1 has been answered a few times previously by me and Tom Dayspring (look back at Parts IV and V) in the comments section and the actual post.
      Question 2: it’s actually the reverse. The person whose body is primarily burning fat virtually always has lower circulating TG for 2 reasons:
      1. Their muscles are consuming it (instead of only glycogen), and
      2. The type of diet necessary to induce this metabolic state largely precludes carbohydrate ingestion which, as far back as the 1950’s has been unambiguously associated with more TG exporting from liver and higher circulating TG.

    • Dietary fat is packaged into chylomicrons in the intestines. These are similar particles to VLDLs but different in that they use the apoB-48 protein rather than the apoB-100 which is used in the liver to create VLDL/LDL and HDL. As Doc says, sugars create triglycerides. Exogenous fat never hits these pathways. The 100 version is the measure of LDL-P.

  15. Is there an equation to convert apoB to LDL-P? My doctor uses Berkeley Heart Labs, so I already have the apoB value (which I think is measured, not calculated).

  16. Peter, I would like to suggest a question for the NMR folks. The Krauss study that I cited implies that stronger risk indicators can be designed based upon functions of multiple subfractions of various lipoprotein classes. Using just one number such as LDL-P is, I believe, throwing away info that is in the NMR lipid panel. Krauss may be keeping his PC1/2/3 formulas “proprietary”, but I am sure that the LipoScience people could generate similar risk functions from MESA cohort and so forth. Why don’t they? Wouldn’t this better differentiate them and help market their instrumentation?

    • Hopefully they have a chance to read your question. This weekend is the largest lipid meeting of the year, so I know they are busy, but perhaps next week Tom or Jim may see this and comment. The problem with “proprietary” formulae (same for VAP’s estimate of apoB) is that they are not able to tested by others and peer-reviewed.

  17. Dr. Attia: This series, and your whole site has taught me so much. One of the special qualities of your site is that you are constantly replying to comments. I dare say, I might learn more from the excellent questions and your replies. At a minimum, they fill in the gaps in my understanding. Please keep up the great “give and take” with the comments made.

    • Thanks, Bobby. I’m not sure I’ll be able to keep up quite the same pace of response, but fortunately you as readers seem pretty capable of doing so in my absence.

  18. “Furthermore, is it possible that once the body stops relying on glycogen and turns over to metabolic pathways of ketosis that the “numbers” we target as “normal” are irrelevant? I think I know the answer for some physiologic parameters, but I’m still trying to develop my “universal theory” uniting it all.”

    Care to elaborate on which numbers could become irrelevant with ketosis?

    • At the risk of nullifying I’m in the process of explaining with respect to cholesterol, it’s possible (i.e., needs to be tested) that EVERY one of these risk predictors is irrelevant in someone who is ketogenic.

    • Well if a guy can win a Nobel Prize for giving himself an ulcer, I’d say proving THIS is worth a trip to Stockholm. And I hear low-carb high-fat is big in Sweden…

Facebook icon Twitter icon Instagram icon Pinterest icon Google+ icon YouTube icon LinkedIn icon Contact icon