
In medicine, “normal” is often erroneously used interchangeably with “optimal.” Not only are these two words not necessarily synonyms, their individual definitions – and how closely one approximates the other – are subject to change with changing populations and advancements in scientific knowledge. (Two centuries ago, a normal life expectancy was around 30-40 years, but I doubt anyone would call that normal or optimal today.) This semantic problem was highlighted in a 2020 study investigating the relationship between serum triglycerides (TG) and cardiovascular disease (CVD) risk: is “normal” really “optimal?”
What are triglycerides (TG)?
Triglycerides – also known as triacylglycerols – are composed of three fatty acid molecules bound to a glycerol backbone. Serum TG is a component of a standard lipid panel, which, in addition to TG, typically reports several cholesterol metrics – total cholesterol, low-density lipoprotein cholesterol (LDL-C), high-density lipoprotein cholesterol (HDL-C) and non-HDL cholesterol. TGs affect the structure, size, composition, catabolism, plasma residence time, clearance, functionality, and concentration of all lipoproteins, including both the potentially atherogenic apolipoprotein B (apoB) family and the apoA-I (HDL family), yet historically, unlike all cholesterol metrics, TGs have not been included as part of CV-risk algorithms apart from their contribution to the definition the metabolic syndrome (though it’s always noted that at fairly extreme levels, typically >500-800 mg/dL, TGs increase the risk of acute pancreatitis). Indeed, there has long been a debate on whether serum TG constitutes an independent risk factor for CVD – and if so, at what levels.
Over time, the guideline-recommended TG threshold for considering treatment has dropped from 250 to 150 mg/dL, and currently, TG levels <150 mg/dL are usually described interchangeably as ‘‘normal’’ or ‘‘optimal.’’ But does this really mean that TG levels below 150 mg/dL are of no concern for CVD risk?
About the Study
The 2020 study, conducted by researchers at Duke University, sought to shed more light on TG levels and risk of CV events – defined as a composite of myocardial infarction, stroke, and cardiovascular death. The researchers selected patients ages 40-65 years of age from the Atherosclerosis Risk in Communities (ARIC) study and the Framingham Offspring Study (FOS), which were conducted between 1987-2013 and 1971-2008, respectively. After excluding patients with prevalent CVD, the final cohort was comprised of 8068 patients (n = 6012 from ARIC, n = 2056 from FOS, median follow-up = 10 years), the majority of whom were not on lipid-modulating drugs. As a primary variable of interest, the investigators used average serum TGs over time, as averaging TGs minimizes the “noise” in the measurements and decreases the impact of outliers, and this value was found to be more highly correlated with CV events than either baseline TGs or maximum prior TGs. A distribution of TG levels in male and female cohorts is shown in Figure 1 below.
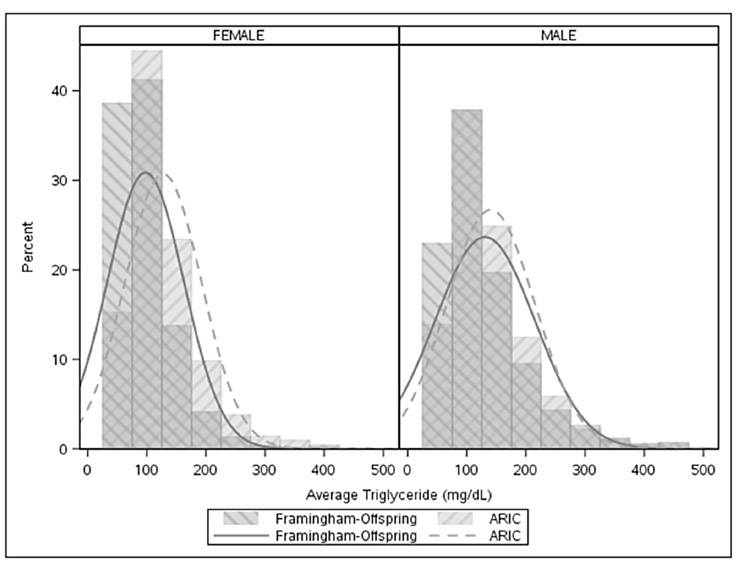 Figure 1: Distribution of TG levels in each cohort by sex.
The Findings — TG Levels & Risk of Cardiovascular (CV) Events
The investigators examined associations between the TG/HDL-C ratio and CVD events in both univariable and multivariable modeling, adjusting for age, sex, body mass index (BMI), diabetes, non–HDL-C, and statin use within the cohort. The graph below (Figure 2) illustrates the relationship between TGs and CVD risk in univariable analysis (i.e., an analysis in which only one independent variable – TGs – is examined). In contrast to conventional wisdom that TG levels <150 mg/dL are “optimal,” these data demonstrate that the positive correlation (the upward-sloping portion of the graph) between CVD risk and average TG levels begins at TG levels around 50 mg/dL. Above this level, risk continues to rise with increasing TGs, with each doubling of serum TGs corresponding to a CVD risk increase of 65% (HR: 1.65, 95% CI: 1.47–1.85). The relationship starts to weaken around 150 mg/dL before almost completely leveling off above 200 mg/dL, indicating that increases in TGs above 200 mg/dL confer no additional CV risk.
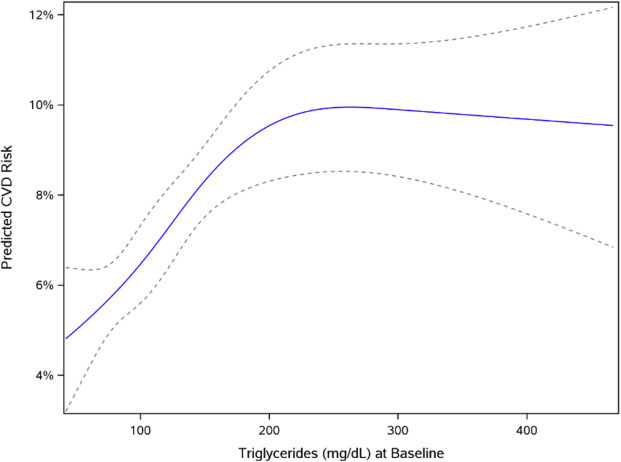 Figure 2: Univariable model of association between average TG and CVD risk.
Dotted lines represent the 95% confidence interval.
Are TG levels the best metric for CVD risk?
However, when the investigators modeled this relationship with multivariate analysis – including non-HDL-C as an additional variable – the statistical significance of the association between serum TGs and CVD risk was abolished (HR: 1.14 per doubling of TGs, 95% CI: 0.97–1.34, P = .11). That is to say, differences in non–HDL-C accounted for most of the association between TGs and CVD.
Non-HDL-C is highly (though not perfectly) correlated with apoB – more so than LDL-C, which, when substituted for non-HDL-C in multivariate analysis, resulted in a dampened but still significant association between TGs and CVD risk. Thus, these results suggest that the risk associated with TG levels may be due to elevations apoB–containing lipoproteins (remnants and LDLs). This is consistent with genetic studies which have shown that the risk associated with elevated TGs can be accounted for through their association with elevations in apoB, in which case, measurement of apoB itself would provide the most accurate information about CVD risk. In other words, when it comes to CVD risk assessment, apoB levels supersede TG levels – though TGs should still be measured in order to identify those with very elevated (>500 mg/dL) levels, which would signal high risk of pancreatitis. Unfortunately, apoB is often not included in standard lipid panels, and thus, TGs (and, if available, non-HDL-C) may provide valuable – albeit imperfect – information on CVD risk in the absence of apoB measurements.
Differences in Men vs. Women
Interestingly, the relationship between TG and CVD risk varied significantly between men and women, with a stronger association for women vs. men (HR: 1.79, 95% CI: 1.50–2.14 vs HR: 1.34, 95% CI: 1.15–1.55). In women, the CV-risk rose more gradually with TG levels than in men, yet continued to increase over a much broader TG range, up to 200 mg/dL (Figure 3). Astonishingly, the risk in men appeared to increase steeply with rising TGs well below 100 mg/dL, at which point it began to level off. These remarkable differences strongly signal a need for gender-specific guidelines for what constitutes “optimal” TG levels.
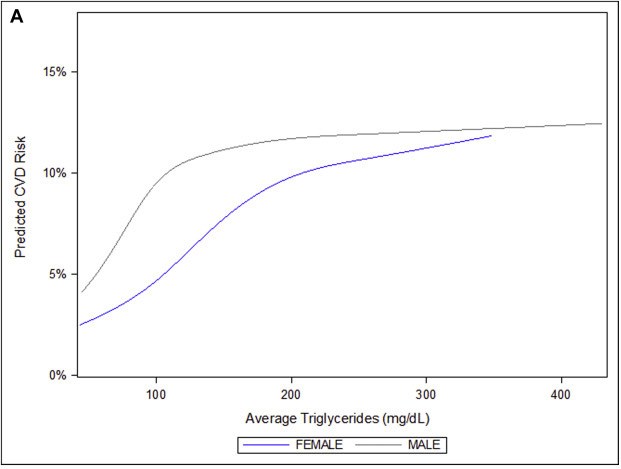 Figure 3: Association between the average TG level and CVD risk based on sex.
The “Optimal” TG Range
Over a decade ago, the American Heart Association released a statement suggesting a new designation of TG levels: a range of “optimal” TGs, distinct from the range of “normal.” The proposed definition for “normal” remained at <150 mg/dL, continuing to reflect the majority of the American population despite the knowledge that such a level approaches (males) or exceeds (females) the 75th percentile population cutpoint. However, the statement suggested a threshold for “optimal” at <100 mg/dL, a reduction that is supported by the study conducted at Duke. Although these data further indicate that truly “optimal” TG levels may be even lower than 100 mg/dL and may differ significantly between men and women, the critical point is now to recognize that lipoprotein-related CV risk is more accurately reflected by the number of apoB-containing lipoproteins rather than their TG content. The knowledge that apoB may be a more direct metric of CV risk than TGs should prompt the medical community to rethink conventional interpretations of TG levels when apoB information is not available. In short, this study demonstrates that when it comes to triglycerides, “normal” is not synonymous with “optimal.”


