
Want to catch up with other articles from this series?
- Studying Studies: Part I – relative risk vs. absolute risk
- Studying Studies: Part II – observational epidemiology
- Studying Studies: Part III – the motivation for observational studies
- Studying Studies: Part IV – randomization and confounding
- Studying Studies: Part V – power and significance
- Ask Me Anything #30: How to Read and Understand Scientific Studies
Motivation for observational studies
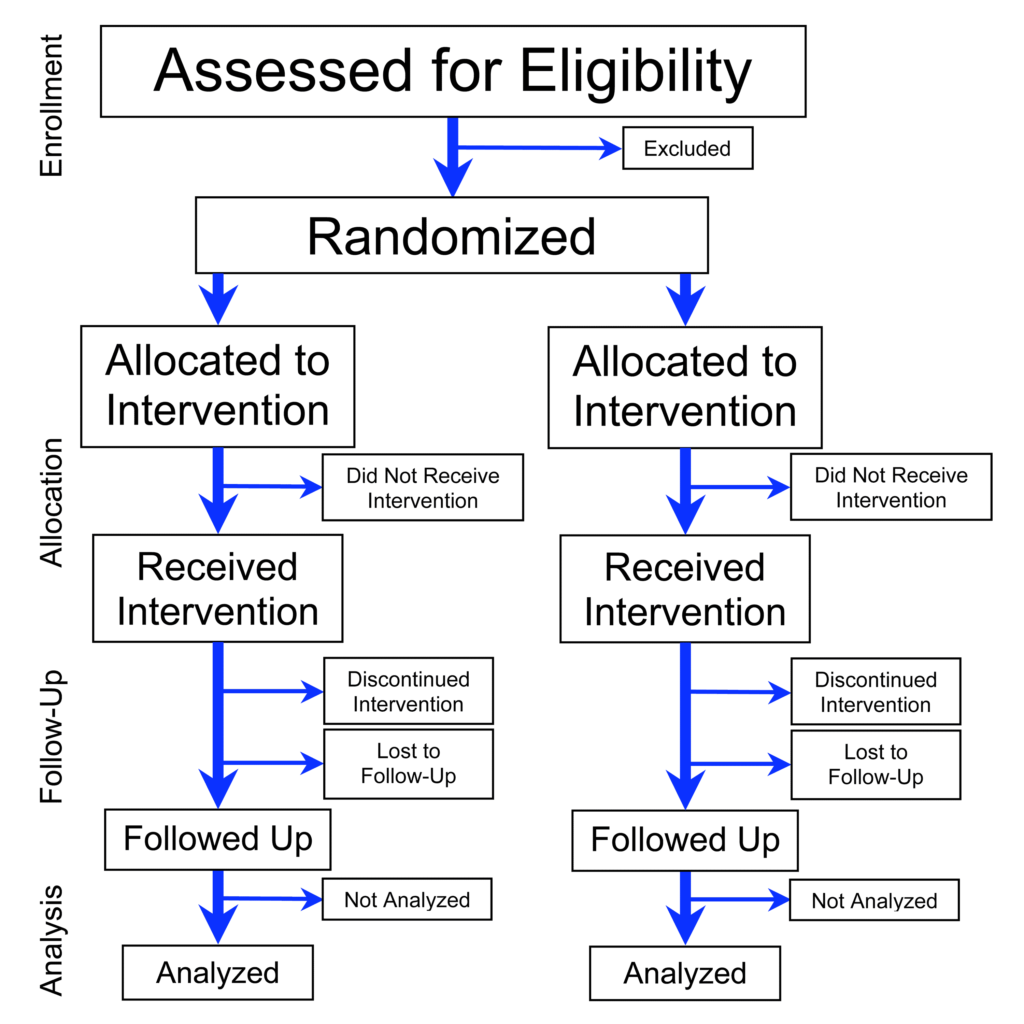
The randomized-controlled trial (RCT) is often considered the gold standard to determine the risk or benefit of a particular intervention. By randomly allocating alike participants into a treatment or control group, much of the bias encountered in observational studies is reduced substantially.1RCTs are not immune to bias. Not even close. RCTs are prone to many of the same biases that seep into observational studies. There are additional biases that RCTs attract because of the experimental and randomized approach, performance bias being a prime example. Investigators can more confidently assess and control variables. In short, an RCT makes it possible to distinguish the relationship between cause and effect.
If RCTs are the gold standard, why don’t we use this rigorous approach more often to confirm or refute the relationship between exposures and diseases?2When we refer to epidemiology, we’re using observational epidemiology and epidemiology interchangeably—in both cases we’re discussing attempts at quantifying an effect of an observed exposure and outcomes.
RCTs are expensive
One analysis looked at all RCTs funded by the US National Institute of Neurological Disorders and Stroke (one of the institutes of the NIH) before the year 2000 in order to determine the average cost. They found 28 trials with a total cost of $335 million, an average cost of $12 million per RCT.
The Women’s Health Initiative (WHI) Clinical Trials (three different experiments), for example, designed to test the benefits and risks of dietary modification, hormone replacement therapy, or HRT for short,3There was both an estrogen plus progestin arm, and an estrogen-only arm for women who had a hysterectomy and calcium and vitamin D supplements on the health of postmenopausal women, was estimated to cost $625 million. An average cost of about $208 million per trial.
RCTs are long
According to one study, the median time from start of enrollment to publication of randomized trials was 5.5 years.4Longer for negative trials than for results favoring an intervention arm, with median times of 6.5 and 4.3 years, respectively
The WHI HRT trials had a planned duration of 8.5 years, though the estrogen plus progestin arm of the trial (and its corresponding placebo-controlled group), was stopped at 5.2 years—leaving the estrogen-only arm and placebo-controlled group in the trial—which, too, was halted 1.6 years later (at 6.8 years total). It can often take decades to take a clinical trial from inception to results.
Quality RCTs are hard to do
RCTs are often considered the most rigorous way of determining a cause-and-effect relationship between intervention and outcome. However, that rigor must be earned. There are many challenges to the integrity of a well-done RCT. These trials need to establish falsifiable hypotheses and clear objectives, proper selection of endpoints, appropriate subject selection criteria (both inclusionary and exclusionary), clinically relevant and feasible intervention regimens, adequate randomization, stratification, and blinding, sufficient sample size and power, and anticipation of common practical problems that can be encountered over the course of an RCT.
Randomly assigning 48,836 postmenopausal women into either a low-fat diet—40% of participants, with the goal of reducing energy from fat to 20% and energy from saturated fat to 7%—or self-selected dietary behavior in the WHI’s Dietary Modification Trial, for example, brings about many challenges.
RCTs can’t (deliberately) test harmful effects
RCTs can randomly assign people to groups with guidelines that the investigators expect will either have a health benefit (i.e., intervention group) or will not have an effect on health (i.e., control or placebo group). But they can’t assign a group to an intervention that they expect will do harm to the people. In this sense, RCTs run counter to epidemiology: RCTs try to establish cause-and-effect relationships that help the individual whereas epidemiologists try to establish associations that harm the population.
Take cigarette smoking, for example. The tobacco industry could argue that there was no definitive proof of cigarettes as a cause of lung cancer until a rigorous randomized experiment (which has never been done to our knowledge) showed this to be the case.
On the issue of cigarettes and lung cancer, Evarts Graham, a pivotal investigator in the link between the two, conceded in the Lancet in 1954, “One must grant that indeed no absolute proof has been offered.” Graham noted that to satisfy, “the most obdurate of the die-hards,” it would be necessary to do the following:
- “Secure some human volunteers willing to have a bronchus painted with cigarette tar, perhaps through a bronchial fistula.
- “The experiment must be carried on for at least twenty or twenty-five years.
- “The subjects must spend the whole period in air-conditioned quarters, never leaving them even for an hour or so, in order that there may be no contamination by a polluted atmosphere.
- “At the end of the twenty-five years they must submit to an operation or an autopsy to determine the result of the experiment.
“I will say to those who wish to volunteer for such an experiment, ‘please form a queue to the right; no crowding please.'”
There is truth in jest. Even when the associations are quite large, observational studies don’t provide definitive proof. Even so, one of the challenges in medicine is we have to act (or not act) with the information available. Were observational studies helpful in establishing more reliable knowledge about cigarette smoking as an important risk factor in lung cancer? Yes. Are observational studies capable of identifying small effects in a large disease with almost an infinite number of variables to look at? Probably not. But doing a clinical trial on a reported harmful effect is a non-starter.
Granted, epidemiology is a switch-hitter in this regard: observational studies can not only look for risks, it can also seek associated benefits of a drug, a food, or a component of lifestyle, for example. However, its batting average is well below the Mendoza Line in determining cause and effect. Critics noted (in 2011) that when observational claims were then tested in subsequent randomized trials, those claims touted an 0-for-52 success rate (i.e., none of the claims replicated in the direction claimed in the observational studies). Please re-read that last sentence. Then read it again.
Not only that, in the same analysis, there was statistical significance in the opposite direction five times (i.e., something that was believed to helpful resulted in harm, according to the RCT). While there are limitations to RCTs, they are generally required to determine whether a hypothesis with a relatively small association is more true than false (or vice versa).
From a public health perspective, a small effect can have a large and predictable impact. “If we can delay the onset of Alzheimer’s by five years, for example,” said Lon Schneider, director of the California Alzheimer’s Disease Center, “the incidence of the illness would drop by half,” so the argument goes. These kinds of examples provide the kind of motivation for public health authorities to look far and wide for relatively small risks that inherently can’t be tested in RCTs. So, what type of studies do epidemiologists employ to determine benefits and risks in populations? Retrospective and prospective cohort studies. Before we dig into the nuts and bolts of these types of studies, it helps to spend a moment to appreciate the biases that often threaten their validity.
§
Biases are “the combination of various design, data, analysis, and presentation factors that tend to produce research findings when they should not be produced, writes John Ioannidis in “Why Most Published Research Findings Are False.” A more succinct way to put it, as Lewis and Warlow did: bias is “any departure of results from the truth.”
Healthy-user bias
People who are health-conscious are different from people who are not in myriad ways. Does red meat cause colon cancer? (The World Health Organization seems to think so.)
Health-conscious people tend not to live under rocks: they’ve repeatedly heard that red meat is hazardous to their health and they try to act on it. Generally speaking, people who tend to eat more red meat are less health-conscious, or care less, than their healthy-user counterparts. People who eat less red meat may be less likely to smoke, more likely to exercise, more likely to have access to healthcare, more likely to eat fruits, vegetables, spices, expensive vitamins, and avoid soft drinks. The list is virtually endless. Even when investigators are aware of these tendencies, they are virtually impossible to properly account for.
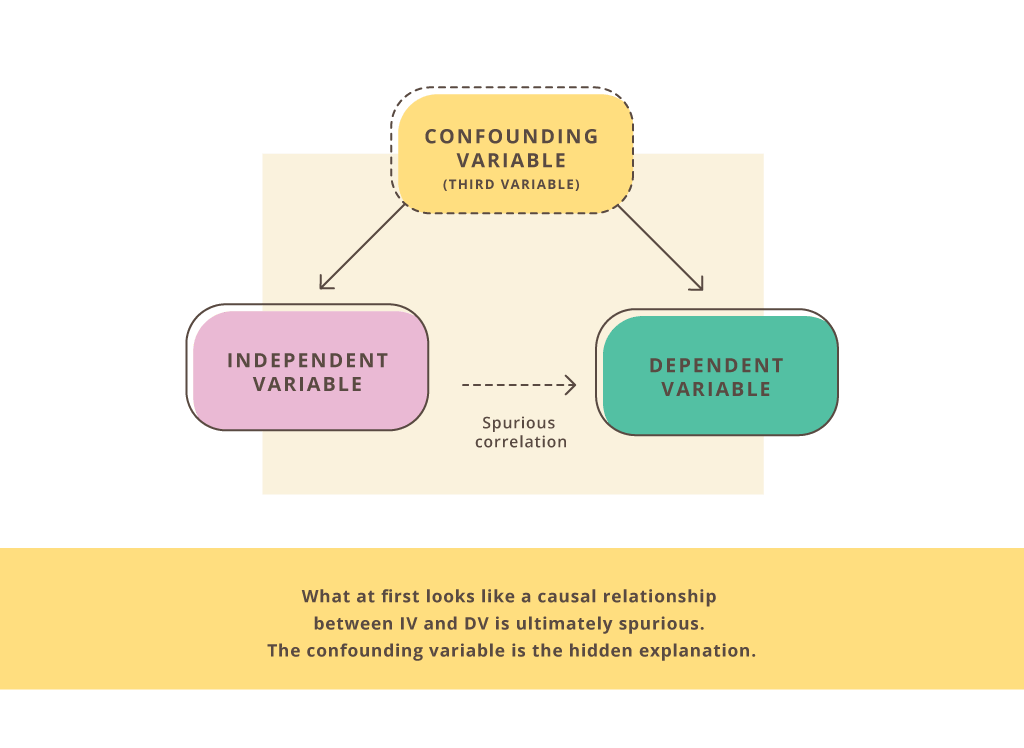
Confounding bias
This is an extra variable that was not accounted for. (A confounding variable “confounds” the data.) It can suggest an association between two other variables that really isn’t there.
Does being obese increase the risk for type 2 diabetes—independently of insulin resistance, blood pressure, blood glucose, triglycerides, HDL-C, and abdominal fat (i.e., the cluster of abnormalities that constitute metabolic syndrome)?
Information bias
A distortion in the measure of association due to a lack of accurate measurements. For example, errors in accuracy or completeness of the recollections “recalled” (recall bias) regarding events in the past.
The use of annual food frequency questionnaires by observational studies to discern dietary and lifestyle habits is particularly illuminating. In 1989, the Nurses’ Health Studies (NHSs) “validated” their questionnaires with four detailed 7-day dietary records in which participants were instructed to weigh and measure all of their food, completed each quarter of the year. The investigators found that the FFQs predicted the “true”5Validated by the four 7-day dietary records intake of some foods well, and other foods not-so-well. What were some of the foods that the FFQs poorly predicted? Bacon (19%), meat (12%), processed meats (11%), hot dogs (4%), and hamburgers (1.4%).
Reverse-causality bias
The order of the supposed cause and effect is turned around (also called cart-before-the-horse bias).
Diet soda is associated with obesity and some suggest that diet soda can cause weight gain. However, it may be the case that people who are overweight or obese are more likely to drink diet soda.
Selection bias
The selection of subjects into a study, or their likelihood of staying in the study, leads to a result that is not representative of the target population. What are the inclusionary and exclusionary criteria of the study? What type of people agree to participate in a study in which they will be asked to reveal personal information, provide blood samples, and dietary and lifestyle habits?
In the WHI HRT trials, for example, the women had to sign off understanding they’ll either receive hormones or nothing, but they won’t be allowed to know if it’s the former or the latter. What type of people don’t agree to participate in this study? What type of people do?
Sometimes groups of workers will be compared to the general population (healthy-worker bias). The Nurses’ Health Study, for example, one of the largest ongoing observational studies, is conducted in a population of (not surprisingly) nurses. Healthier people, in general, are more likely to be employed. The general population is likely to encapsulate more unhealthy people than an occupational cohort.
In some studies, participants can be lost to follow-up (lost to follow-up bias). In this case, the investigators have not been able to follow some subjects and don’t know what has happened to them (i.e., whether they developed a disease or not). This leads to selection bias when the loss to follow up is not similar in the exposed and unexposed groups.
§
Retrospective cohort studies
Sometimes investigators perform a study where they look back in time (i.e., retrospectively) to identify a particular characteristic and an outcome of interest in a cohort, or group of individuals.6For a practical example of a cohort, scroll to the 5:00-mark of this video. At the beginning of this type of investigation, the outcomes have already occurred, before the study was conceived. Therefore, this is a retrospective cohort study.
In 1950, JAMA published a landmark article, “Tobacco Smoking as a Possible Etiologic Factor in Bronchiogenic Carcinoma: A Study of 684 Proven Cases.” This was a retrospective study. The investigators, Ernst Wynder and Evarts Graham, interviewed and included 605 patients with bronchiogeneic carcinoma (i.e., lung cancer). Wynder and Graham reported that cigarette smoking was an important factor in the increased rates of lung cancer seen in the US (Figure 2). They also noted that lung cancer could occur among nonsmokers and that heavy smokers didn’t necessarily get lung cancer.
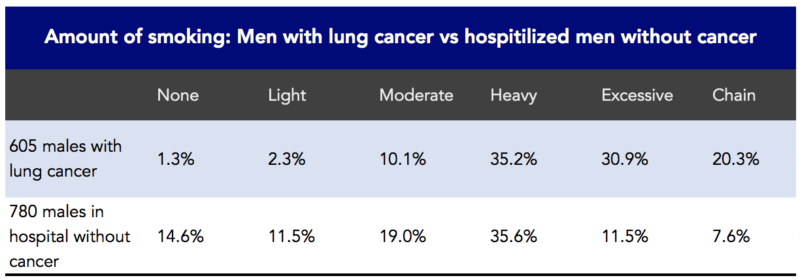
Figure 2. Association between the amount of smoking and 605 males with lung cancer in a retrospective study. Data from Wynder and Graham, 1950.
Retrospective cohort studies are prone to confounding and bias. Confounding represents any variable that could explain the association between two variables that is often unknown or unaccounted for. There are also many biases that can lead these studies to the wrong answer.
Prospective cohort studies
Prospective cohort studies differ from retrospective studies in that they conceive and design the study, recruit subjects, collect baseline information,7Some of the collection (follow-up) methods include: questionnaire by mail, internet (these days), phone interviews, in-person interviews, physical examinations, laboratory or imaging tests, or combinations of these. all before the subjects have developed the outcomes of interest.
Investigators identify a cohort of potential subjects who can be followed for a long period of time. This allows the investigators to follow-up with the subjects, determine if and when the subjects developed an outcome of interest, if and when they become lost to follow-up, and whether their exposure status changed during the follow-up period. Eligible subjects must meet certain parameters, called inclusion criteria. In addition, studies also have exclusion criteria, which are characteristics that disqualify prospective subjects from inclusion in the study.
Prospective studies have the advantage of reducing certain types of bias that can often occur in retrospective studies. Prospective studies, for example, reduce selection bias because the outcome is not known at baseline.
The prospective study appears more experimental. By assembling two groups similar in every respect except for their smoking behaviors, for example, the “intervention” is cigarette smoking rather than an alleged health-promoting agent. (But remember, there is no random assignment here.) In 1954, Richard Doll and Austin Bradford Hill did just that.
They set up a study to determine the frequency of lung cancer in smokers and nonsmokers moving forward (i.e., prospectively), among groups of persons whose smoking habits were already known (i.e., no random assignment). In 1951, Doll and Hill wrote to all registered physicians in the United Kingdom and asked them to fill out a questionnaire about their smoking habits. They ended up using the data in 24,389 men to look at smoking and mortality.
Doll and Hill8“Note that Austin Bradford Hill’s surname was Hill and he always used the name Hill, AB in publications,” notes his Wikipedia page. “However, he is often referred to as Bradford Hill. To add to the confusion, his friends called him Tony.” followed this group forward, tallying the deaths, 789 in total. When the data came in, heavy smokers had death rates 24 times higher than nonsmokers. Not only that, of the 36 deaths attributed to lung cancer, every single one of them occurred in smokers (Figure 3). (Keep in mind that among these physicians, only 12.7%, or 3,093 of the 24,389 men, were non-smokers.)
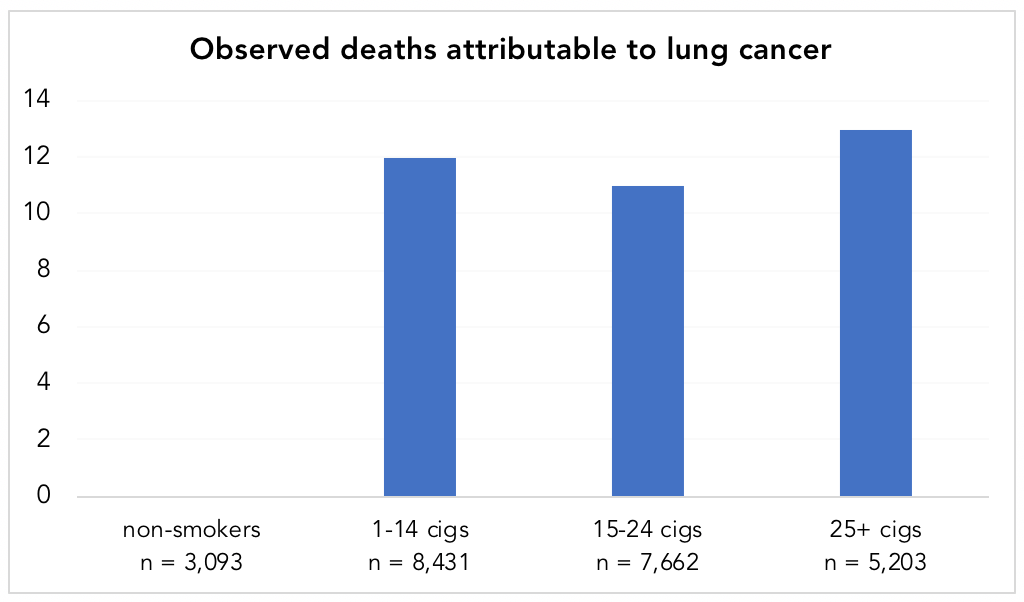
Figure 4. Observed deaths attributable to lung cancer in smokers vs. non-smokers. Data from Doll and Hill, 1954. Note: while there appears to be a lack of a dose-response relationship in the chart, the standardized death rate per year, per 1,000 men, was 0.0, 0.5, 0.7, and 1.14 for non-smokers, 1-14 cigarettes/day, 15-24 cigarettes/day, and 25+ cigarettes/day, respectively (showing a dose-response).
This is an “ideal” scenario from an epidemiological perspective. The most prominent example used to consider the success of epidemiology as a systematic method of establishing reliable knowledge (cigarette smoking and lung cancer) didn’t need sophisticated statistical analysis to make its point. In other words, you didn’t need a PhD in statistics to figure this one out–the hazard ratios were so large. To be clear, there could have been confounders—maybe the doctors who didn’t smoke were all a certain type of doctor and by being that type of doctor were missing out on some other toxin that truly caused the cancer—but the magnitude of the difference would offer a lot of wiggle room to “correct” for that.
Let’s step back (about 70 years) for a minute. Cigarette smoking in the 1950s was likely very different—and we know it was much more prevalent—than today. Virtually everyone today is aware of the reported dangers of smoking and its relationship to lung cancer. Because of this, it is likely that today’s smoker is considerably less health-conscious than the smoker of the 1950s, and therefore might engage in many other behaviors that are associated with an increased risk of death and disease. In this respect, cigarette smoking likely had fewer confounding factors in the 1950s. The healthy-user bias was almost assuredly not as insidious as it is today. Remember (Figure 4), 87% of UK physicians responding to Doll and Hill’s survey in the early 1950s smoked cigarettes. By the 1990s, the reported rate of cigarette smoking by physicians in the UK was as low as 3%. (The CDC reports that in the early 1960s, men in the US who smoked were 12.2 times more likely to develop lung cancer than men who did not smoke; “by 2010, that risk had more than doubled, from 12.2 to 25.” The 2014 Surgeon General’s Report believes that “ventilated filters and increased levels of certain chemicals in cigarettes may have played a role.” We think this might also have something to do with the healthy-user bias, but more on that later.)
Stated another way, an epidemiologic survey of smokers today will have a harder time identifying cause and effect because today smoking is a marker of poor health choices, something it was not in the 1950s. Wonder if the same is true about eating processed meat?
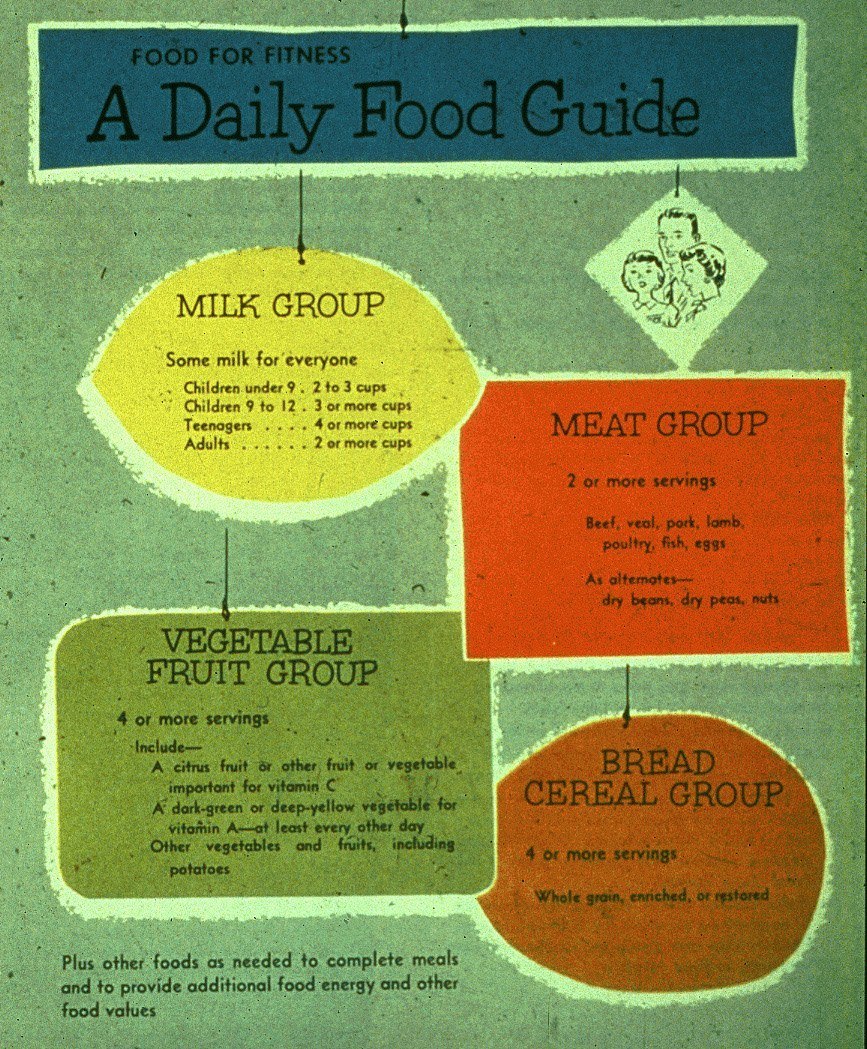
Figure 5. In the 1950’s the United States Department of Agriculture (USDA) recommended its “Basic Four” food groups. This included 2 or more daily servings from the “meat” group.
Once recommended liberally as part of a healthy diet (Figure 5), “processed red meat” and “red meat” are akin to four-letter words in public health circles today, and are now markers of questionable health choices and poor health status (e.g., smoking, physical inactivity, lower fruit and vegetable intake, higher trans fats intake, higher sugar and refined carbohydrate intake, obesity, diabetes, metabolic syndrome). As much as epidemiologists would like (or claim) to control for such factors, they cannot accurately do so.
§
In a future installment, we’ll discuss why randomization is so critical, how epidemiologists try to control for biases, and how you can discern the signal from the noise of information you’re barraged with.


